


In this article, we will be discussing the Awesome Oscillator technicalindicator that is used to analyze stock performance.
I will provide
- A brief introduction to the theory or concept behind Awesome Oscillator
- A demo of the template and how you can use it to calculate Awesome Oscillator for any stock you are interested in.
What is Awesome Oscillator Indicator?
Awesome Oscillator measures the momentum of the stock.
How to calculate Awesome Oscillator indicator?
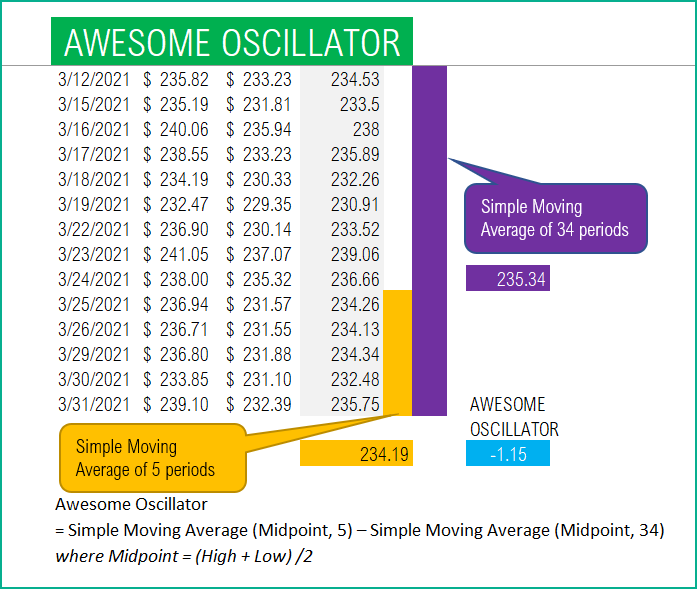
It calculates the difference between a 34 period and 5 period Simple Moving Averages. The Simple Moving Averages are calculated using the midpoints (between high and low) of each period’s price.
Awesome Oscillator = Simple Moving Average (Midpoint, 5) – Simple Moving Average (Midpoint, 34)
where Midpoint = (High + Low) /2
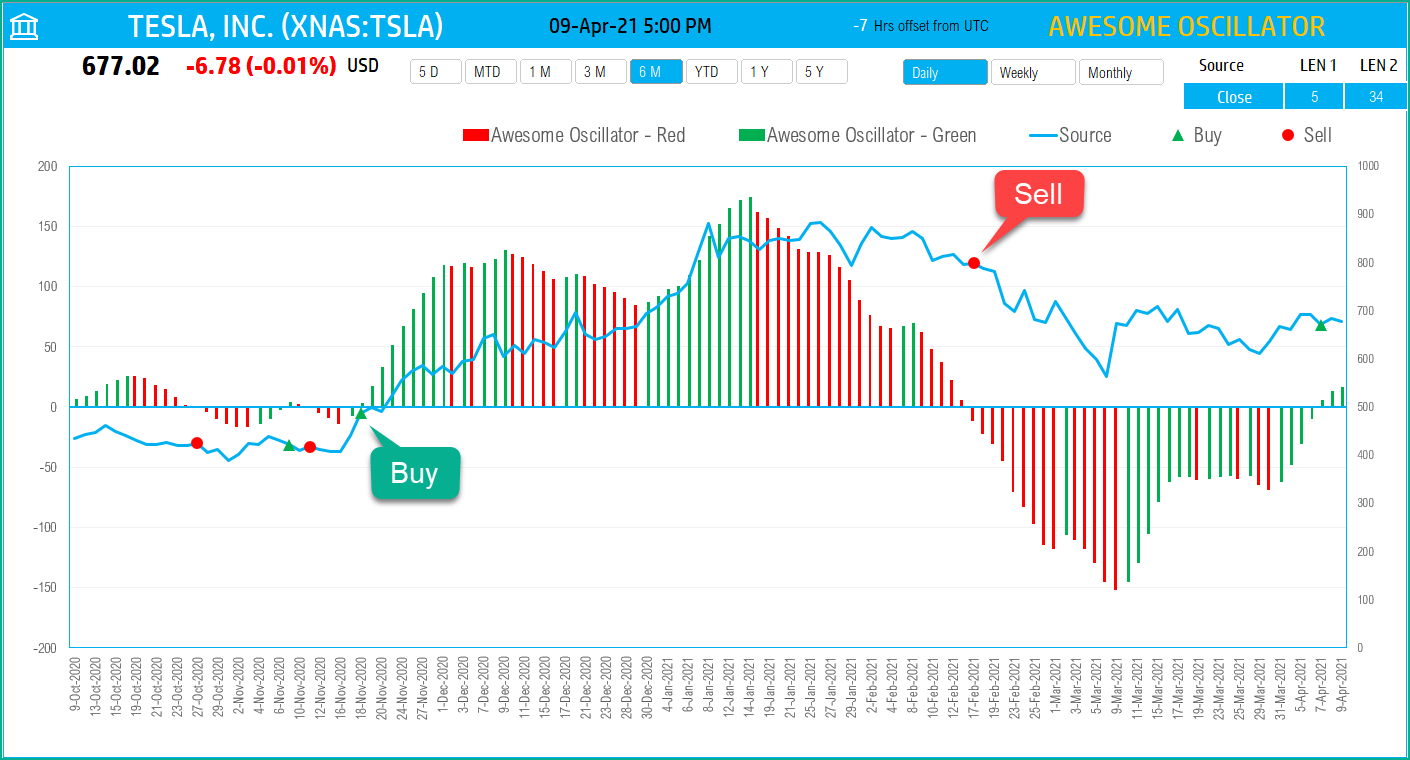
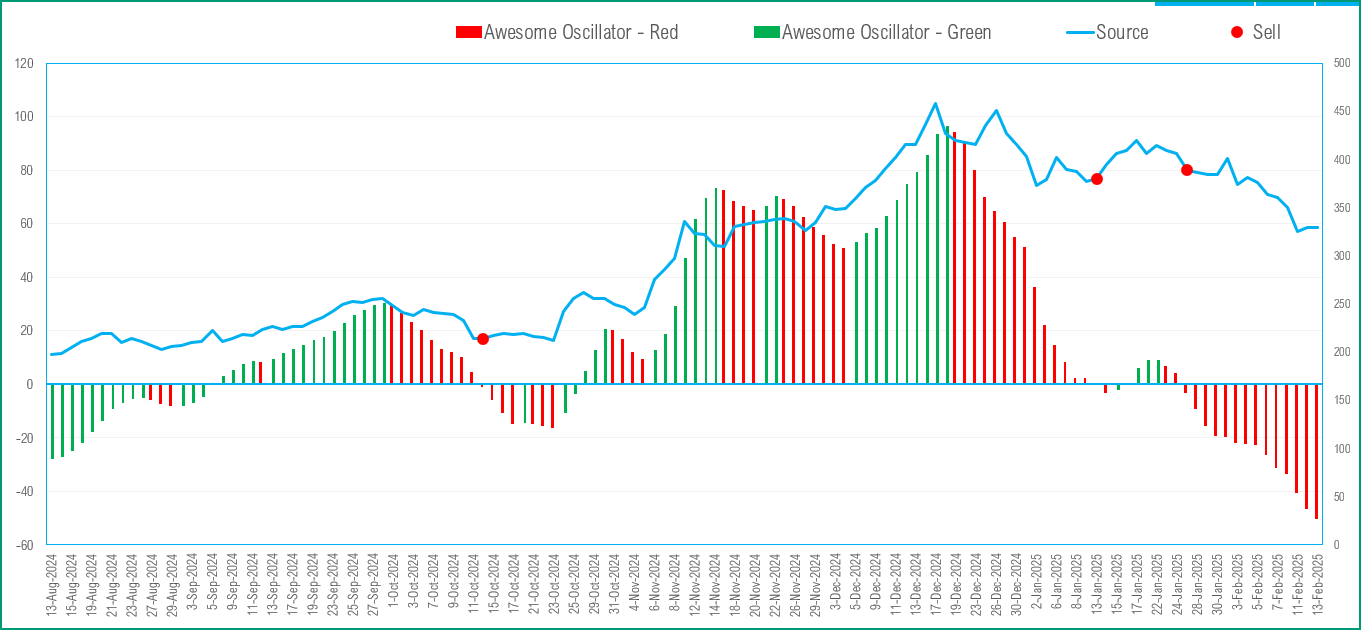
Such indicators are called Oscillators, as they oscillate around the zero line going above or below the zero based on market changes.
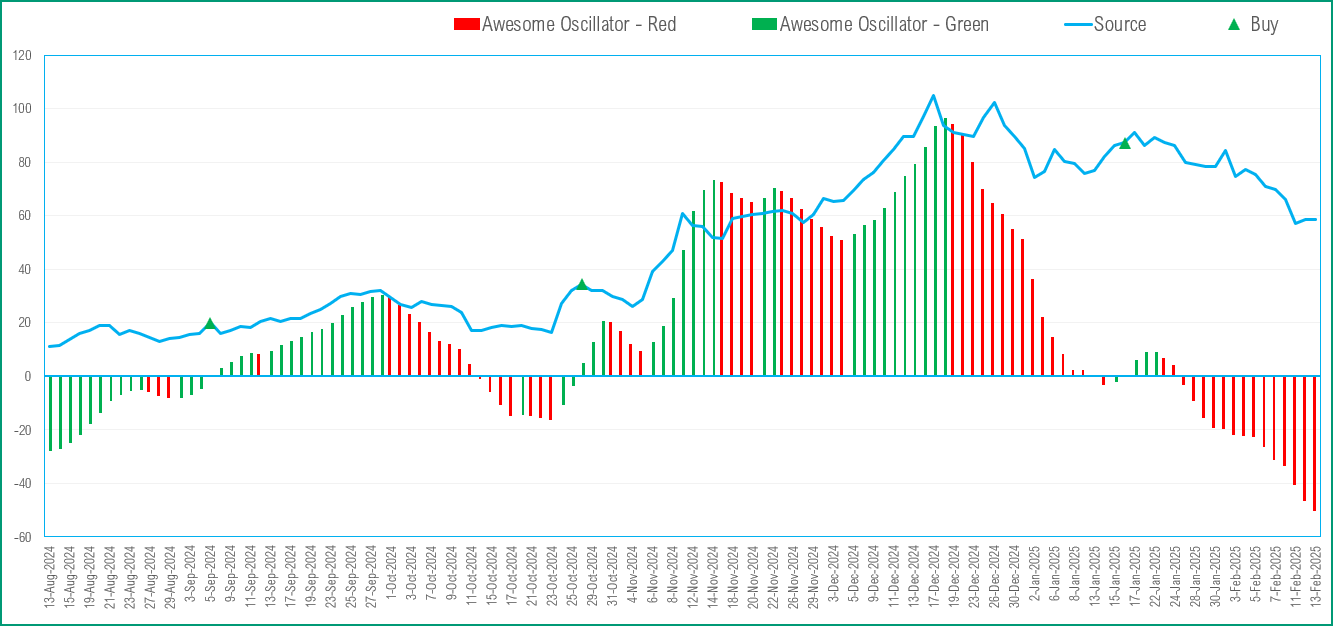
The values are plotted as a histogram of red and green bars. A bar is green when its value is higher than the previous bar. A red bar indicates that its value is lower than the previous bar.
Such indicators are called Oscillators, as they oscillate around the zero line going above or below the zero based on market changes.
A potential signal strategy for Awesome Oscillator (AO) is
When AO crosses above the Zero Line, short term momentum is now rising faster than the long term momentum. This can present a bullish buying opportunity.
When AO crosses below the Zero Line, short term momentum is now falling faster than the long term momentum. This can present a bearish selling opportunity.
TradingView
Excel Template
The template will help you create the Awesome Oscillator automatically and also calculate the trading signals instantly for any stock.
Download
Video Demo

How to refresh data?

Requirements
To pull live Stock data from the services you would need either Microsoft 365 Subscription Plans for PC and Web
How to create Awesome Oscillator Indicator in Excel?
Type in a stock sticker symbol on the top left.

If Excel does not recognize your stock symbol, it will pop up this data selector box.
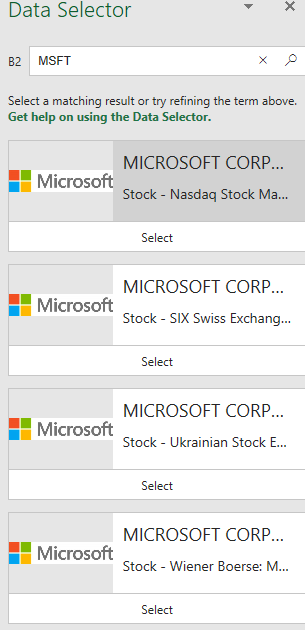
You can select the stock you are interested in.
Period
The template can pull up to 5 years of price history by default. You can choose how much history to display on the chart easily using the slicer buttons.

The options are 5 Days, Month Till Date, 1 Month, 3 Months, 6 Months, Year Till Date, 1 Year, 5 Years.
Interval
The template allows price history at 3 different intervals.

Daily/Weekly/Monthly are the options.
Input Parameters
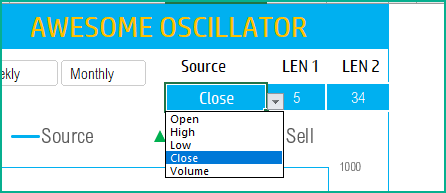
Source: You can choose from Open, High, Low, Close or Volume, to display on the chart. This does not change the AO calculation.
Length 1: You can type in a length in periods. The commonly used is 5.
Length 2: You can type in a length in periods. The commonly used is 34. The chart will update automatically based on all the above inputs
The chart will update automatically based on all the above inputs.
Signals
The template shows the Buy and Sell signals on the chart.
- If the AO value crosses the zero line (moves from below to above), then a Buy signal is generated.
- If the AO value crosses the zero line (moves from above to below), then a Sell signal is generated.
- If neither, no signal is generated.
In addition, if the latest day has a Rising or Falling signal, it is displayed on the top next to the current price.
Timezone
On the top right you can see the maximum of the last trade time of these currencies.
The default time that Microsoft provides is UTC. The offset is set to -7 hrs, to convert to pacific time zone.
You can modify this if you need the time in a different time zone.
Visit https://savvytime.com/converter/utc to view offset.
Resources
For more Excel Templates for Stock Market, visit indzara.com/stock-market-templates
-
 SMA Strategy Backtester Google Sheets Template$25
 -
 SMA Strategy Backtester Excel Template$25
 -
 RSI Strategy Backtester Google Sheets Template$25
 -
 RSI Strategy Backtester Excel Template$25
 -
 MACD Strategy Backtester Google Sheets Template$25
 -
 MACD Strategy Backtester Excel Template$25
 -
 Simple Moving Average Stock Screener Google Sheet Template$25
 -
 Stock Screener Excel Template$97
 -
 Simple Moving Average Stock Screener Excel Template$25

Feedback
Please share your feedback on this template in the Comments below. If you find this useful, please share with your friends who may benefit from this content.