I have received requests around how to change the colour gradient for the Geographic Heat Map (India) Excel template. In this quick tutorial, I will explain how to do it.
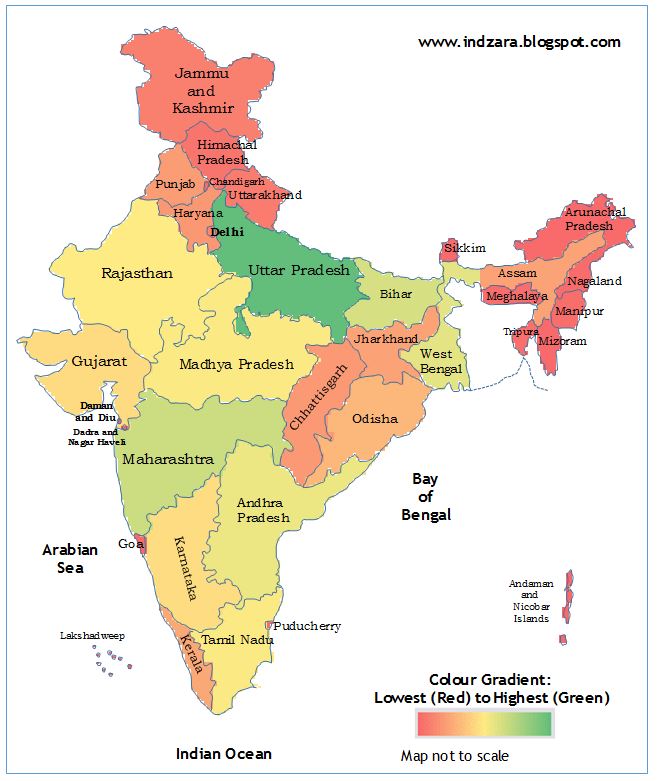
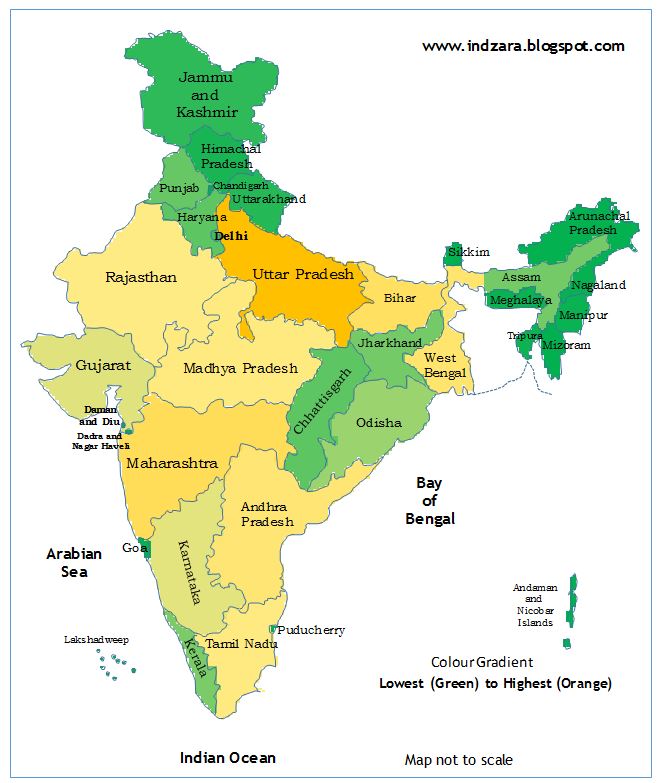
Step 1: Download and open the Geographic Heat Map (India) Excel Template. The map looks like the image below.

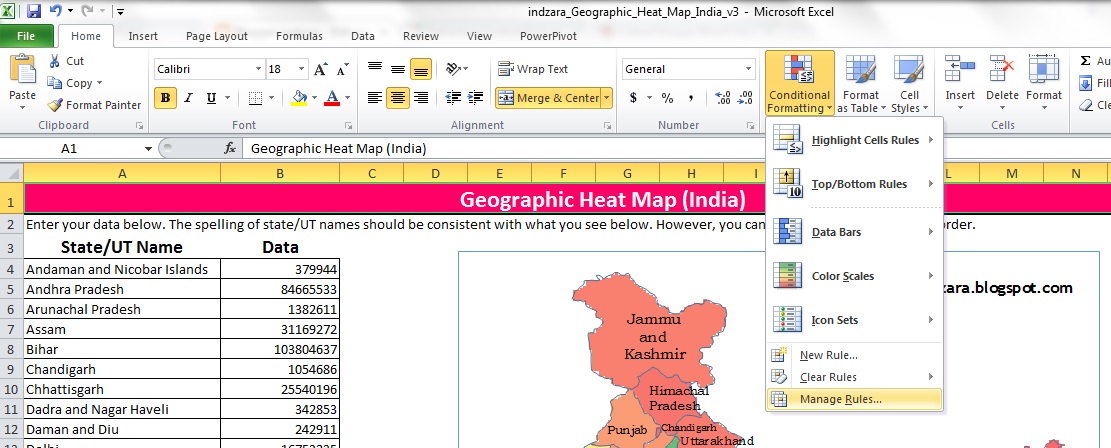
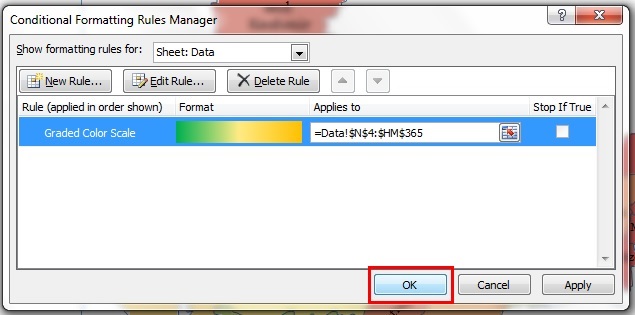
Step 2: Open Conditional Formatting menu and choose Manage Rules
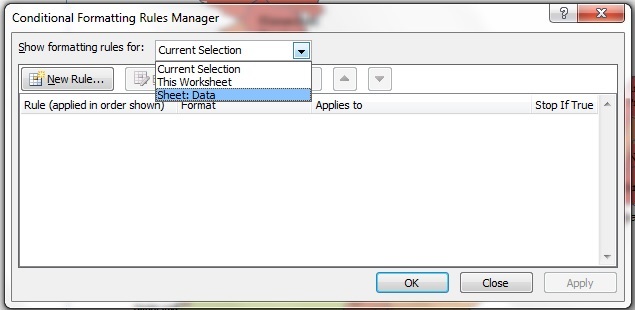
Step 3: Choose Sheet: Data

Step 4: Click Edit Rule
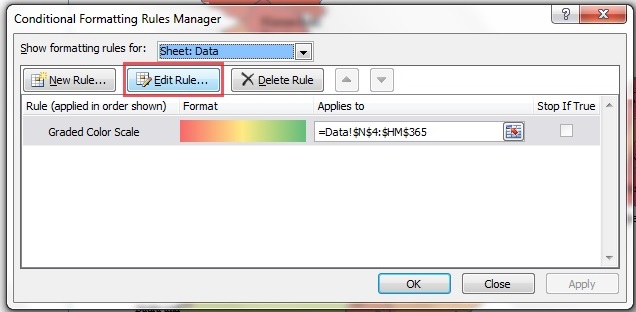
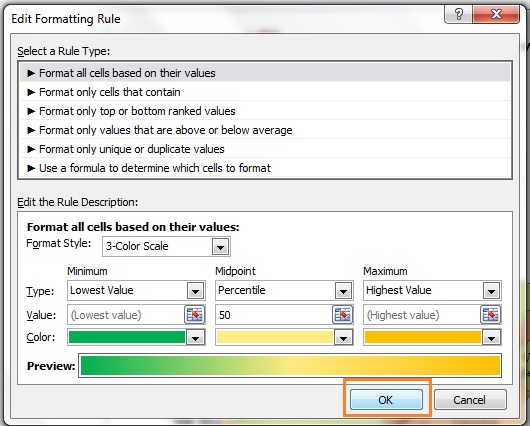
Step 5: You should see the existing conditional formatting rule as shown below

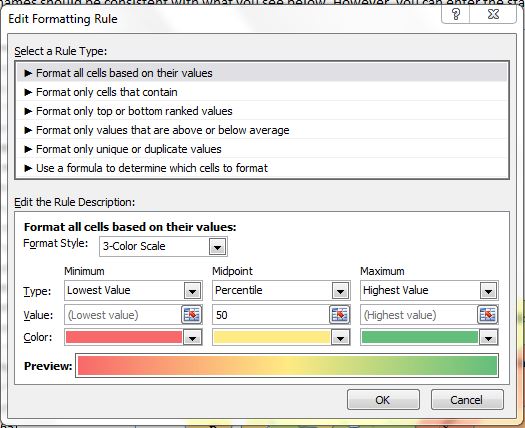
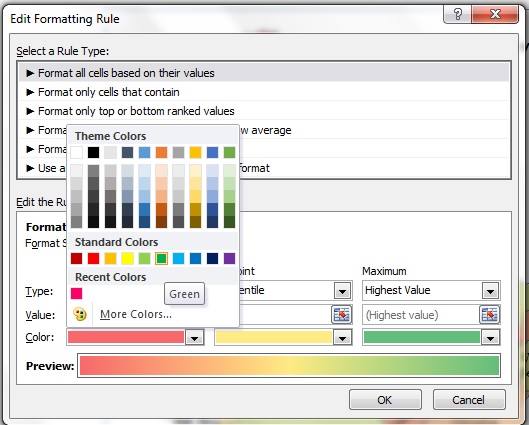
Step 6: Change the colour for the minimum to your choice. This is the color that will be applied to the states with the lowest numbers in your data.

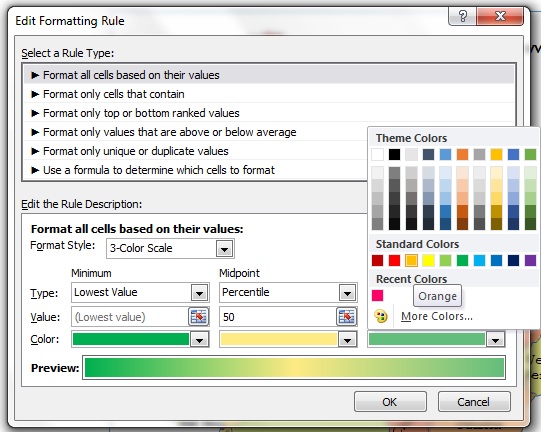
Step 7: Change the colour for the maximum to your choice. This is the colour that will be applied to the states with the highest numbers in your data.

Step 8: Click OK

Step 9: Click OK in the next dialog box.

Step 10: Back in the Geographic_Heat_Map worksheet, scroll down to row 40. Edit the text to reflect the colours you changed now. (You can enter any text here as you prefer.) This will be displayed on the map image so that those who read the map understand the colour gradient used.

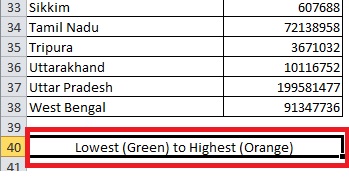
Your map image will update automatically.
Related free Templates
- Kerala State Heat Map
- Tamil Nadu State Heat Map
- World Heat Map Excel Template
- World Cup Cricket Dashboard