Earned Value Management (EVM) is a technique (Wikipedia) used in project management to measure progress of a project with respect to cost. In this article, we will cover the basics of EVM, why it is useful and also a free Excel template which will help calculate the metrics for us.
Why Earned Value Management (EVM)?
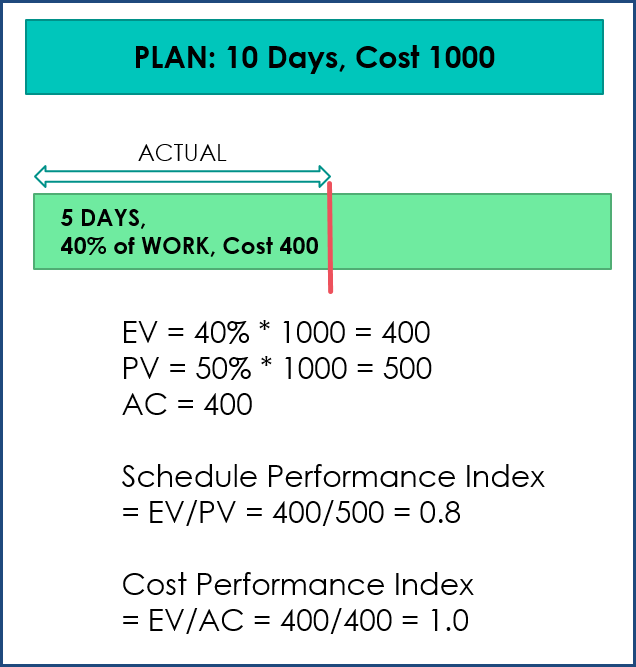
Let’s take a simple project of painting our home. Before we begin the project, we estimate that it will take 10 days to complete painting and it will cost 1000. Then, we start the project.
After 5 days, let’s say it has cost us 400 and we have completed 40% of the work. According to our original plan (assuming work is uniformly distributed over time), we should have completed 50% of the project by now and it should have cost us 500.
Now, if we want to assess how our project has gone so far, how would we do? Purely comparing the cost (actual 400 vs planned 500) would not give us the true picture. The actual cost is less than planned and it may appear that we are under budget. However, the work completed is only 40% compared to planned 50% and we are behind schedule.
So, in order to have measures that truly reflect the progress made compared to plan, we introduce a term called ‘Earned Value’ to calculate the value of work performed so far. In our example, work performed so far is 40% of total work and so Earned Value is (40% * 1000) = 400.
What is Earned Value Management?
Video of Earned Value Management Terms & Definitions

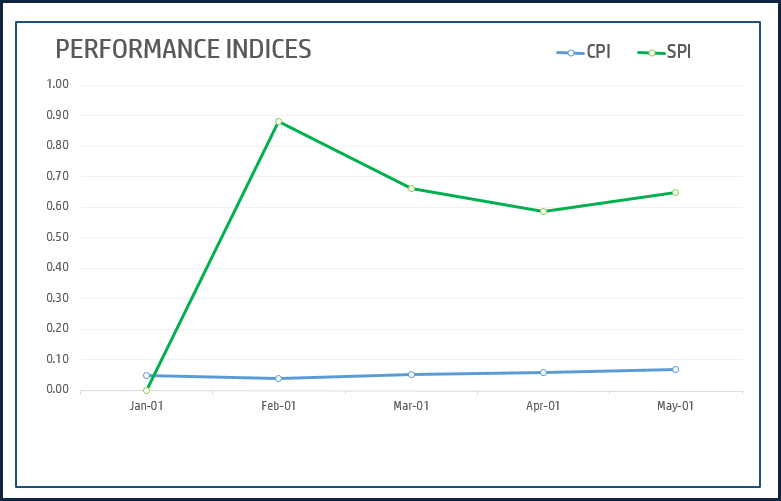
Efficiency Indicators
Cost Performance Index (CPI)
To calculate our Cost Efficiency (how we are progressing compared to our planned cost/budget), we can compare this Earned Value with Actual Cost (which is 400). 400/400 = 1.0. We are exactly on planned cost (neither over nor under).
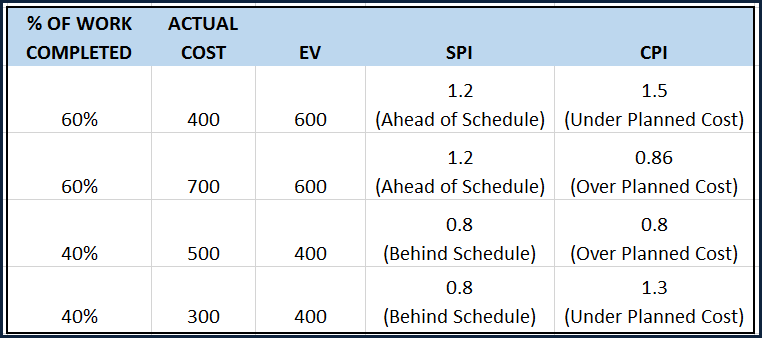
A number above 1 means ‘Under Planned Cost’. A number below 1 means ‘Over Planned Cost’.
Schedule Performance Index (SPI)
Now, to calculate our Schedule Efficiency (how we are progressing compared to our planned schedule), we can compare Earned Value with Planned Value (which is 500). 400/500 = 0.8. So, we are behind schedule.
A number above 1 means ‘Ahead of Schedule’. A number below 1 means ‘Behind Schedule’.
Here are some other scenarios and we can see how SPI and CPI change based on % of Work Completed and Actual Cost.
Variances
In addition to the indices, we can also calculate the variances which will provide the actual differences.
Cost variance (CV) is the difference between Earned Value and Actual Cost. CV = EV – AC
A positive value indicates Under Planned Cost while negative value will mean Over Planned Cost.
Schedule Variance (SV) is the difference between Earned value and Planned Value. SV = EV – PV
A positive value indicates Ahead of Schedule while negative value will mean Behind Schedule.
Terms & Definitions
Let’s recap the terms we have covered this far. I have followed the terminology as presented in the PMBOK (Project Management Body of Knowledge) (Links: PMI, Wikipedia)
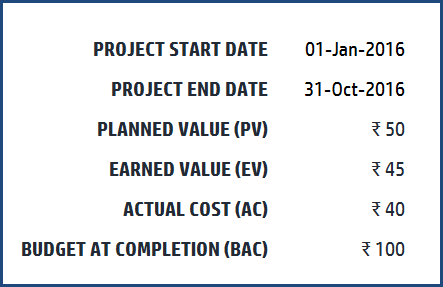
- PLANNED VALUE (PV): Authorized Budget assigned to the scheduled work 500
- EARNED VALUE (EV): Measure of actual work performed expressed as budget authorized for that work 400
- ACTUAL COST (AC): Actual cost incurred for the work performed 400
- SCHEDULE VARIANCE (SV): Amount by which project is ahead or behind plan = EV – PV = -100
- COST VARIANCE (CV): Amount by which actual cost is ahead or behind planned cost = EV – AC = 0
- BUDGET AT COMPLETION (BAC): Total Budget assigned to the entire plan 1000
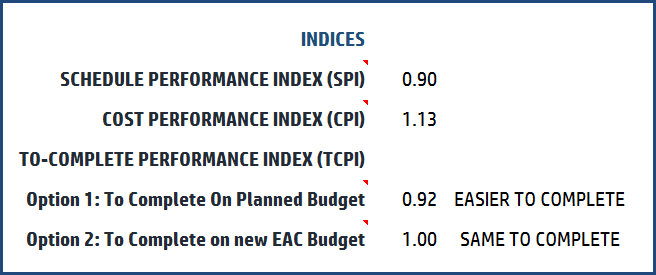
- SCHEDULE PERFORMANCE INDEX (SPI): Measure of Schedule efficiency expressed as Earned Value to Planned Value = EV/PV = 0.8
- COST PERFORMANCE INDEX (CPI): Measure of Cost efficiency expressed as Earned Value to Actual Cost = EV/AC = 1.0
Forecasting
An extension of the Earned Value calculations is Forecasting, which deals with estimating how the rest of project will go.
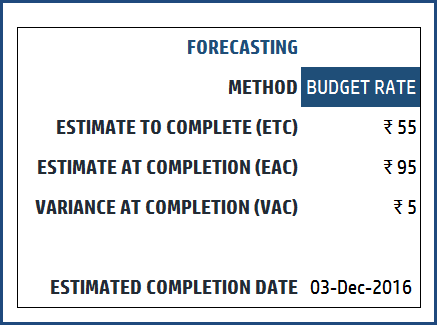
Estimate at Completion (EAC) is the expected total cost by the end of the project. It is the sum of Actual Cost (AC) so far and Estimate To Complete (ETC). EAC can be calculated using different forecasting methods. The following are three common methods.
- Budget Rate: If we assume the rest of the project will cost at the original planned budget rate, then EAC = AC + (BAC – EV)
- CPI: If we assume the rest of the project will cost at the cost efficiency we have seen so far, then EAC = BAC/CPI
- SPI & CPI: If we assume the rest of the project will cost based on the cost and schedule efficiencies we have seen so far, then EAC = AC + [(BAC-EV) /(CPI*SPI)]
ETC = EAC – AC
Once we know the EAC, we can calculate the Variance at Completion (VAC) which represents the cost difference between project’s planned budget and current estimate. VAC = BAC – EAC.
The final index we will calculate is the To-Complete Performance Index (TCPI) which represents the cost performance that is needed from now onwards to achieve the goal. It can be thought of as ‘Work Remaining / Funds available’. Work Remaining = BAC – EV. Funds available = BAC – AC
TCPI = (BAC – EV)/(BAC – AC)
If your new estimate has been approved, Funds Available will be EAC – AC. Then, the formula for TCPI will be
TCPI = (BAC – EV)/(EAC – AC)
If TCPI is >1, it is ‘Harder to Complete’ and if it is <1 it is ‘Easier to Complete’.
I have also added the term Estimated Calculation Date (ECD), calculated as Project Start Date + (Planned Duration/SPI).
Earned Value Management in Excel
Now that we have covered the terms involved, let’s see how the template works in calculating these for us.
Overview of Steps:
- Enter basic project information in SETTINGS
- Enter Plan information in PLAN sheet
- Enter Actual work performed in ACTUAL sheet
- Enter Actual Cost in ACTUAL_COST sheet
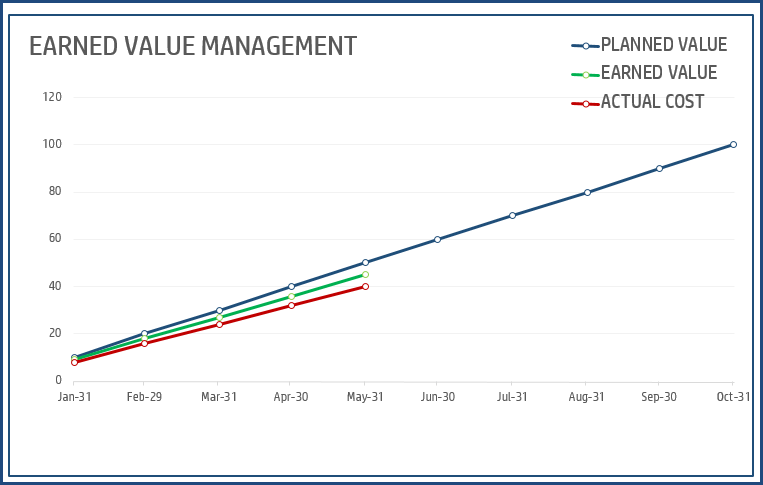
- View EVM sheet for the output calculations
Free Download
Video Demo of Excel template

Step by Step tutorial on Earned Value Management in Excel
We start by entering basic information in the SETTINGS sheet.
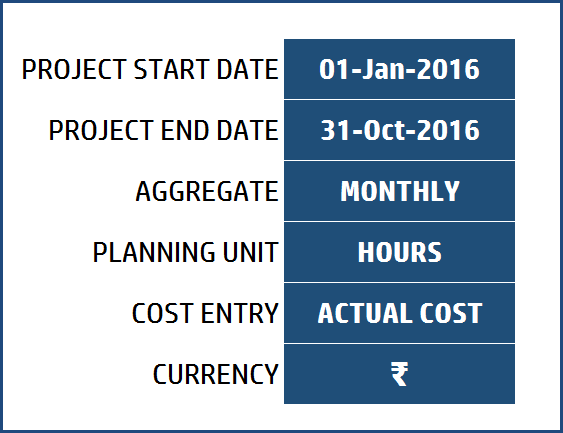
- Enter Project Start Date and Project End Date.
- Choose how you will aggregate data (Weekly vs Monthly)
- Choose Planning Unit (Hours, Cost).
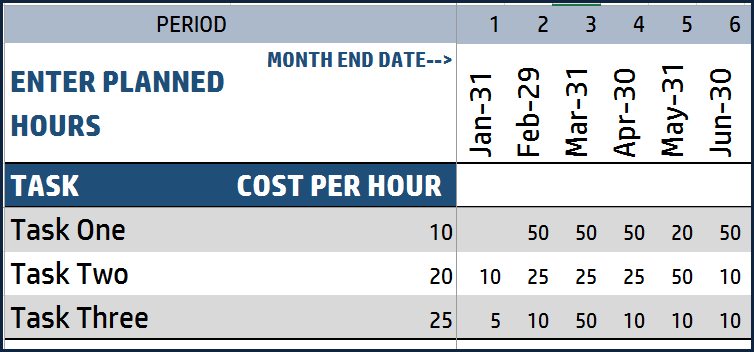
- You can enter hours of planned work and cost per hour. The template will do the calculation for cost.
- Or you can directly enter planned cost yourself.
- Choose Cost Entry (Actual Cost, Cost Change)
- You can enter actual cost or the change (compared to planned cost). If there are only few places where the actual cost is different from the planned, then you can enter only those and save time.
- Choose Currency from the available choices. This setting will apply currency formatting to our output. You can choose OTHER if your currency is not listed, and then apply formatting manually.
Now, in the PLAN sheet, we can enter the planned hours for each task in each period. The period labels will auto-populate. You can add any number of tasks to the table.
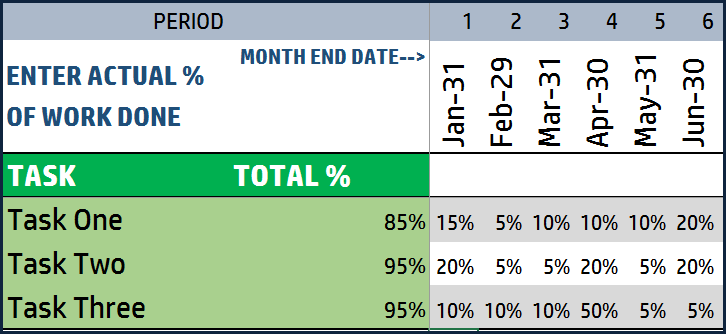
Then, we move to the ACTUAL sheet. Here, we enter the actual work % performed for each task in each period. Task Names will auto-populate as you enter the % data.
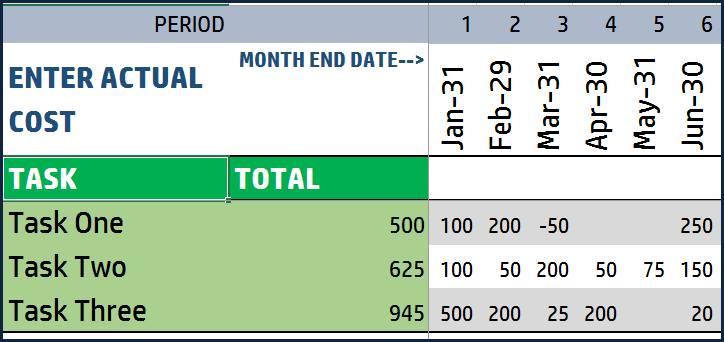
For the final piece of data entry, we enter the actual cost for each task in each period in the ACTUAL_COST sheet.
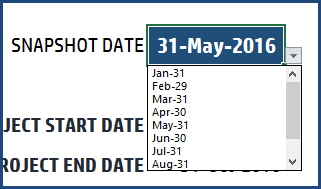
We are ready to see the results in the EVM sheet. You can choose any snapshot date from the drop down.
You will see all the terms that we discussed earlier.
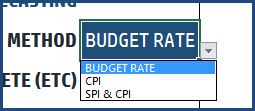
Forecasting Calculations: Choose the forecasting method.
The EVM sheet is protected with password indzara to prevent accidental modification of formulas. Please feel free to unprotect and make changes as needed.
All the terms used in this template are listed along with definitions in the TERMS sheet.
Please leave your feedback in the comments below. If you find the template and the post useful, please share.