


You can use this template to view rate history of Currency pairs in Foreign Exchange market.
In this article, I will go over the following.
- Forex Currency chart template and its features
- How to add your own flags for additional currencies?
Download
Video Demo
Template features
A very important visual in the area of stock markets is the price chart of a stock.
Using our free template, you can view the currency exchange rates in Excel itself for any currency pair. you are interested in. The template allows
- Entering a currency pair symbol to pull in up to 5 years of price history
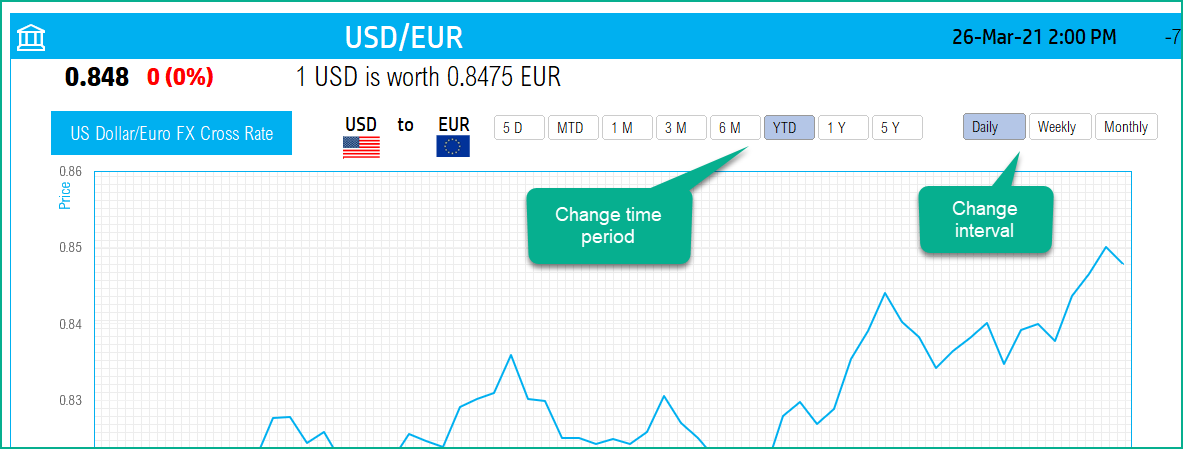
- Allows controlling the period displayed on the chart (5 days, Month To date, 3 Months, 6 Months, etc.)
- Allows controlling the interval of price data – Daily, Weekly or Monthly
You can change the symbol and immediately view the chart for a currency pair.
For example, in the below image, I typed in EUR/USD to view the Euro-USD rate.
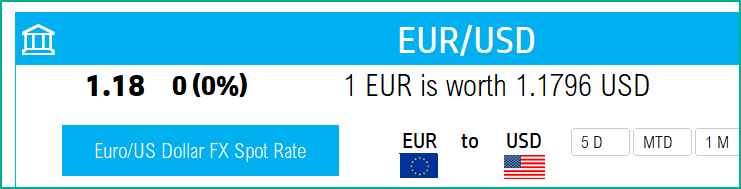
You can type in EUR/USD or EURUSD.
I have shown that 1 EUR is worth 1.1796 USD at that time. You can also see the flags representing the currencies.
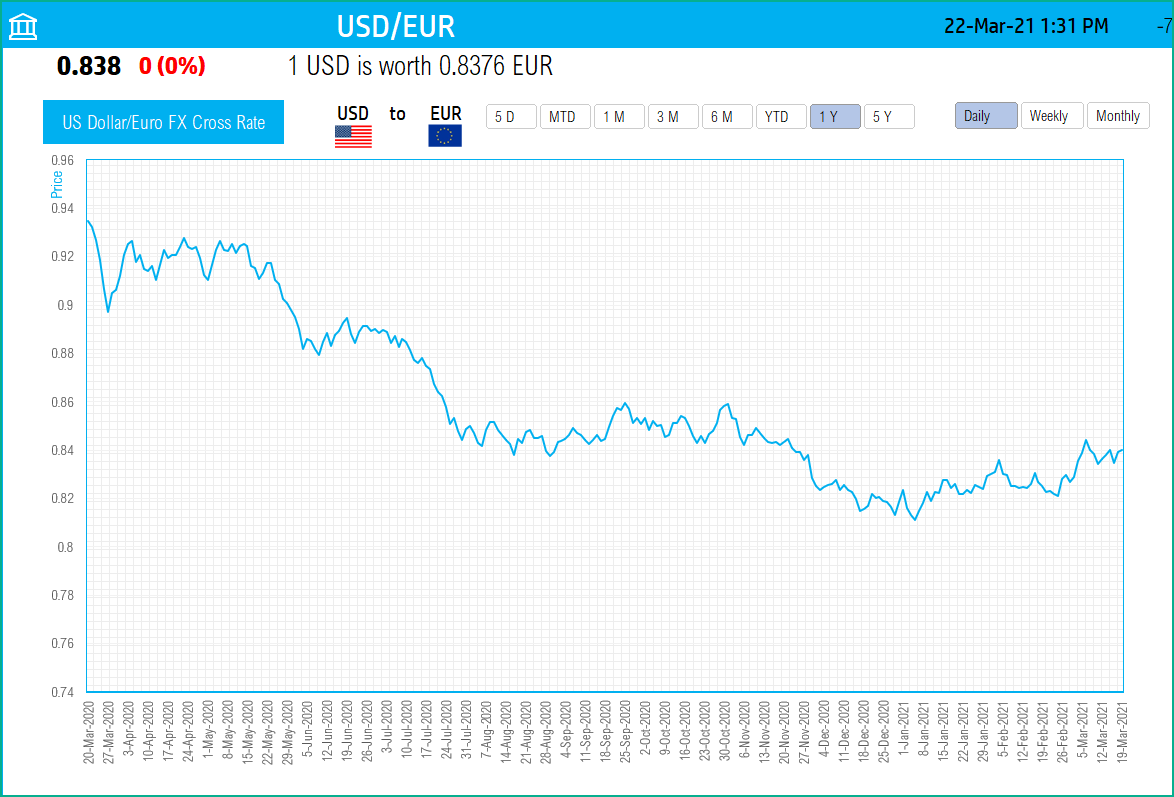
If I type in USD/EUR, I get the below.
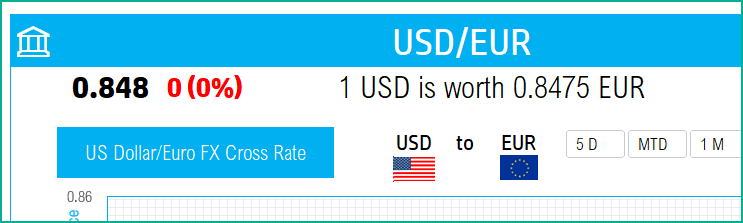
It says 1 USD is worth 0.8475 EUR.
You can also change the time period and interval.
The foundation of this is the StockHistory function.
Please read more on StockHistory function and how we use to extract the price history of a stock or currency.
Here is the link to the article from Microsoft which shows which exchanges are available and the delay in data refresh for each.
How to refresh?
To refresh the price and other information, just use the regular Excel refresh in the Data ribbon.

How to add your own flags?
By default, I have provided flags for 8 different currencies. You can see them in the hidden Flags sheet.
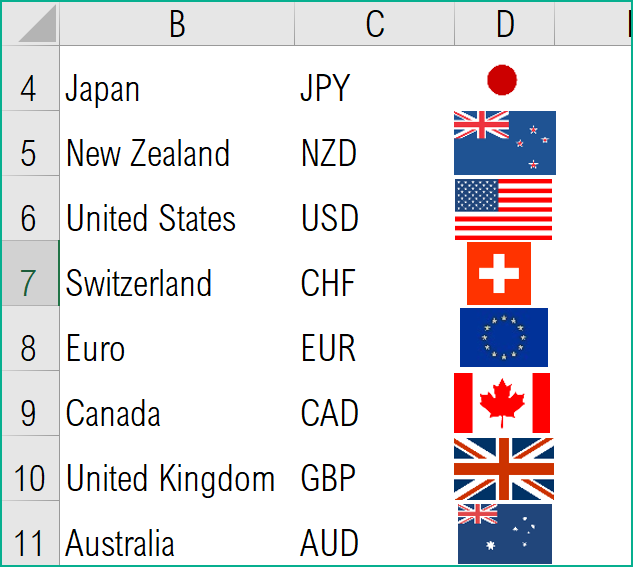
If you enter a currency pair outside these 8 currencies, there is no flag to display.
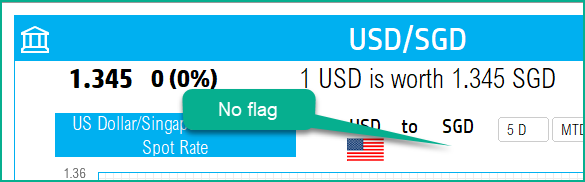
Not a problem. Adding more flags is really simple.
To add flags for more currencies and make them appear in the Chart, follow these 2 simple steps.
- Insert a flag image in the cell D12 in the hidden Flags sheet.
- Name that cell with the Currency code name.
Example: If I wanted a flag to represent the currency code INR,
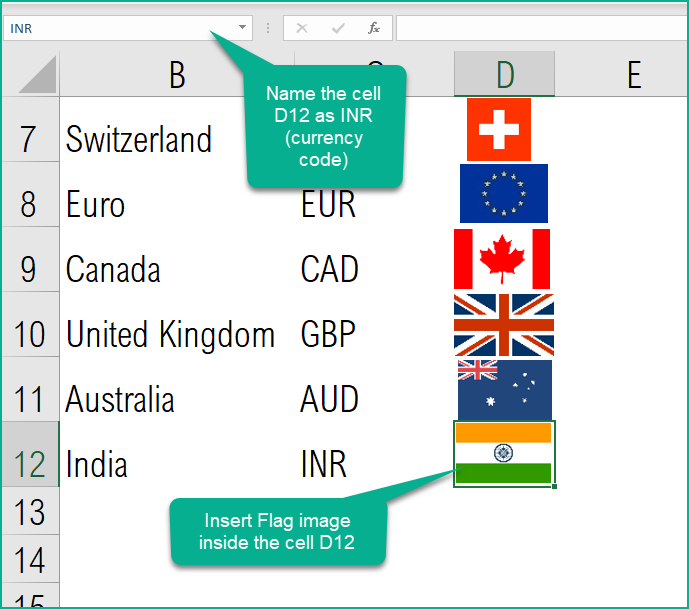
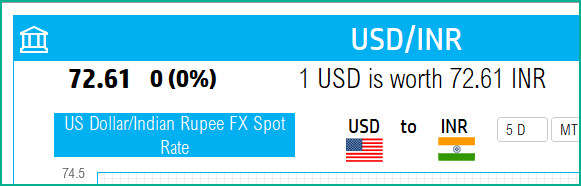
The key here is that the cell name should match the currency code. You do not have to make any more changes. The new flag will appear if you choose a currency pair using the new currency.
To add more than one new flag, just keep adding more flags in the column D – in cell D13, D14 and so on. Make sure you name those cells with the appropriate currency codes.
Requirements
Microsoft has introduced a new feature in Excel called Data types. One of the data types is ‘Stocks’. That’s what we will be using for these templates. This feature is available in Microsoft 365 Subscription Plans for PC and Web
For all the templates in this ‘Excel for Stock Market’ series, please visit indzara.com/stock-market-templates
-
 SMA Strategy Backtester Google Sheets Template$25
 -
 SMA Strategy Backtester Excel Template$25
 -
 RSI Strategy Backtester Google Sheets Template$25
 -
 RSI Strategy Backtester Excel Template$25
 -
 MACD Strategy Backtester Google Sheets Template$25
 -
 MACD Strategy Backtester Excel Template$25
 -
 Simple Moving Average Stock Screener Google Sheet Template$25
 -
 Stock Screener Excel Template$97
 -
 Simple Moving Average Stock Screener Excel Template$25

Feedback
Please share your experience. I expect this to be different with different exchanges and countries. Is it working for you? Is it working differently? I would love to hear from you.