
In this article, we will cover the options and features available in the Gantt Charts in Project Manager Excel Template. Gantt Chart is a commonly used visualization method to display project timelines. Project Manager template allows planning and managing a project from start to finish. It includes a GANTT sheet which builds automatic Gantt charts. It also provides a lot of options to customize the Gantt charts.
For more details on the template, please see video on Highlights of Project Manager Excel template
If you prefer video demo to text, please watch the video below, else continue to read further for the tutorial with screenshots and text.
VIDEO DEMO

Before we get into the details, it will be good to get an overview of the components or sections of the Gantt sheet.
6 SECTIONS
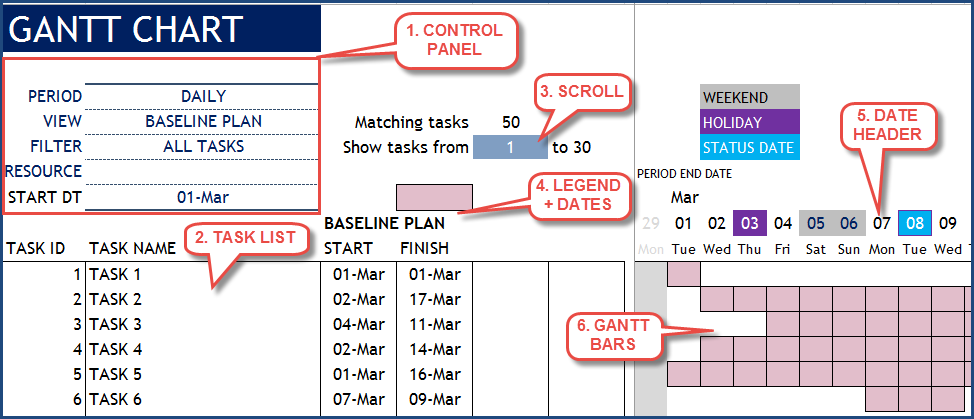
1. CONTROL PANEL: Here is where we have the options to customize the Gantt chart. We will see more details later in this article.
2. TASK LIST: List of up to 30 tasks that qualify based on the options chosen in the Control Panel. Task ID and Task Name are listed.
3. SCROLL: If there are more than 30 matching tasks, we can see them by changing the beginning number.
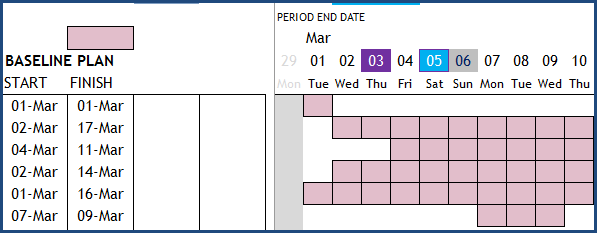
4. LEGEND + DATES: Depending on the View chosen in the Control Panel, the Dates and Legend will update. The dates are the start and finish dates that will be used to create the Gantt bars. The Legend will help in interpreting what the Gantt bars represent.
5. DATE HEADER: Dates on the timeline axis controlled by options in the Control Panel.
6. GANTT BARS: Actual bars reflecting the chosen View for the tasks selected
Now, let’s take a closer look at the sections.
CONTROL PANEL
The control panel has 5 fields.
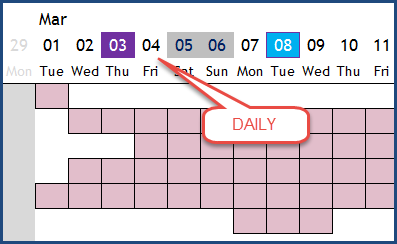
PERIOD
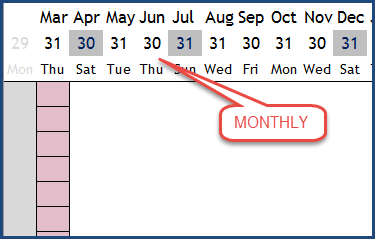
You can choose the Gantt chart to be Daily, Weekly or Monthly.
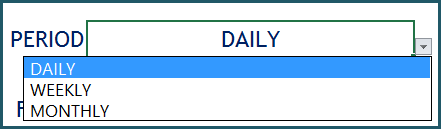
When you change this, the Date Header changes and the Gantt bars update accordingly.
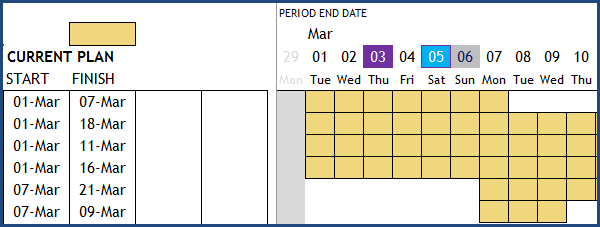
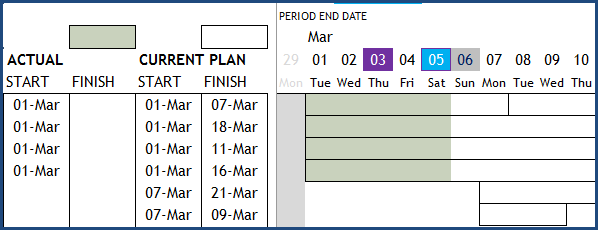
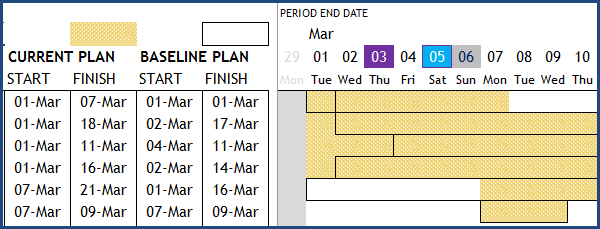
VIEW
There are four possible views: Baseline Plan, Current Plan, Actual and Current Plan Vs Baseline Plan.
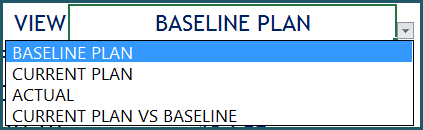
Each view updates the Legend + Dates and the Gantt Bars.
FILTER
This allows us to control which tasks are represented in the Gantt Chart. We have 3 options here 1) display all tasks, 2) display only tasks for one specific resource or 3) only milestones. This will update the Task List.
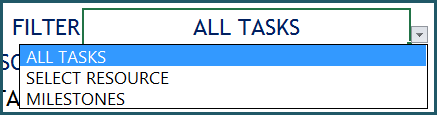
Milestones are tasks that are flagged with M in the MILESTONE column in the TASKS sheet.
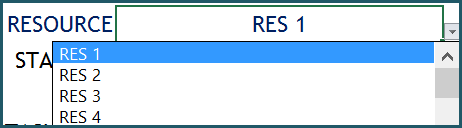
RESOURCE
If we had chosen SELECT RESOURCE in the Filter, then we have to provide a resource name. Then, only those tasks that are assigned to the chosen resource will be listed.
START DT
We can control where the Gantt Chart begins by typing any Start date.
SCROLL
The matching 30 tasks are represented in the Gantt chart. If we would like to ‘scroll’ and see the next set of 30 tasks, we can. For example, in the image below, there are 50 matching tasks.
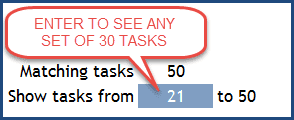
By typing 21 in the cell, we will be able to view tasks 21 to 50 (30 at a time).
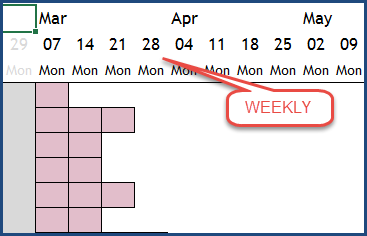
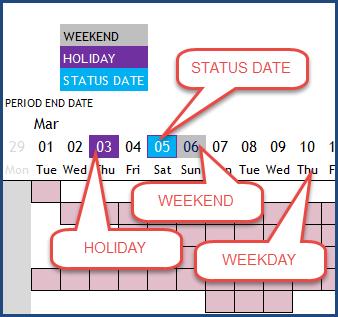
DATE HEADER
The date header will display the period end date. If the period chosen is Weekly, then, it displays the Week End Date. Similarly, if Monthly period is chosen, it displays the Month End Date. In addition, holidays, weekends and status date are highlighted.
GANTT BARS
The Gantt bars represent the duration of each task. Let’s take a sample task, as shown in the image below.
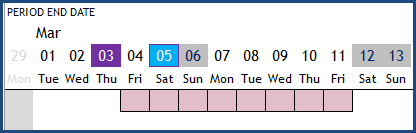
The task begins on Mar 4th and ends on Mar 11th. It does not mean that work is scheduled for every day in between. It just means the task begins on 4th and ends on Mar 11th. There may be days in between where no work is scheduled.
PRINTING
The Gantt chart and the data are set up for printing. We can use the standard printing method in Excel. Press Ctrl+P to open print preview and print as needed. If you would like to change the print area, just select the area for printing and choose ‘Set Print Area’ in Page Layout ribbon.
EXPORTING TO PDF
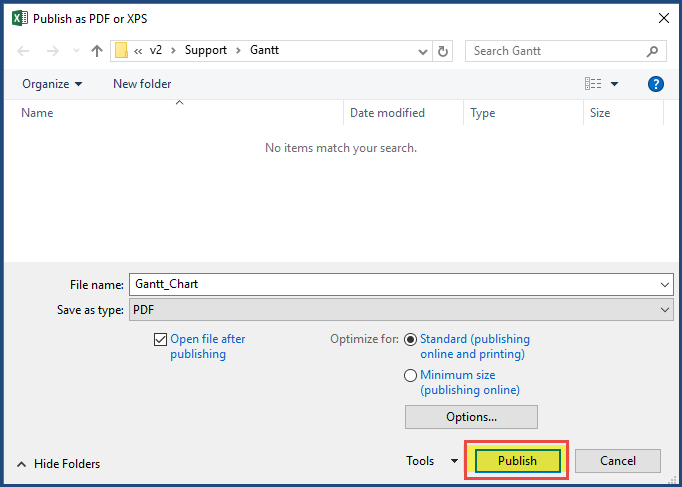
We can easily export the Gantt chart to PDF as well. From File menu, choose Export –> Create PDF/XPS
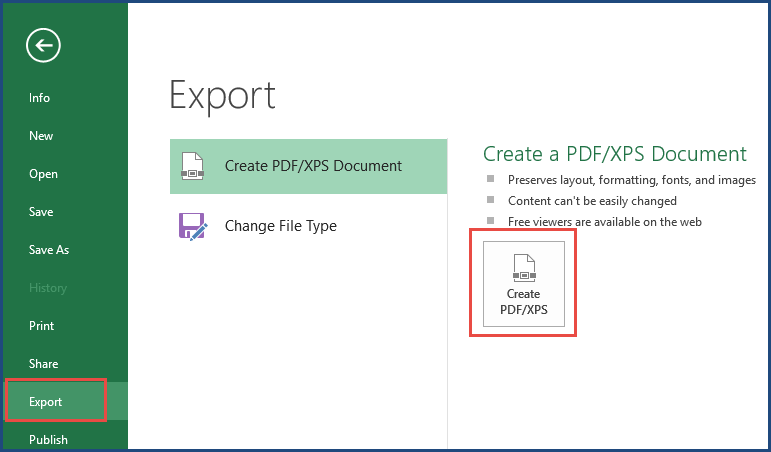
Then, give a name to the PDF file and select the folder in your computer to store the PDF. Click Publish.
LIMITS
The template allows 30 tasks to be displayed at a time for a maximum of 52 periods. The template comes with the password to unprotect and hence these limits can be extended by the user if needed.
If there are any questions about the Gantt charts or the template, please post them in the comments. Thank you.
RELEVANT LINKS
To create just Gantt charts without any other Project Management feature, try Gantt Chart Maker Excel Template
To plan multiple projects (along with Gantt charts), try Project Planner (Advanced) Excel Template