
In this article, we will learn how to change the gradient colors used in the U.S. Geographic State Heat Map Excel Template. Using the template, you can create a geographic heat map at the state level for 50 states of U.S using your own data.
HOW TO CHANGE GRADIENT COLORS
The template comes with the default red to green gradient colors. If you like the gradient style of colors, but would like to change the actual gradient colours used, please follow the steps outlined below.
VIDEO DEMO
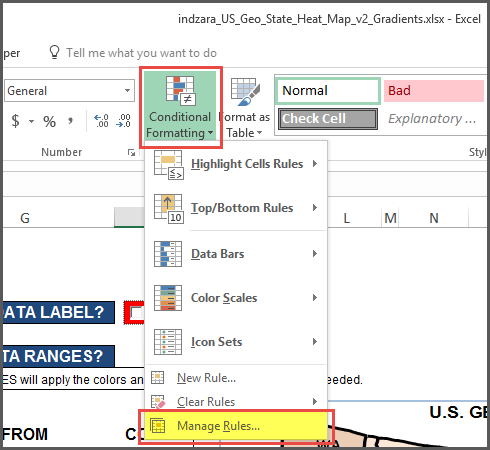
1. Open the Conditional formatting menu in Home ribbon and choose ‘Manage Rules’.
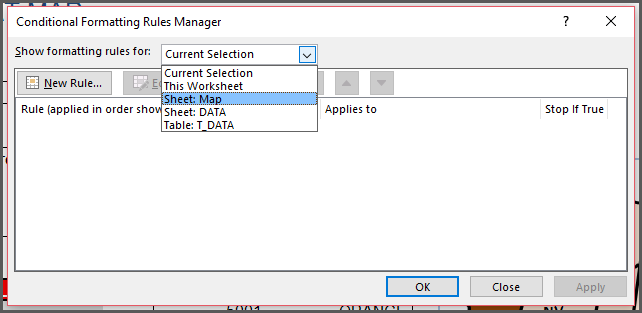
2. Choose the sheet: Map
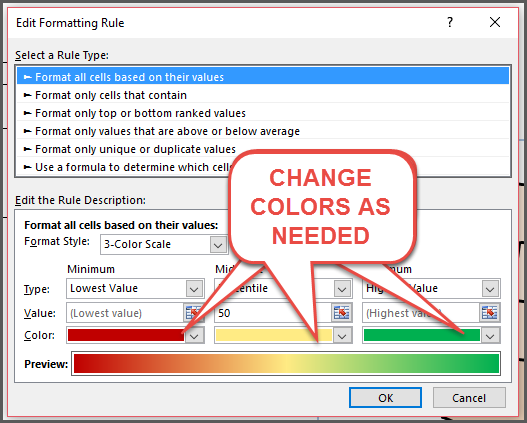
3. Select the Gradient Color Scale rule and then click Edit Rule.
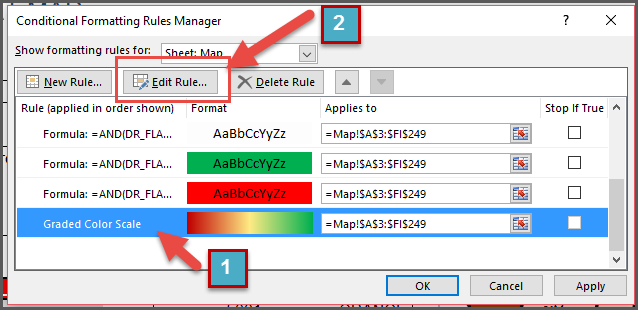
4. Change the colors (for minimum, midpoint and maximum) as needed.
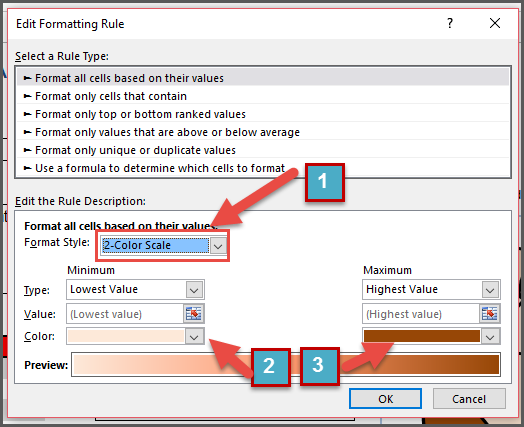
If you are familiar with Excel, you can use other conditional formatting rules and settings too. For example, you can also choose the format style be 2-Color Scale instead of the 3-Color Scale.
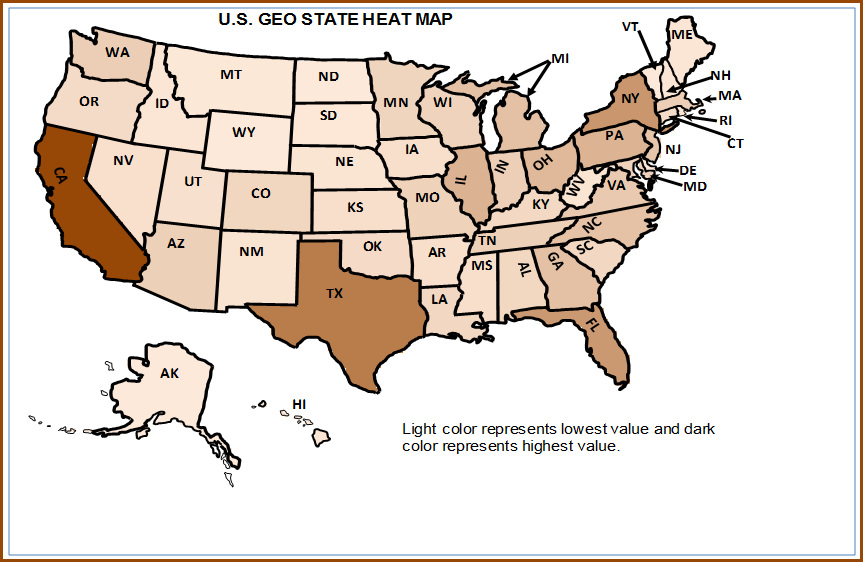
That will change the map visualization to appear like this.
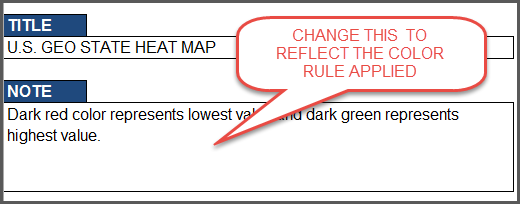
Whenever you change colors, please update the NOTE so that the footnote that appears on the map aligns with the color rule applied.
If you have any questions, please leave them in the comments below.