

In this article, we will cover the definition of an Income statement, use some examples to understand the format of an income statement. We will define the 7 parts of an income statement. We will create Microsoft’s income statement in Excel. We will also discuss how you can create an income statement for your small business using a free Excel template.
What is an Income Statement?
Let’s start with income statement definition.
An income statement is a financial statement of a company that shows the company’s revenues and expenses during a specific period. It is a representation of the ‘profitability’ of a company.
It is one of the three financial statements of a business or a company. Balance Sheet and Cash Flow Statement are the other two.
Income statement is also called using the following names:
- Profit and Loss Statement (P&L)
- Statement of Profit or Loss
- Revenue Statement
- Statement of Financial Performance
- Earnings Statement
- Statement of Earnings
- Operating Statement
- Statement of Operations
Source: Wikipedia
Video Demo

Income Statement Examples
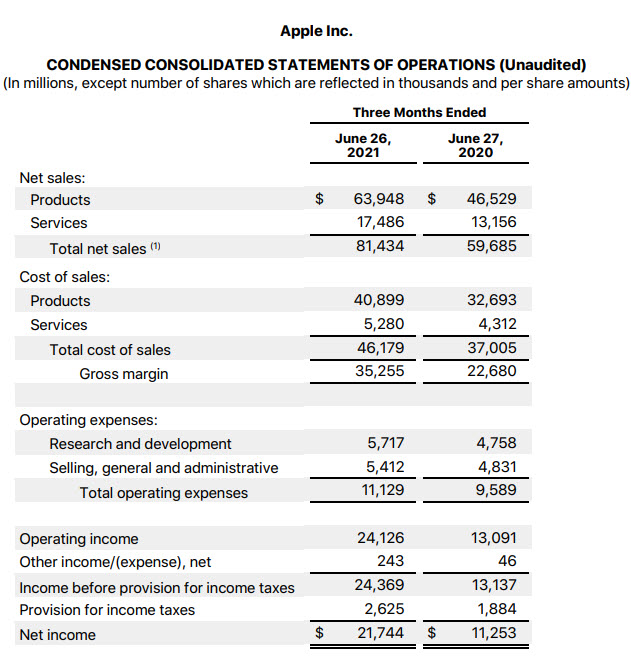
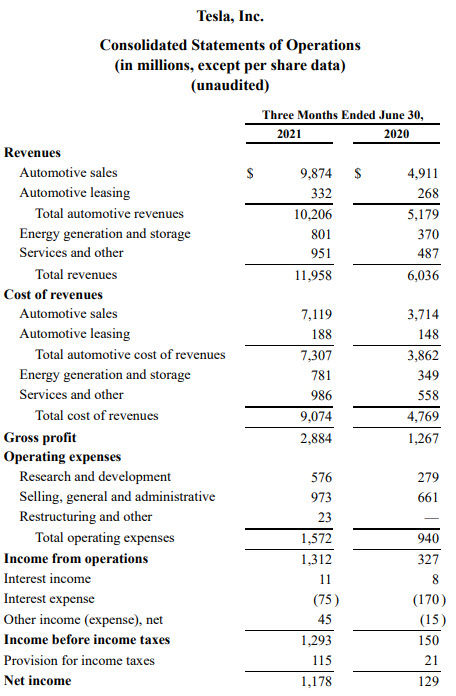
In order to understand the structure and parts of an income statement, let us take a look at some example income statements from three well-known companies, Microsoft, Apple and Tesla. These are available to download from the companies’ websites.
We will talk about some differences later, but let’s focus on similarities between the statements.
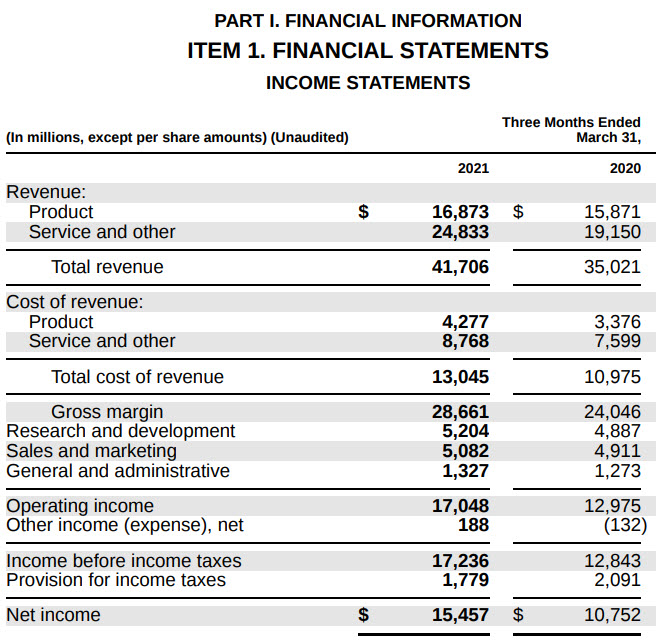
Broadly speaking there are 7 key sections that I could see. I will use Microsoft’s income statement for this illustration.
- Sales or Revenue
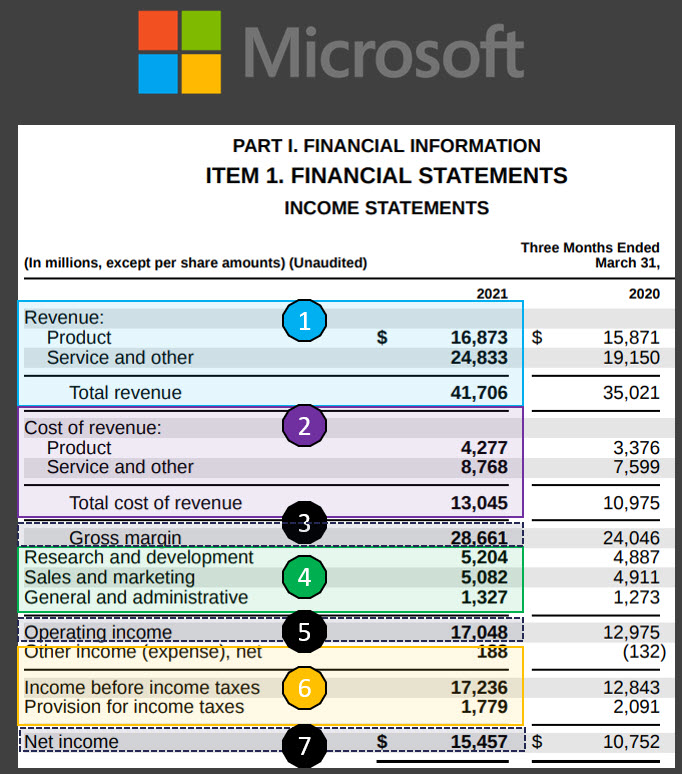
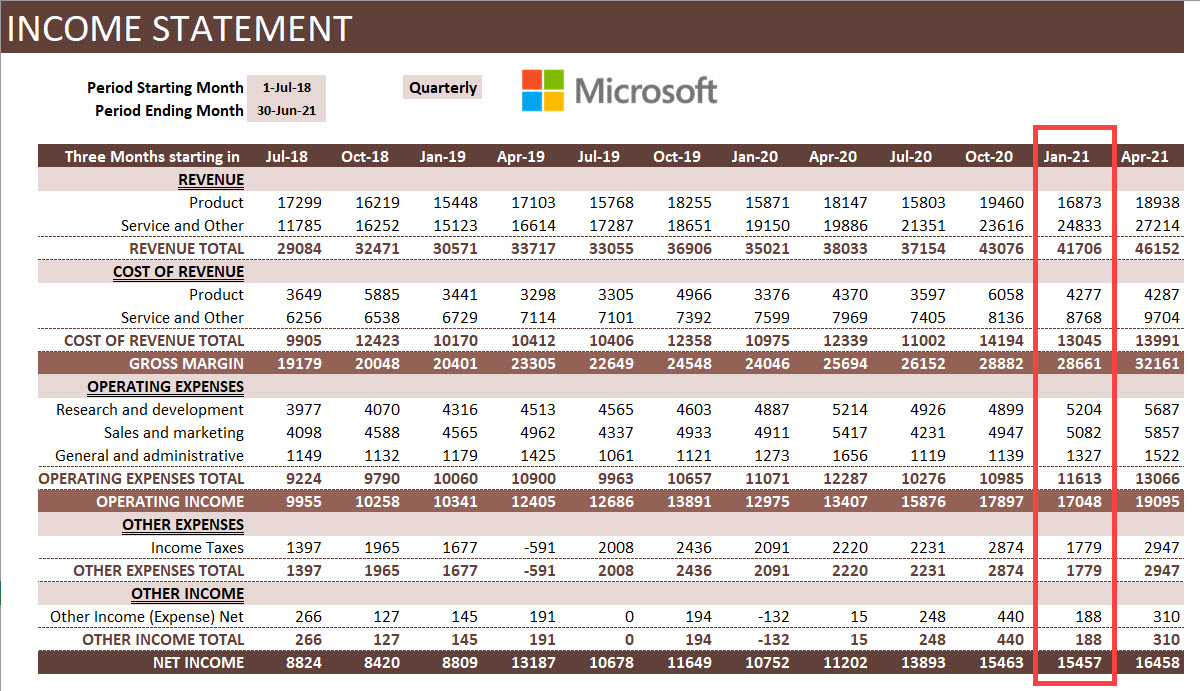
- This is the total sales recorded by the company during the period. In this case, Microsoft recorded $16,873 M of Product revenue and $24,833 M of Service and other revenue. Total Revenue was $41,706 M in 3 months ending March 31, 2021.
- This typically represents the sales amount of products and services shipped out to customers during the period. Whether the customers have made the payments to Microsoft is immaterial when it comes to the Income statement. When the cash actually flows into Microsoft will be reflected in a different financial statement (Cash Flow Statement).
- This is called the top line.
- Cost of Sales or Cost of Revenue
- This is the direct cost of producing the goods. This will typically include raw materials, labor, shipping costs and other costs which were needed to build the inventory and deliver the products and services which generated the sales in the previous section.
- In this case, Microsoft spent $4277 M for Product and $8768 M for Service and Other. Totally cost of revenue was $13,045 M
- Also called as Cost of Goods Sold or COGS.
- Gross Marginor Gross Profit
- This is the amount left over from sales after removing the cost of Sales. This is a good indicator of the margin of our products or services. For example, if it costs $150 to make a product that we sell for $160, it is only $10 Gross margin on each product sold. Let’s assume 1000 products sold during the period. Though the top line may look good with $160,000 it will result in only $10,000 in Gross Margin.
- For Microsoft, if we subtract $13,045 M from $41,706 M, we get $28,661 M.
- Operating Expenses
- An expenditure may be a cost or an expense. Previously, we saw about Cost of Sales. Now, we see expenses.
- This represents the expenditure incurred by a company for operating or running the business. This includes salaries, rent and utility bills like electricity and water.
- Common grouping of Operating Expenses are
- Sales & Marketing expenses
- Research & Development (R&D) expenses
- General & Administrative (G&A) expenses
- These are sometimes called SG&A (Sales, General & Administrative) expenses.
- Microsoft spent totally $11613 M as Operating expenses. I am not sure why Microsoft does not show the subtotal on the statement. I summed the three items to arrive at $11,613 M.
- Operating Income or Income from Operations
- This is the net income for the company subtracting Operating expenses from Gross Margin. This represents a true profit margin of a company because it considers all expenses involved in running the business.
- Microsoft’s operating income was $17, 048 M (which is Gross margin $28,661 M – Operating Expenses $11,613 M)
- Other Income/Expense Net
- Apart from the business operations, if there are other income and expenses they are recorded in this section. This section will include income tax payments.
- For example, if a company sells its real estate for a profit, that will be non-operating income. Paying interest on a loan is non-operating expense, while receiving interest on a bank account will be non-operating income. Income Tax payments will be an expense.
- Microsoft has indicated that their total ‘Other income’ is $188 Million. And $1779 M has been estimated as income taxes.
- Net Income
- Net Income represents the total net income of a company, considering both the operating and non-operating incomes and expenditures. It is Operating Income – Other Income/Expense.
- Microsoft’s net inocme is $15,457 M
- If this amount is positive, that would indicate profit. If negative, it will be a loss.
- This is also referred to as the bottom line of a company.
Components or parts of an Income Statement
To summarize, the 7 parts of an Income statement are below.
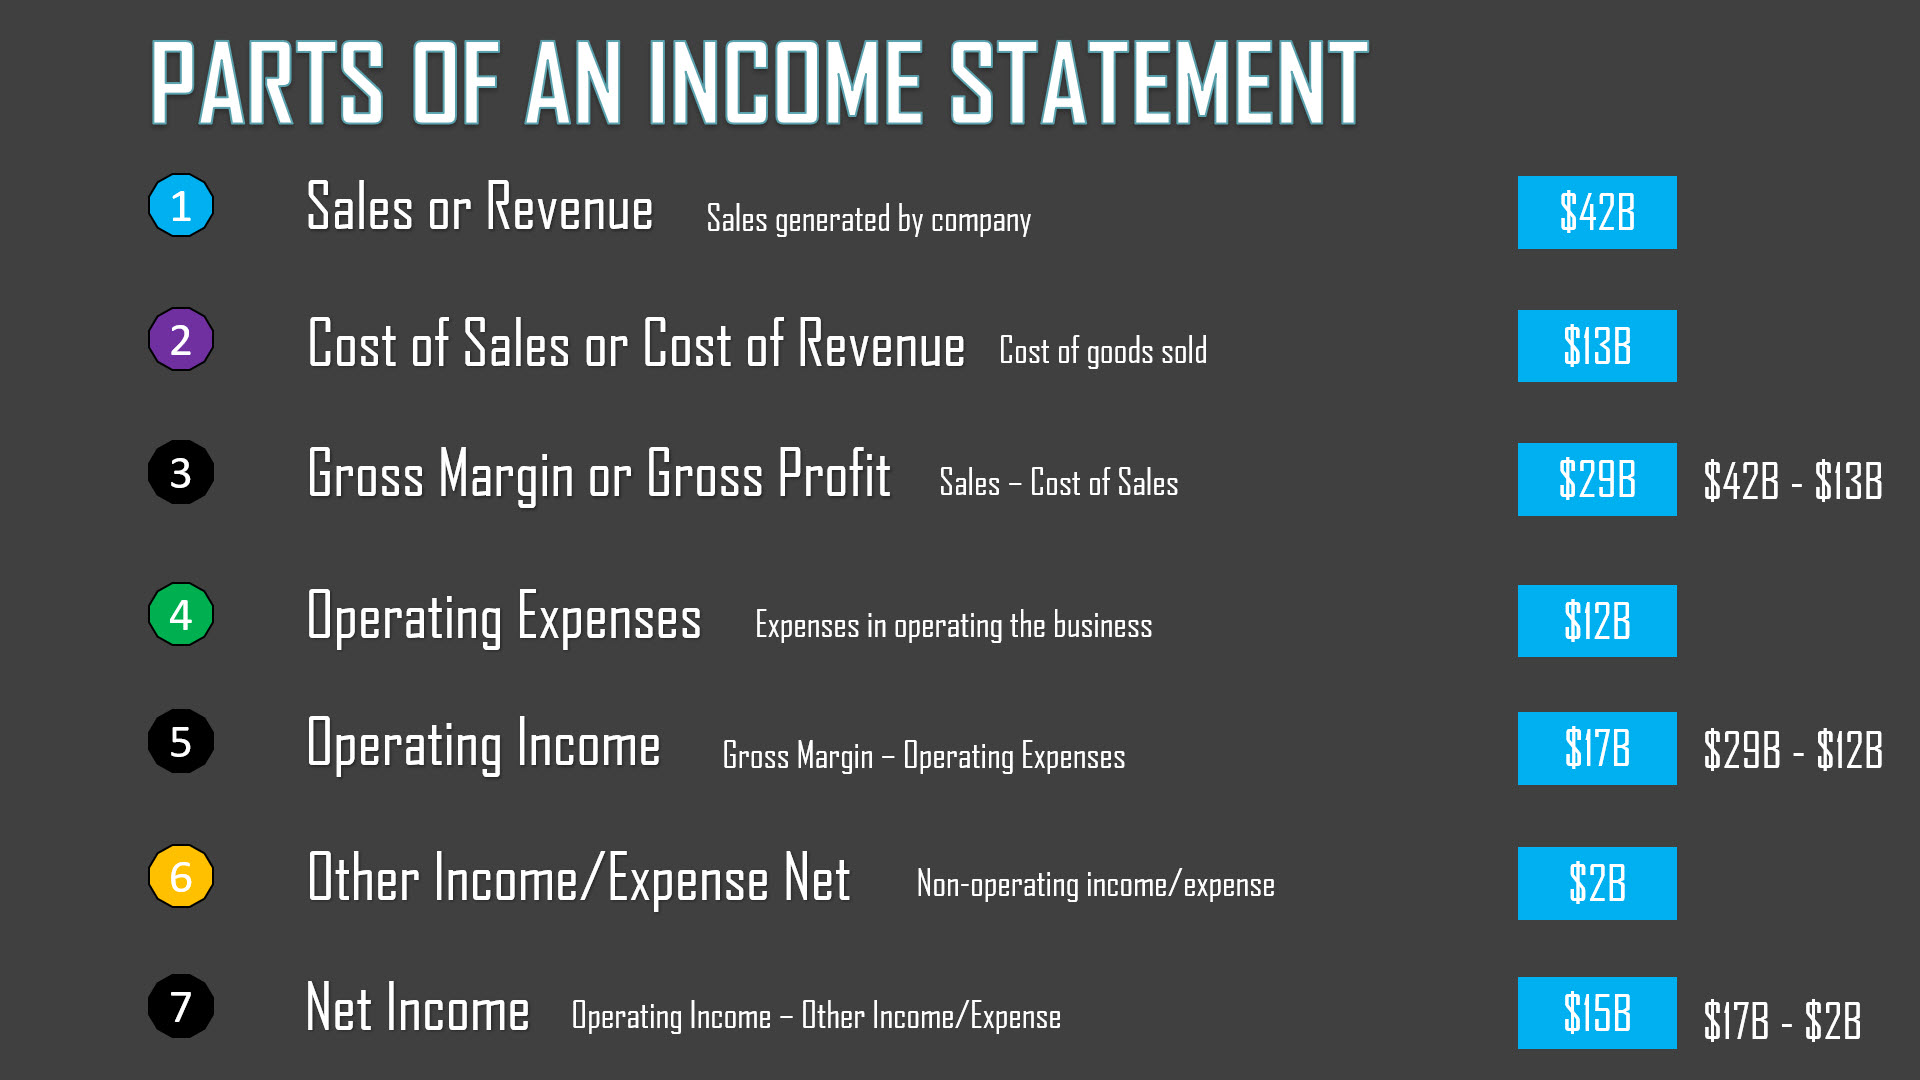
- Sales/Revenue: Sales generated by company
- Cost of Sales/Cost of Revenue: Cost of producing the goods sold
- Gross Margin = Sales – Cost of Sales
- Operating Expenses: Expenses in operating the business
- Operating Income = Gross Profit – Operating Expenses
- Other Income/Expense Net: Net of non-operating income/expense
- Net Income = Operating Income – Other Income/Expense Net
Note: Earnings per share will appear on the income statement if the corporation’s stock is publicly traded. We will skip that part as we are focused on small businesses which are not traded on the stock market.
Income Statement formulas
As we have seen above, there are three calculated indicators in the Income Statement. Their simple formulas are shown below.
- Gross Margin = Sales – Cost of Sales
- Operating Income = Gross Margin – Operating Expenses
- Net Income = Operating Income – Other Income/Expense Net
Income Statement Format
Though there is an overall structure with certain key elements that are standard as per accounting rules, each company may have slightly different formats,
As we scan through the three statements, a few things to note:
- Name of the statement may vary
- Microsoft calls it Income Statement, while Tesla and Apple call them Consolidated statements of Operations.
- Names of the sections or items may vary
- Microsoft and Tesla call Revenue or Revenues while Apple calls it Net Sales
- Microsoft and Tesla call Cost of Revenue while Apple calls it Cost of Sales
- Terms Profit and Income are used interchangeably. Sales and Revenue mean the same.
- Level of detail provided may vary
- Tesla has more detailed product/service break down compared to Microsoft and Apple. Microsoft, for example, in their Excel version of their statement provide product segment breakdown in a separate sheet. So, companies can provide details separately or within the income statement itself.
- Periods may vary
- Though these three statements are quarterly, companies may also provide annual statements as well. In the statements, typically prior period will be compared. If it is quarterly, comparison with previous quarter and if annual, comparison with previous year.
- Delivery Format may vary
- Microsoft seems to provide an Excel version of their income statements, but I didn’t see the same for Apple and Tesla. They do provide PDF and other formats.
Creating Microsoft’s Income Statement
Creating Microsoft’s income statement as a sample is very easy with our Free template.
Step 1: Define transaction categories and subcategories.
As we have seen earlier, each company may have different levels of details.
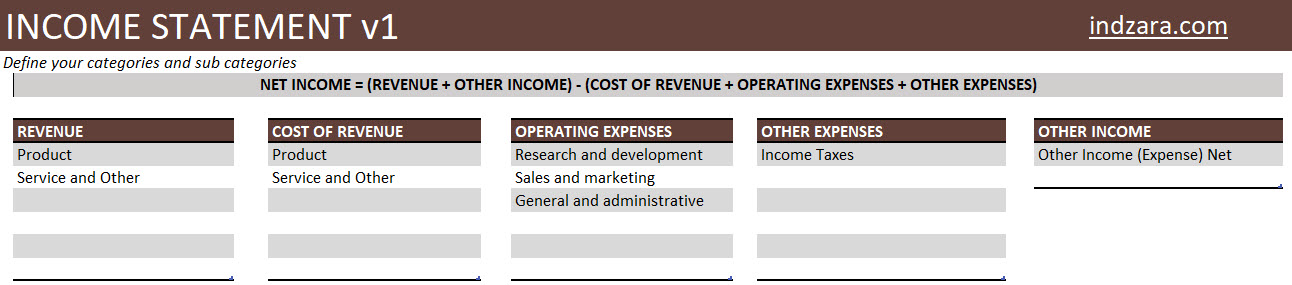
In the above screenshot, I have entered the 5 transaction categories (Revenue, Cost of Revenue, Operating Expenses, Other Expenses, Other income) and subcategories within each category. I have mirrored what Microsoft has used in their income statement.
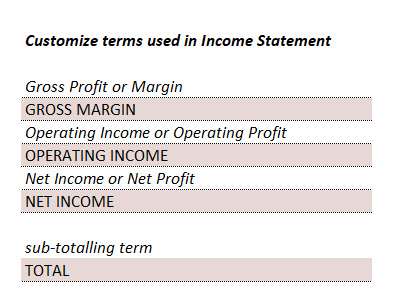
Step 2: (Optional) Customize the terms used.
We will mirror what Microsoft used in its income statement.
Step 3: Enter quarterly transactions
We have to enter the quarterly entries in the Transactions sheet.
Since the entries are once per quarter, I have entered the quarter beginning date as transaction date. You can enter any date during the quarter.
In the above screenshot, we show the last 2 quarters of entries.
I have entered 12 quarters (from July 1, 2018 to June 31, 2021) to demonstrate the output.
The Income statement is generated automatically.
Quarterly Income Statement
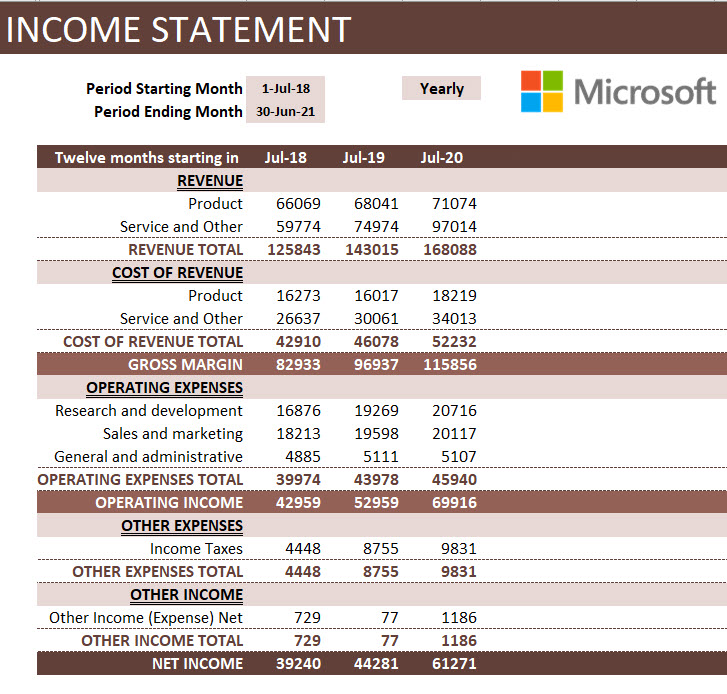
Yearly or Annual Income Statement
Creating Income Statement for your Business
Creating income statement in 4 simple steps
1. Define transaction types and categories that suit your business

In the above, you will see that I have provided some sample sub categories you can choose.
- Granular sub-categories
- WithRevenue and Cost of Revenue, I have included values such as refunds and credits. These are relevant if you would like to get that level of detail in your income statement. I prefer it because it allows more visibility for me as a business owner.
- When it comes to Operating expenses, I have provided more detailed sub-categories like Rent, Utilities, Software, etc. This again will allow me to see how these contribute to the overall profitability of my company.
2. Customize the terms (Optional)

- I would not change much here and will leave the terminology to default. If you are specific about something, please feel free to modify it.
3. Entering transactions
- I recommend entering more detailed transactions in this table.
- In Microsoft’s case they will have many millions of transactions happening and hence we had to aggregate it. For a small business, if we have thousands of transactions or even a few tens of thousands, we can actually enter them in here as they are.
- For example, in my own personal case, I enter all the orders I have received as individual lines or rows in this table. I could enter Order number in the optional Transactional Notes column for reference. This allows me to troubleshoot or analyze the data in a granular level that I may not be able to, if I enter only one row for all product revenue each quarter.
- For most businesses, the ideal case may be in between the Microsoft example of one row per quarter and my personal example of every single transaction. You could enter one row of Product Revenue for each month. One row of Service Revenue per month, etc.
- There are multiple ways to handle this and the template can handle those easily.
- Add more columns as needed to document information that is relevant
4. Customize Income Statement
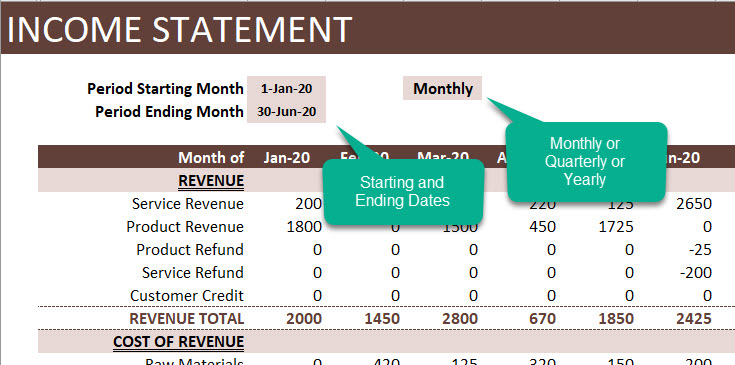
Enter the starting and ending dates.
Choose Monthly or Quarterly or Yearly.
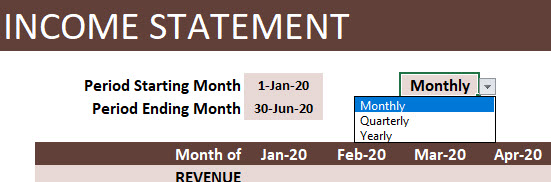
Note: If we didn’t enter Monthly transactions, then we have to choose Quarterly or Yearly. Depending on how often you enter data, the aggregations can be made.
Benefits
- All the calculations/math are done automatically
- Flexible (Monthly/Quarterly/Yearly)
- Dynamic – Number of sub categories
- Customize – Change the labels easily
- Enter raw transaction level data.
Downloads
Recommended Templates
For more small business templates, please visit Small Business Excel templates
Specifically, for automated income statements, bank balance tracking, cash flow report, tracking unpaid invoices and bills, please use the Small Business Finance manager (available for Excel and Google sheets).


References:
Financial Statements: A step-by-step Guide to Understanding and Creating Financial Reports – by Thomas R. Ittelson