

It is election season now, with results of 2019 Lok Sabha Elections in India to be announced in a few days on 23rd May 2019.
I wanted to develop a simple template in Excel that can allow us to view 2009 and 2014 Election results, and gain insights through simple data visualization techniques.
Download this free Excel template to view the results of 2009 and 2014 Lok Sabha Elections. You may also find data visualization techniques that you can apply to other topics or datasets. If you have any suggestions to make it better, please post them in Comments section below.

Features of Template
- Easily view 2009 and 2014 Lok Sabha results and compare 2014 vs 2009
- Visualize the data in 3 different aspects – Parliament View, State View and Constituency View
- Parliament View – 543 seats visualization by State, Party, Alliance & Win Margin %
- State View – Filter by state to see top parties and their vote share
- Constituency view – choose one constituency and see the top 5 candidates
Free Download
Video Demo

Parliament View
In the Parliament view, each cell represents a constituency and there are 543 constituencies. You can use 4 options available to you, to create a visual that specifically addresses a question.

First, let me explain the four options to control to visual.
1. DISPLAY: This determines what value is displayed on each cell.
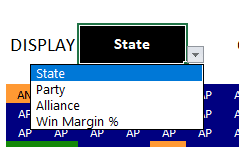
The four options within DISPLAY are
- STATE – State to which the constituency belongs
- PARTY – (Abbreviated) Name of Party that won that constituency in the election.
- ALLIANCE – Alliance (UPA or NDA or Others) that won that constituency in the election
- WIN MARGIN % – The Winning Margin % (difference between winner and runner up as a % of all votes polled in that constituency) in that constituency
2. COLOR: This determines what color is applied to each cell.
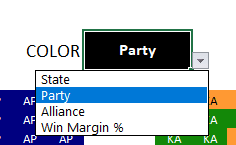
The four options are
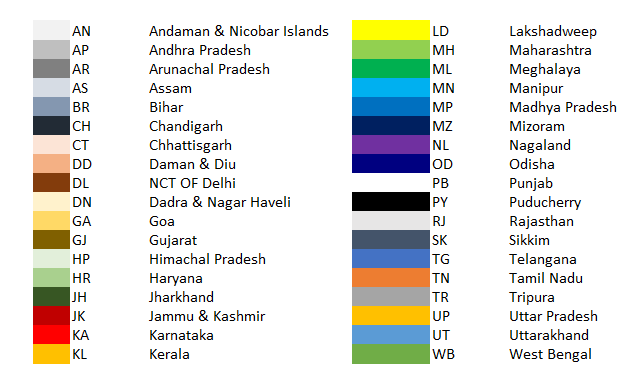
- STATE – State to which the constituency belongs. Each state and union territory is given a different color
- PARTY – (Abbreviated) Name of Party that won that constituency in the election. To simplify the visual, INC (Indian National Congress) and BJP (Bharatiya Janatha Party) are shown separate colors and all others are combined to one color.
- ALLIANCE – Alliance (UPA or NDA or Others) that won that constituency in the election. Each alliance is given a different color.

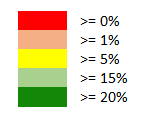
- WIN MARGIN % – The Winning Margin % (difference between winner and runner up as a % of all votes polled in that constituency) in that constituency. This is grouped into 5 categories. 1) 0 to 1% 2) >=1% and <5% 3) >=5% and <10% 4) >=10% and <20% 5) >=20%
3. SORT: This determines how the 543 constituencies are sorted and thus which constituency represents which cell. This helps in organizing or grouping constituencies together by State or Party or Alliance.
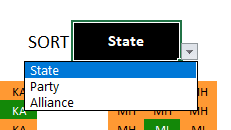
The three options are
- STATE – State to which the constituency belongs
- PARTY – (Abbreviated) Name of Party that won that constituency in the election. To simplify the visual, all parties except INC (Indian National Congress) and BJP (Bharatiya Janatha Party) are combined as one unit.
- ALLIANCE – Alliance (UPA or NDA or Others) that won that constituency in the election
4. YEAR: As the template has data for 2009 and 2014 elections, you can choose Year to view results of that specific year’s elections.
Using the above 4 choices, you can come up with many combinations to create different visuals. I will share a few common ones that I find interesting below. When you download the template, please feel free to change the filters to create your own visuals.
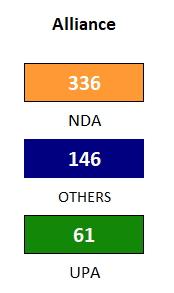
Lok Sabha Representation by Alliance
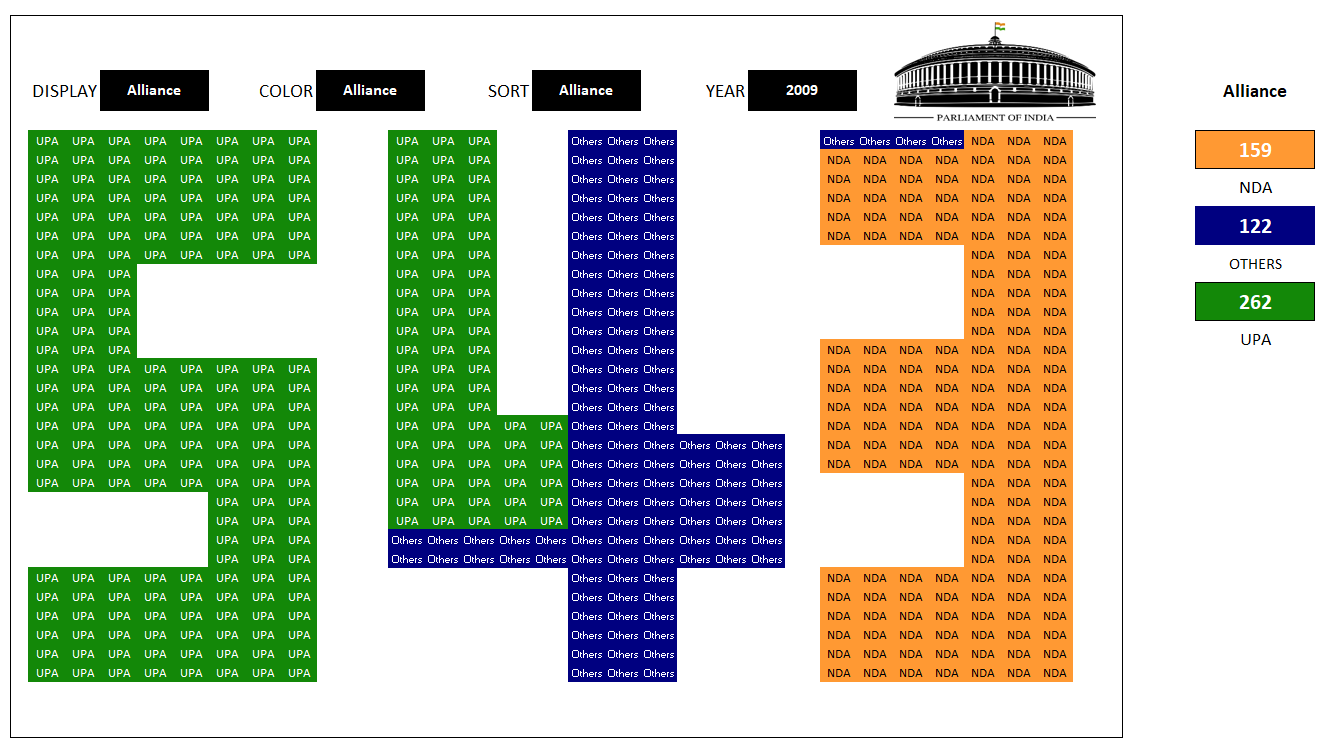
UPA had only 262 seats in 2009, not enough to win majority (272) needed to form government. But it had outside support from some of the ‘Others’ to get it cross over the majority mark.
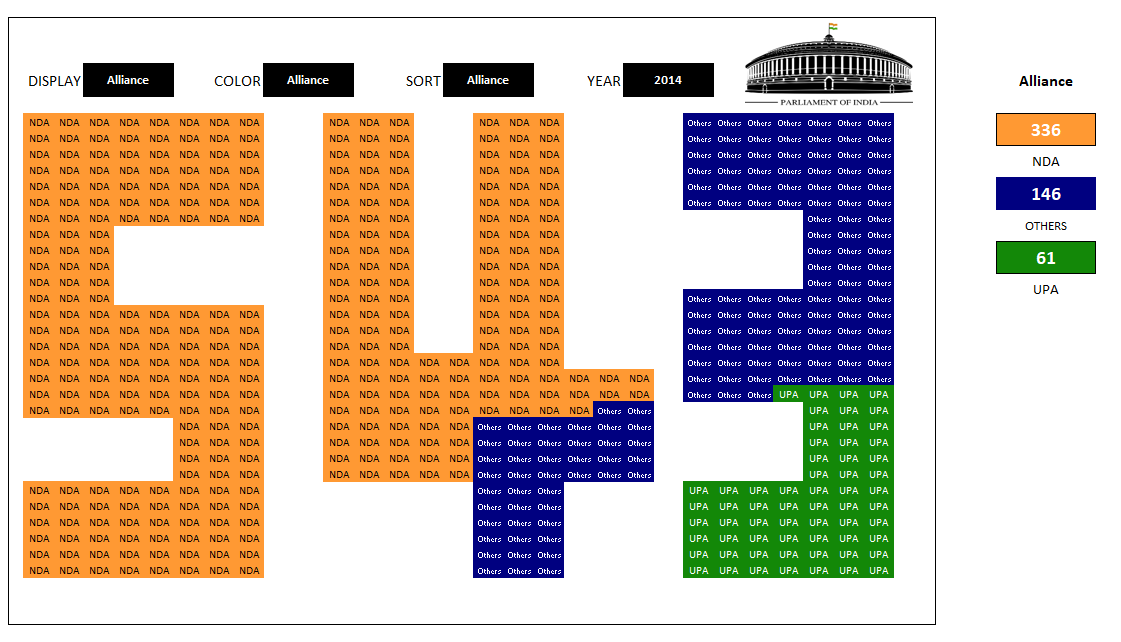
NDA had 336 seats in 2014 to clearly win majority (272) needed to form government.
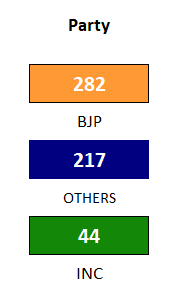
Lok Sabha Representation by Party

INC by itself did not have enough seats (206) in 2009 to win majority (272) needed to form government. But it had outside support from some of the ‘Others’ to get it cross over the majority mark.
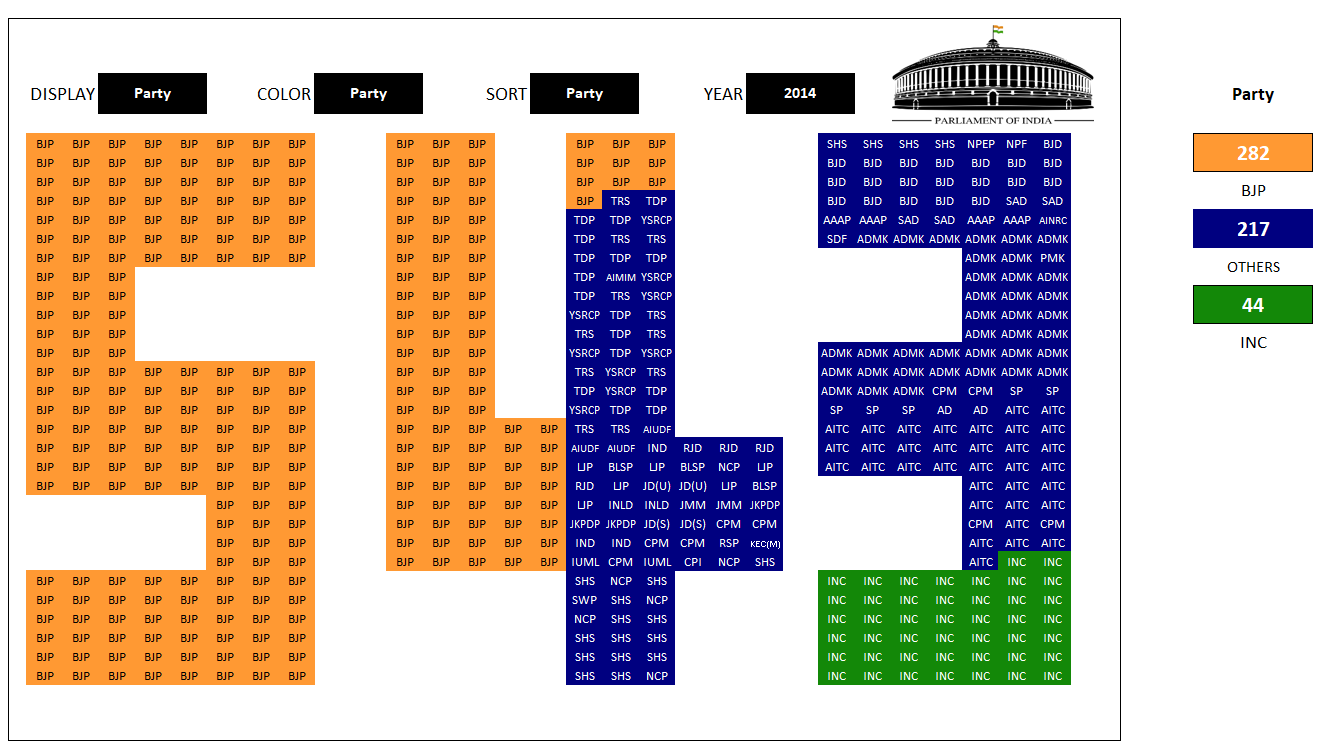
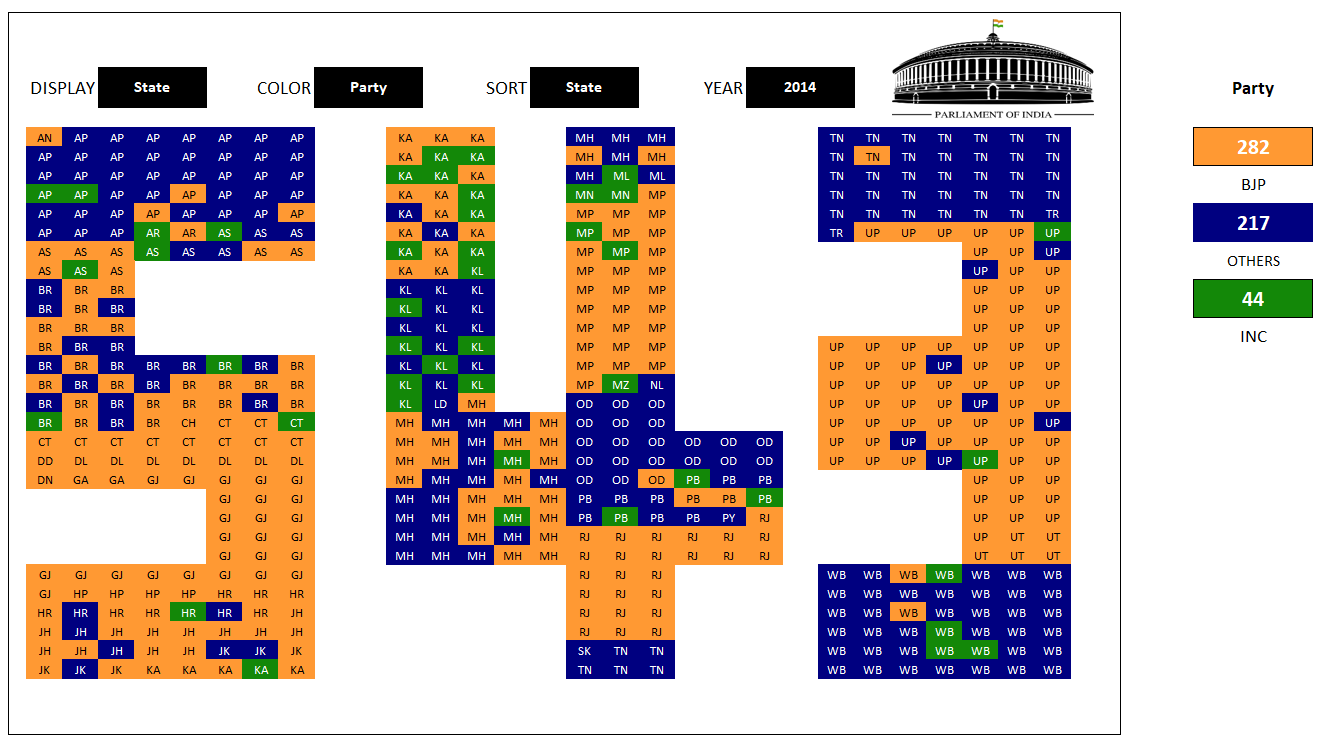
BJP by itself had enough seats (282) in 2014 to win majority (272) needed to form government.
Lok Sabha Representation by State/Union Territory
This view shows how many seats each State/Union Territory contributes to 543. UP is clearly the state that gets the most seats, while MH (48), AP (42), WB (42), BR (40), TN (39) are the next 5 states with a lot of seats.
Note: AP is split to AP and TG (Telangana) from 2019 Lok Sabha elections.


Top Parties in State/Union Territory

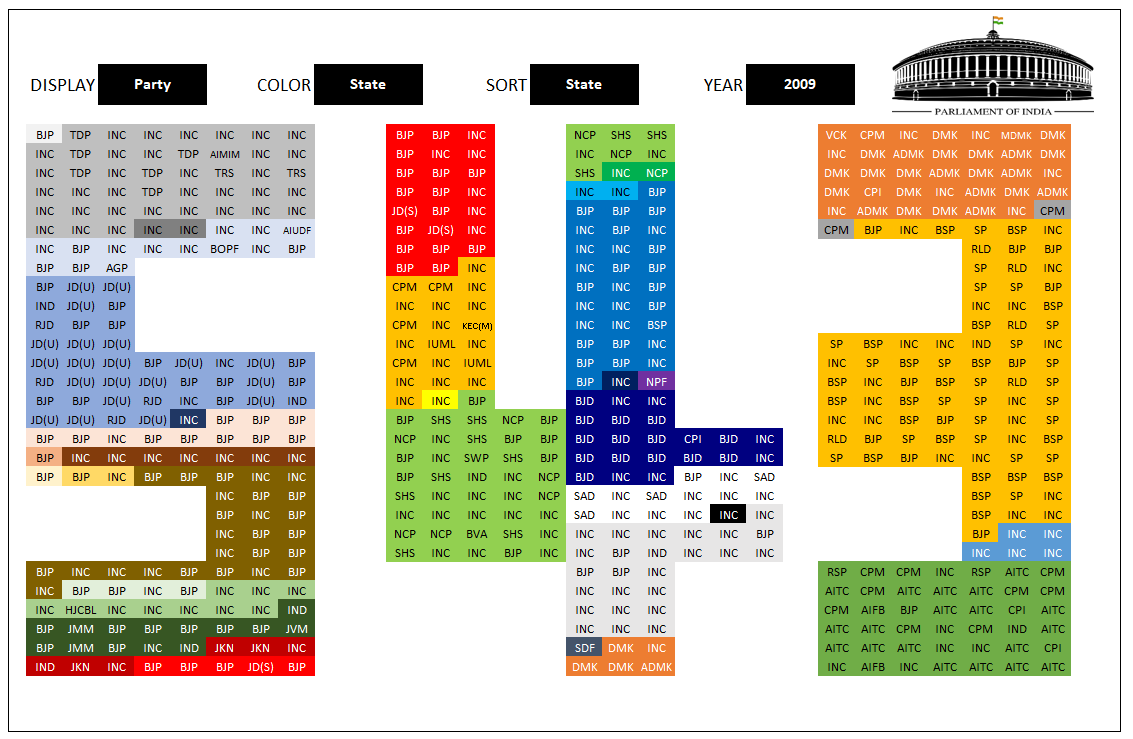
In 2009, INC was strong in AP, RJ, HR, DL and KL. It also had good representation in MP, MH, GJ and UT.
BJP almost swept UP in 2014. It also had good representation in MP, RJ, GJ, DL, JH, HR and UT.
Top Parties in State/Union Territory
This is related to the previous set of views. But here, we are displaying Party name and hence can see other parties that won.


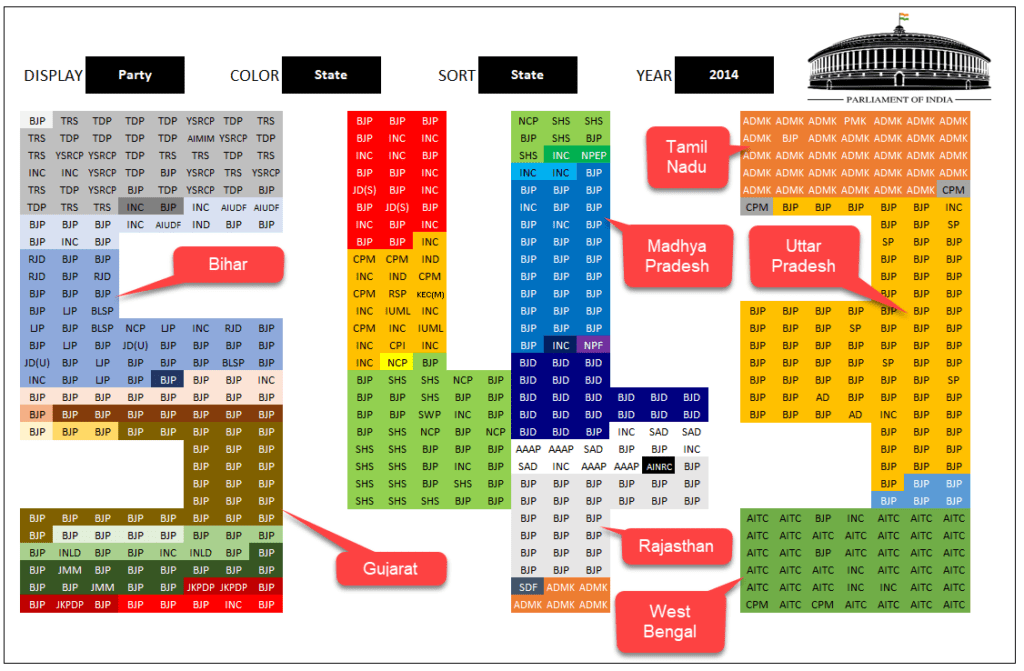
BJP almost swept Uttar Pradesh, Madhya Pradesh, Gujarat and Rajasthan. Among other parties, AITC in West Bengal and ADMK in Tamil Nadu had big wins as well.
Win Margin % by Alliance
The next two views show the Win Margin % by each alliance in 2009 (first image) and 2014 (second image).
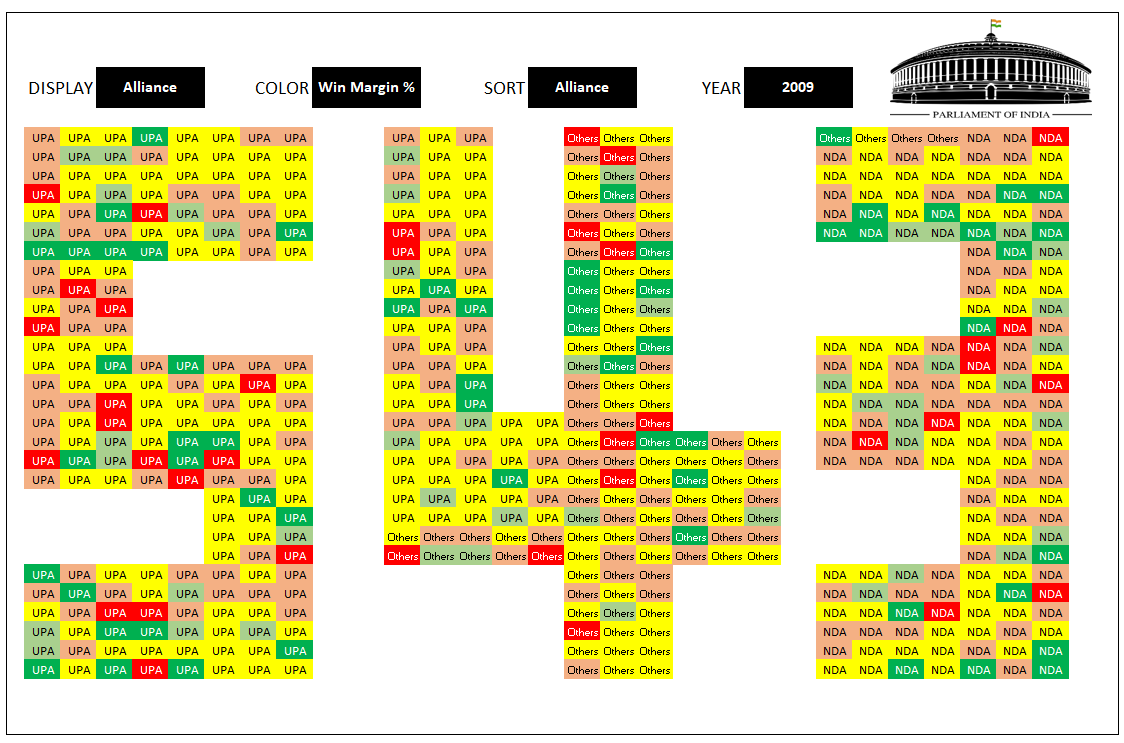
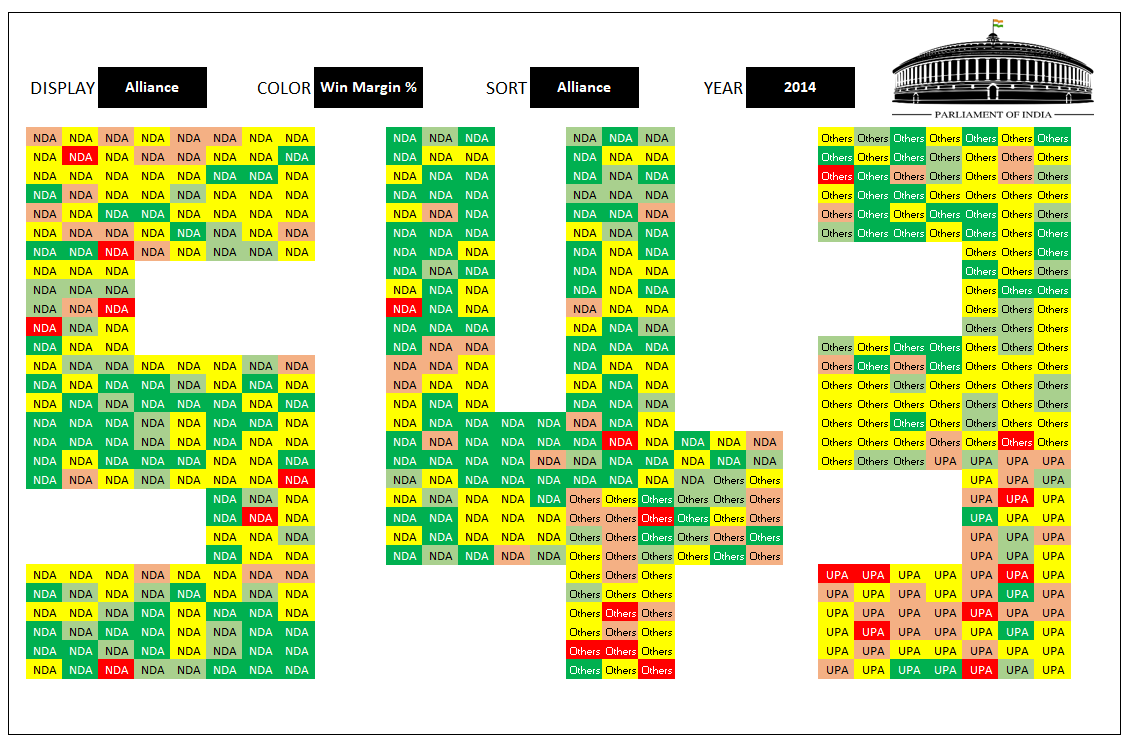


You can see that the 2014 NDA has a lot more green (Dark Green is >=20% win margin) than the UPA in 2009. This indicates that NDA in 2014 had a clearer mandate from the people with a much bigger win margin in each constituency it won.
State View
State view is much simpler to explain. You can view the top parties and their performance either for all states or for chosen states. You can use the filter on the left to choose states.
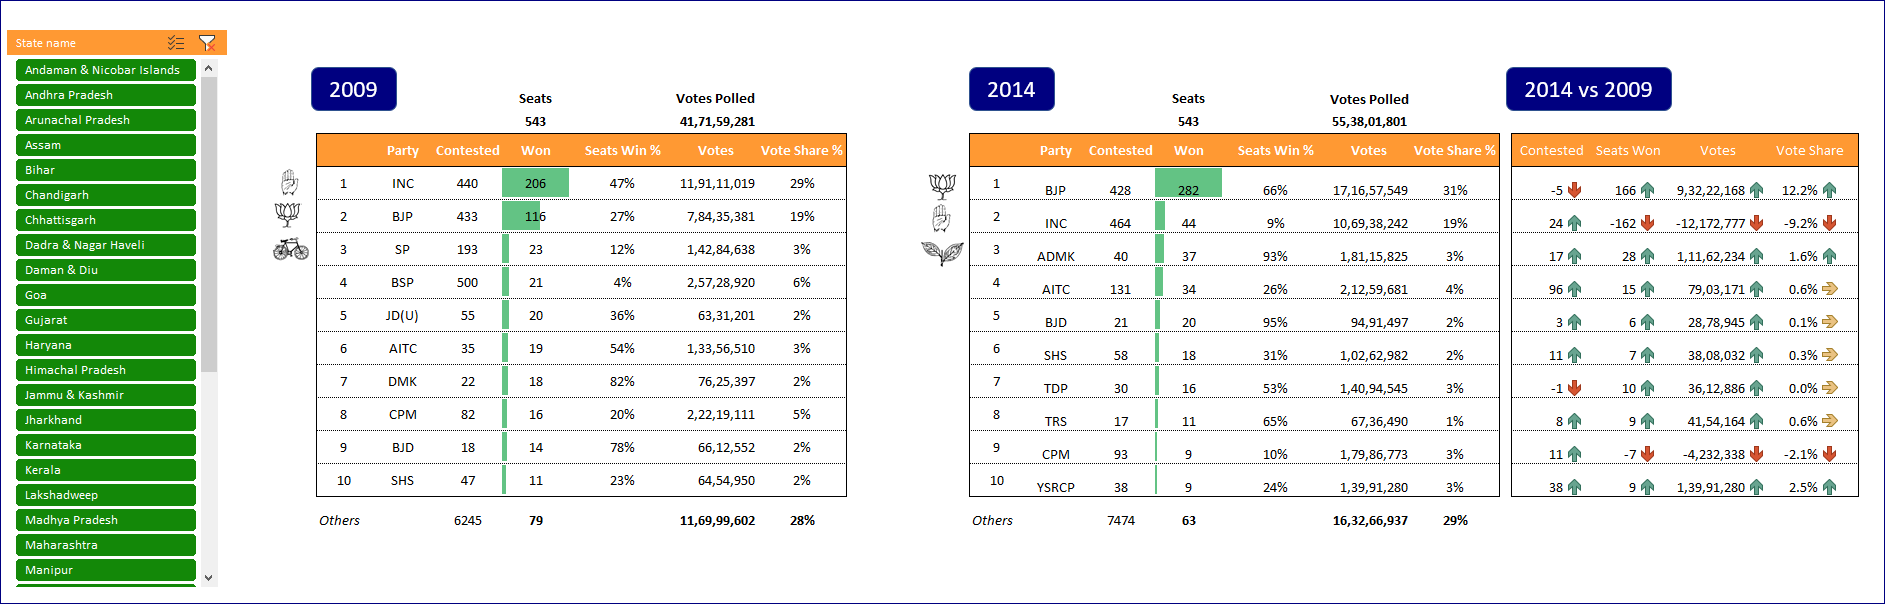
The view shows 2009 results, 2014 results and compares 2014 vs 2009. Let’s consider 2009 results first.
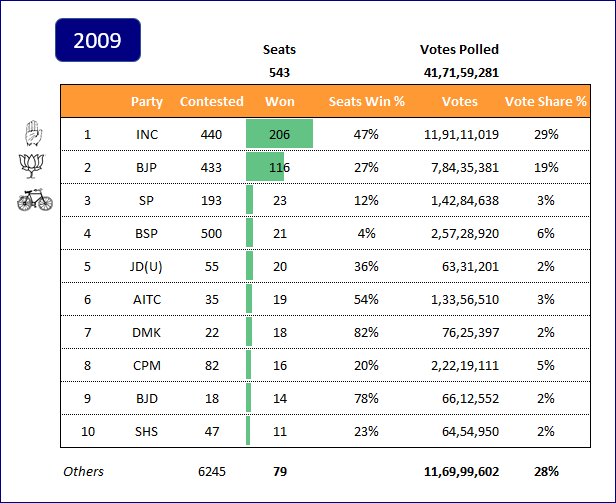
You can see Parties sorted by Seats Won and when there is a tie, they are sorted by Votes Polled.
For example, in 2009, INC had 206 seats won, that is 47% of 440 seats it contested. It received 11,91,11,019 votes that is 29% of all votes polled in 2009.
Calculations
- Seats Win % = Seats Won by Party / Seats Contested
- Vote Share % = Votes Received by Party / Total Votes Polled in all Seats
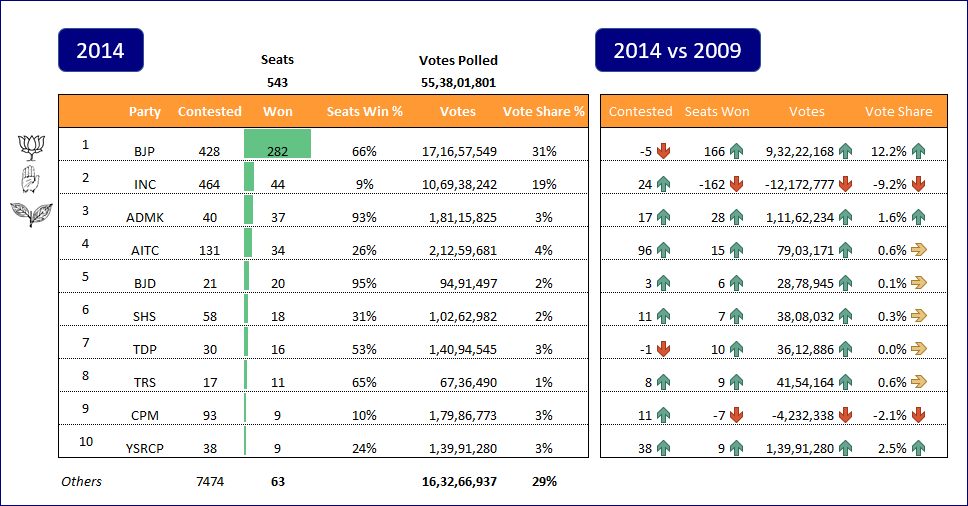
You can see the same metrics for 2014. In addition, you can see the change in 2014 compared to 2009.
For example, BJP won 282 seats out of 428 it contested (at 66%). It had a vote share of 31% of all votes in entire country. It had 166 more seats in 2014 compared to 2009. It increased its votes by 9,32,22,168 and 12.2% increase in Vote share% (31% in 2014 compared to 19% in 2009).
As mentioned earlier, you can view this information for one or multiple states. Let me show one example of that. If I filter on Tamil Nadu as State, this is what I will get.
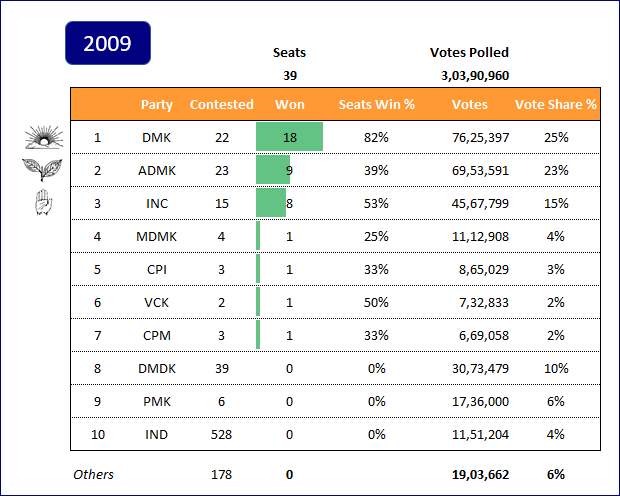
DMK had 18 seats, ADMK 9 and INC 8 in 2009.
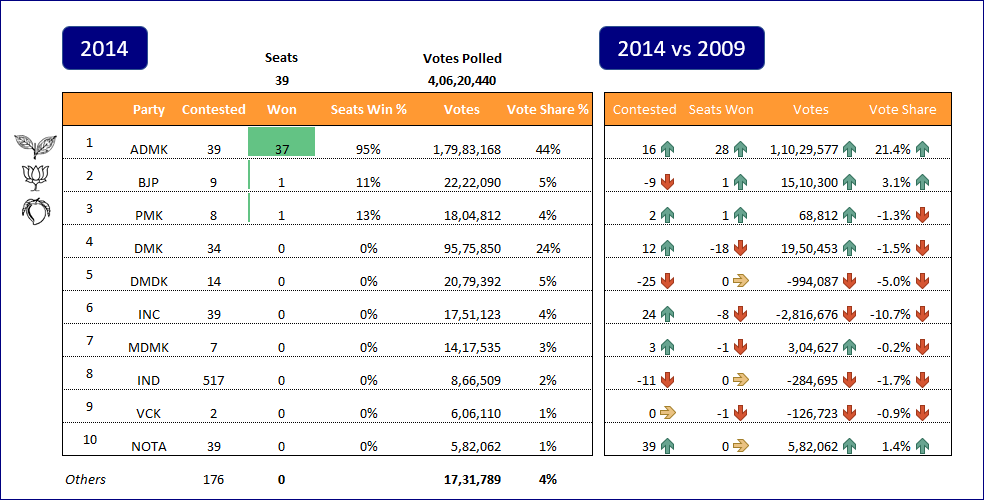
In 2014, It was almost a sweep where ADMK had 37 seats. BJP and PMK won 1 each. ADMK increased vote share by 21.4% gaining mostly from INC and DMDK.
NOTA (None of the Above) option was introduced in 2014 and made it to top 10 parties’ list.
Constituency View
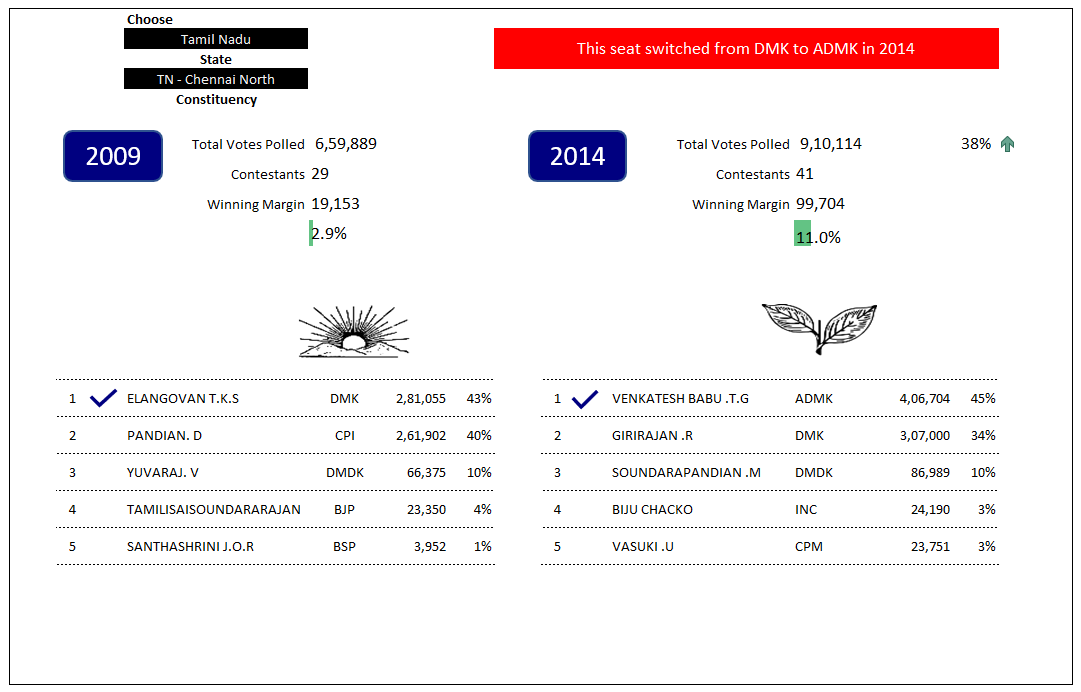
In this view, you can choose a specific constituency and view the top 5 candidates in 2009 and in 2014.
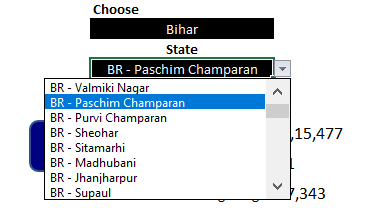
First, choose the State which will narrow down the Constituency drop down.
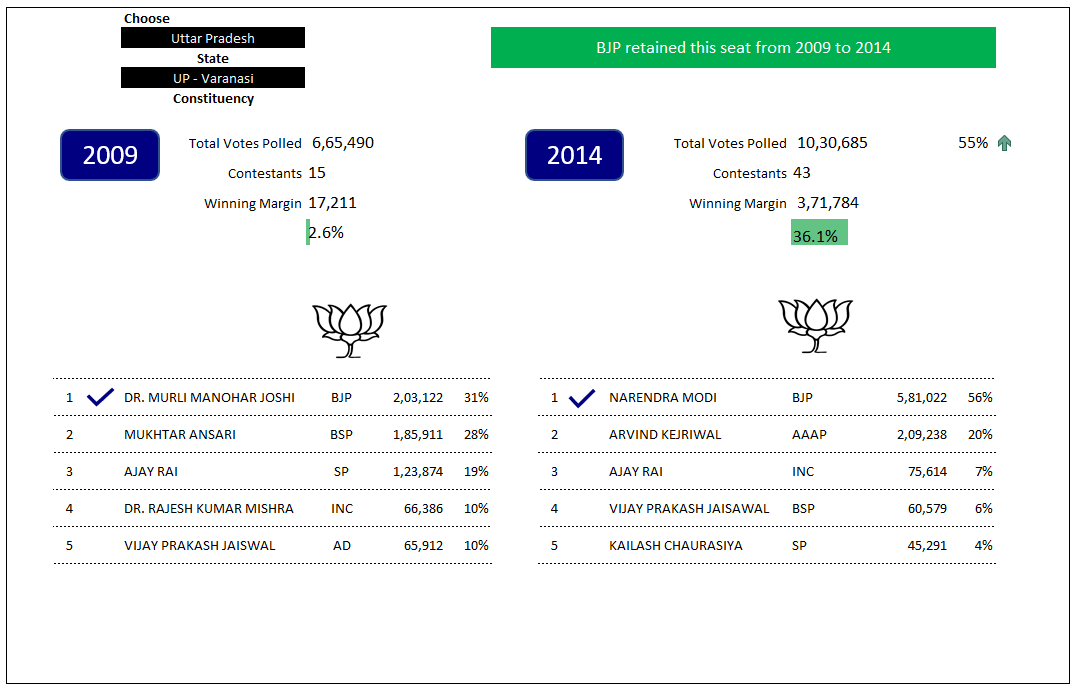
Then, you can view the details of that specific constituency. An example is shown below with call-outs of information presented.

- You can see the votes polled, number of contestants (including NOTA in 2014) and winning margin as votes and %.
- If the win is a close win (<1%), it will be highlighted.
- In 2014 section, you can see the same metrics but also the increase (%) in votes polled.
- The winning parties’ symbol is shown if available.
- Message at top right indicating if the seat was retained by same party in 2014 or it switched from one party in 2009 to another in 2014.
Let me share screenshots of some constituencies.
The most famous constituency from 2014 – Varanasi in UP.
An example seat that switched from one party to another in 2014.
One of the closest wins with 36 votes making the difference – in Ladakh in 2014.

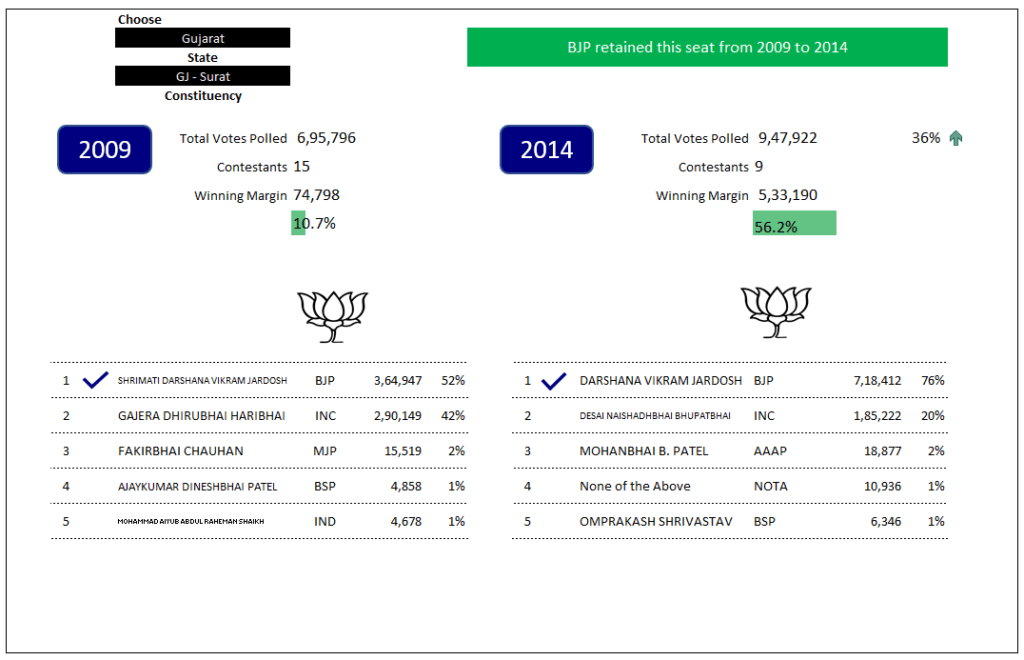
One of the most comfortable wins – Surat in 2014 – Winning Margin was 5.3 lakh votes (56.2%).

About Elections Data
Elections data could be considered as an ideal dataset for visualizations and analysis in Excel, as they are usually smaller in size. However, what makes it challenging, especially Indian elections data, is the quality of data available.
New states are created, constituencies are re-organized and renamed, new parties are formed, new alliances are created every time, and so on. They make it hard to expand the scope of analysis to more than 1 or 2 election years. Candidate names and Party Names are not entered in a consistent way. That makes historical analysis by candidate and party almost impossible, unless you spend significant time in improving data quality.
Source
I have tried my best to source data from official Indian election commission website and where needed, I leveraged Wikipedia. If you find any inaccuracies in the template, please post in comments below and and I will be glad to correct. My goal is to make such public data available in usable formats to all.
Elections and Me
Since my school days (a long time ago ), I have always been fascinated with elections. I never followed any political news for 5 years (which is the term of a government in India), but still sat in front of TV on the counting day to watch the results live. I used to view it as a race or a live sporting event where results come in every minute and the winner can change. The excitement lasted only for a few hours as the winner will be usually clear after that. I never bothered to follow politics after that day until the next counting day came up 5 years later.
As I grew up, my views on politics and elections have changed for the better (at least that’s what I think). I do follow everyday politics day and understand the nuances slightly better now. Though I get disgusted at the current state of political activities, it’s hard for me to stay away from it.
If you find this template useful, please share with your friends. Please provide your feedback in the comments section below. I look forward to hearing from you.