Data analysts use data to discover answers to questions and then communicate the findings to the audience effectively so that the message reaches the audience clearly, correctly and quickly, leading to actions that improve outcomes.
Motion Charts or Animated Charts allow us to express the data in ways that a static chart does not.
A motion chart allows us to show the direction and the speed of the change in variables.
Download
Video Demo

How to create motion bubble charts?
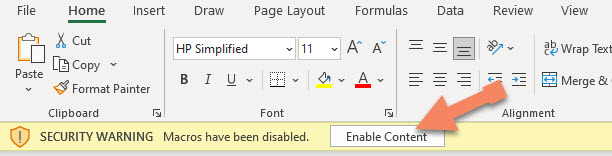
Enable macros
When you download the template and open, you may see this warning message. The template uses three simple macros (which are provided later in this article below) to animate the chart. Please click on ‘Enable Content’ to continue.
Define Variable names
In the Start sheet, rename the three variables as needed.

X axis variable will be the independent variable and Y axis variable is the dependent variable. Size variable represents the size of the bubble.
Enter Raw data
Raw data for three variables are entered in the three sheets X, Y and Size.
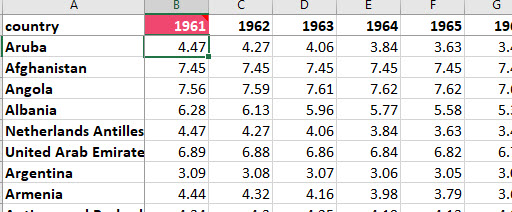
For each of the three sheets, column A represents the observation names. In this example, since each data point is a country, we enter country names here.
Column B to BI are the years (60 columns mx). You can enter fewer years if you need.
When copy pasting from other sources into this sheet, please make sure that you paste as values.
Please do not delete or insert columns in these sheets.
The order of the countries in the three sheets do not have to be the same. However, the spellings need to match.
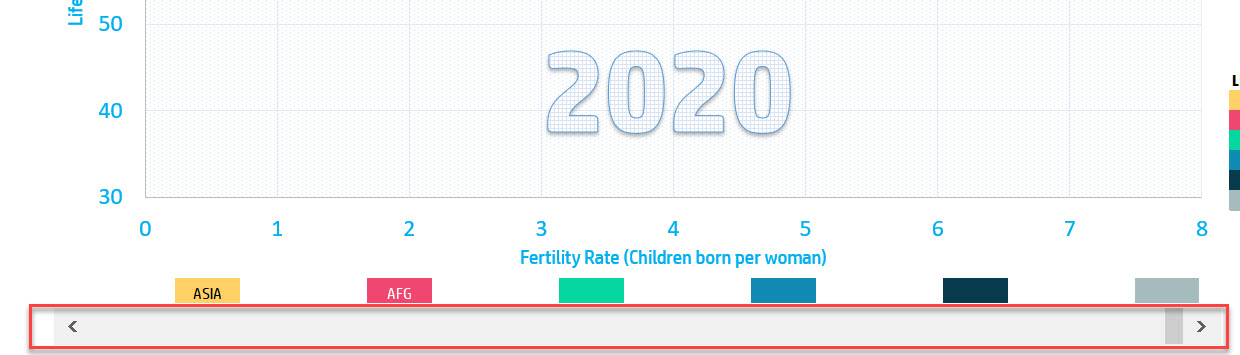
Enter Series data
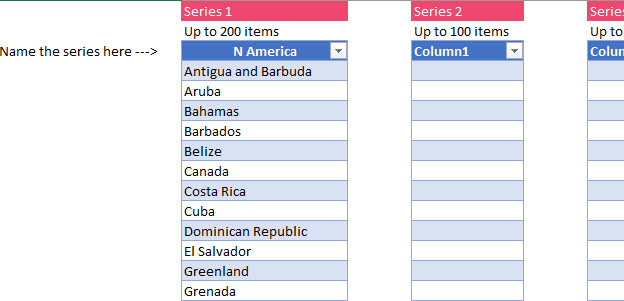
The template supports single series and multi-series bubble charts and scatter plots. You can enter up to 6 series of data.
Name each series as needed and enter the values in each series. These names should be present in the the X. Y and Size sheets.
This type of design allows us to explore the data by just modifying the series without touching the raw data in those three sheets.
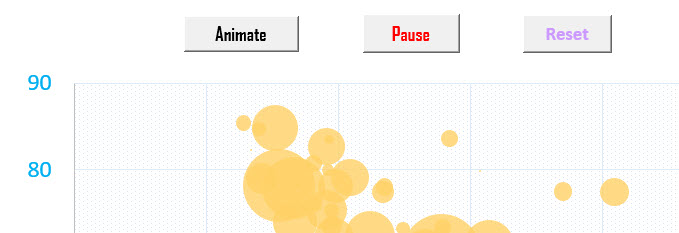
Chart Sheet controls
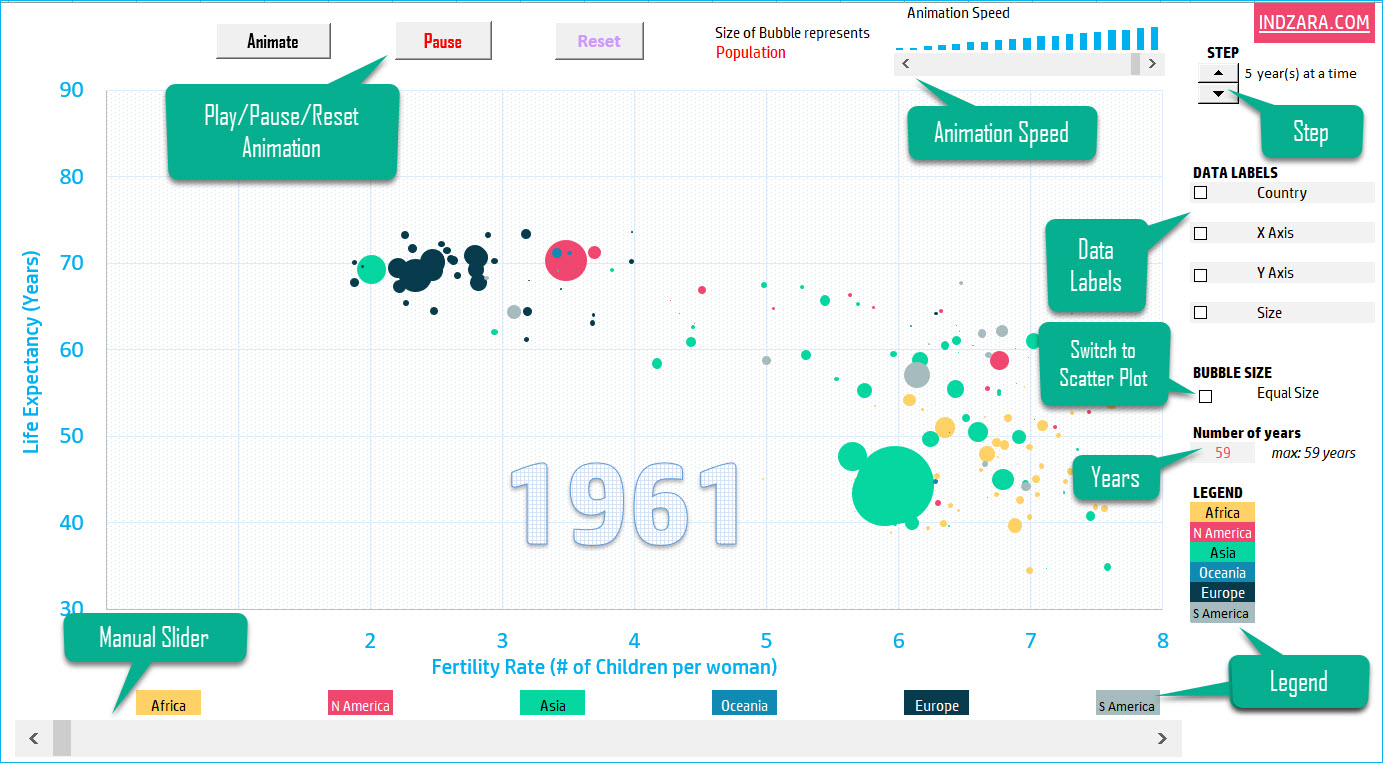
Play, pause or reset animation with buttons
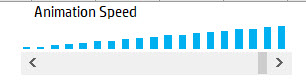
Control animation speed
Control motion manually with slider
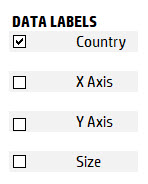
Control Data Labels (X, Y, Size and Name)
Step through motion
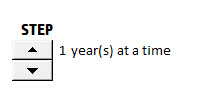
If you would like the chart to animate 1 year at a time, or multiple, you can set it up here.
Switch to Scatter Plot
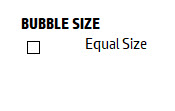
You can switch between a scatter plot and a bubble chart with a single click. When equal size is chosen, the chart becomes a scatter plot with all the bubbles equal size.
Formatting tips
Please watch this video on how to create a bubble chart and change formatting options in Excel.
Recommended Templates: