
If you are looking for a project management tool or software that can make project planning simpler, you have come to the right place. In this post, you will learn about a simple project planning framework and how to plan your projects smartly. You can download the free Project Plan template and start planning your projects immediately in Excel.
This post is written such that even if you are new to project planning, you will be able to quickly get started. By the end of this post, you will learn how to do the following using the template
- To know when your projects will complete and if projects will complete by due dates (deadlines).
- To understand resource utilization and identify opportunities for re-assignment to improve project completions.
- To determine any shortage of resources, so that you can request additional resources.
- To communicate to project stakeholders the readily printable project plan report, project timeline, project schedule (Gantt chart) and resource schedule.
Video Demo
What is Project Planning?
As a Project Manager, one of the key responsibilities is to plan the project before beginning the actual project work. This project planning is very crucial in the success of the project. For example, if our project is to build a home, then we want to have a clear project plan as to how we will build before we start building.
Outcome of Project Plan
Let’s assume you are the project manager and you are responsible for planning multiple projects at the same time. The outcome of the planning stage should address the following questions:
- When will all my projects complete? Will they complete by the target deadlines?
- How much will each project cost?
- How efficiently have I used the resources on project? (Utilization Rate)
- How can I communicate to my team so that they know which work needs to be done when?
If the answers to the above questions are not satisfactory, we will have more questions. We will address that later in this post.
Now, why is not easy to answer these questions? The foundation to answering these questions is to build the project schedule (who is going to work on which task for how long).
Project Schedule
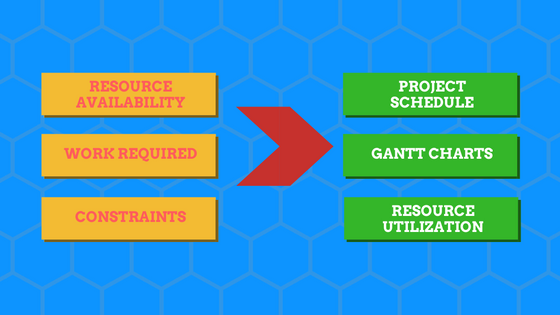
To build project schedule, we need to consider a variety of factors
- Resources
- List of resources on the project
- Available number of hours each day for each resource
- Company holidays where work will not be done
- Tasks/Work
- Number of hours of work needed for each task
- Any restrictions on Start Date (a task cannot start until you receive the machine needed)
- Dependencies between tasks (a task can begin only after another is completed)
- Resource-Task skill matching
a. Assigning which resource should work on which task
Based on all the above input, we need to build the project plan schedule. This can get easily out of control if we do it manually. This is where we need the help of computers and software to build the schedule for us. Popular tools like Microsoft Project can do this. Now, you can also do it with a free project management tool.
Automatic Scheduling Engine
The template takes the above-mentioned inputs and automatically builds a project schedule. It lays out how we will complete the work needed for the project using the resources available. It clearly states who will be working on what task for how long on a given day.
It takes care of all the computations needed and saves us a ton of time and effort. For more, please read How does Automatic Scheduling Engine work.
Output of Project Planning template
The template provides the
- Plan summary which details the key dates (start, end) for each project and its status
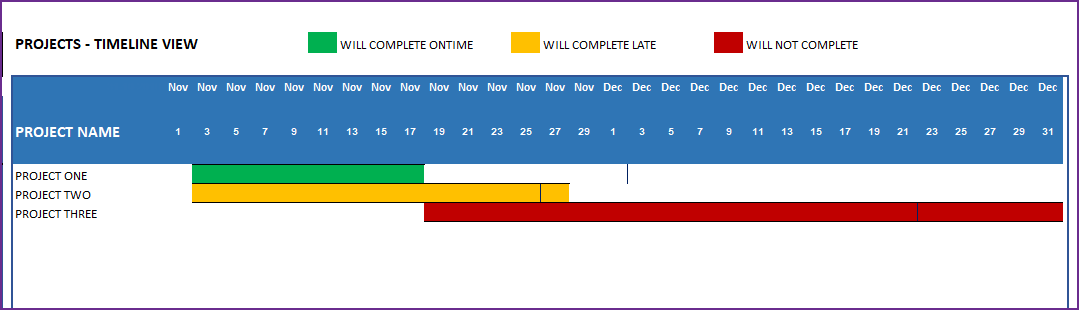
- Visual Timeline view of projects
- Resource Summary with utilization rates
- Task schedule (Gantt Charts) for a project, a resource or all tasks
- Resource availability and scheduled work by day
What if you are not happy with the project plan?
It may take a few iterations to land on a schedule that is acceptable. For example, in the first iteration, it might take really long to complete the project, in the next iteration it may cost a lot.
The levers a Project Manager has are
- List of Resources
- You can add or remove resources in the Project
- Availability of those resources (standard hours, vacation)
- You can change the available number of hours from each resource on the project
- Assignment of resource to task
- You can change the resource assigned to a task if possible
- Scope of Task(s)
- Sometimes, you can change the scope of a task and thus reduce the work needed
Once we land on an acceptable schedule, the Project Manager finds the answers to the original questions and shares in a project report with the Project sponsors to get approval. Once approved, what we have is a project plan. This will include key dates (milestones), the detailed schedule, cost estimates and resource utilization rates.
Project planner Excel Template
Benefits of project planner
- Have Control over Project and Task dates
- Project Start Dates can be restricted (optional) by providing preferred start date
- Task Start Dates can be restricted (optional) by providing preferred start date
- Preferred Project End Dates (aka Project due dates) can be given to compute if projects complete on time (optional)
- Preferred Task End Dates can be given to compute if tasks complete on time (optional)
- Control the order of Projects and Tasks by assigning priorities
- Projects need to be prioritized and prioritization is followed when resources are assigned
- Tasks can be prioritized and prioritization is followed when resources are assigned
- Each task can have up to two predecessors (dependencies). They can be within project or from other projects. A task can begin only the day after its predecessors have completed.
- Customize Capacity or Resource availability
- Customize Weekends
- Can handle any number of company holidays
- Hours available to work per day (for the duration of the planning period) is customizable for each resource.
- Notes
- Each task is assigned to one and only one resource. A project can have multiple tasks and hence multiple resources.
- Resource can be assigned to multiple tasks on the same day.
- Planning is done at the granular unit of hours
- Assign some tasks as milestones if needed
Free Downloads
How to plan projects in Excel?
Overview of steps
- [Data Entry] – Enter basic settings such as planning period, resources’ availability and company holidays
- [Data Entry] – Enter Project list
- [Data Entry] – Enter tasks, assigned resources and duration of work
- [Automated] – View Project plan summary, timeline view and resource summary report
- [Automated] – View Gantt Charts – Schedule for all tasks, one project or a resource
- [Automated] – View Resource Availability and Scheduled hours
Detailed Steps
The template has the following sheets: Home, Settings, Projects, Tasks, Plan Summary, Task Schedules, Resource View and Help.
If you are new to using Excel templates, please read this article on 3 tips before using Excel templates.
If you are not familiar with data entry in Excel tables, please read Introduction to data entry with Excel Tables.
Step 1. Enter basic settings
We begin by first selecting the planning period in the Settings sheet.
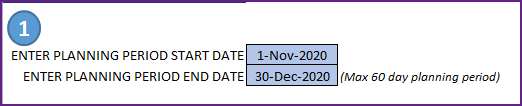
For example, I have entered the Nov 1, 2016 as the Planning Period Start Date and Dec 30, 2016 as the End date. The template can handle 60 days of planning period.
Next, we enter the list of resources (or employees) that are available to work on our projects.
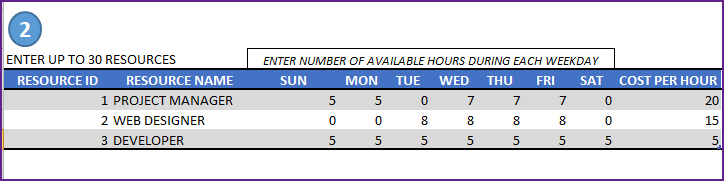
- We enter an ID for each Resource and the name.
- We then enter the available hours for each weekday for each resource. The template allows each resource to have varying work hours.
- We also enter the cost per hour for each resource. This input allows us to calculate the cost of the projects later.
Then, we choose which days are weekends in our organization.
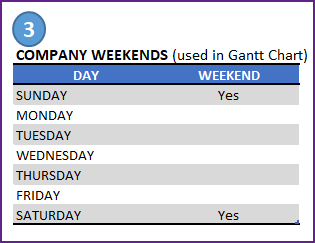
As we have already entered availability for each resource separately, company weekends don’t provide any additional input to availability calculations. But this is used to display company weekends in the Gantt charts (which we will discuss later in this post).
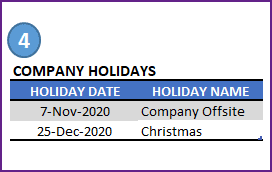
Finally in the Settings sheet, we enter Company Holidays.
Step 2: Entering Project Data
Now that we are done with entering resource availability data, we move to the Project information. Let’s enter a list of our Projects.
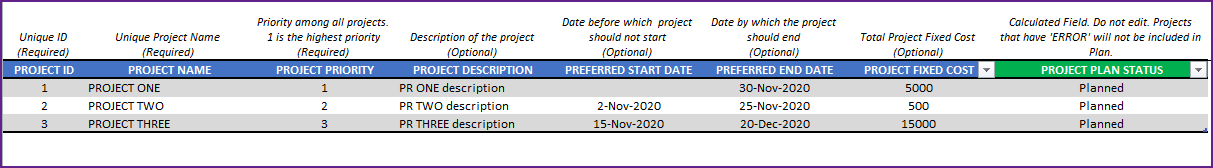
- Project ID and Project Name are required fields. They should be unique. Duplicate project IDs or Project Names will cause errors.
- Project Priority is another required piece of information. This enables the template to schedule tasks in the order of priority. Priority of 1 indicates the highest priority project and Priority of 2 is the next important one.
- Project Description is for your reference.
- Preferred Start Date: If you would like the project to not start before a certain date, enter that date. The scheduling engine will not schedule any work for this project before this date.
- Preferred End date: If there is a deadline or due date for a project, you can enter that here. The template will indicate if the project cannot be completed by this date.
- Project Fixed Cost: The template can calculate resource cost separately. If there are other project costs, you can enter that amount here. Later, we will see that the template will add the fixed cost and the resource cost together as the total cost.
- Project Plan Status: Please do not edit the field as it is calculated with a formula. If the project is missing any key piece of information, then the status will be ‘Error’. If there are no errors in data entry, the status will say ‘Planned’
Step 3: Entering Task Data
The last part of data entry is the task level detail. We would enter each task in all our projects. Let’s look at required input fields first.
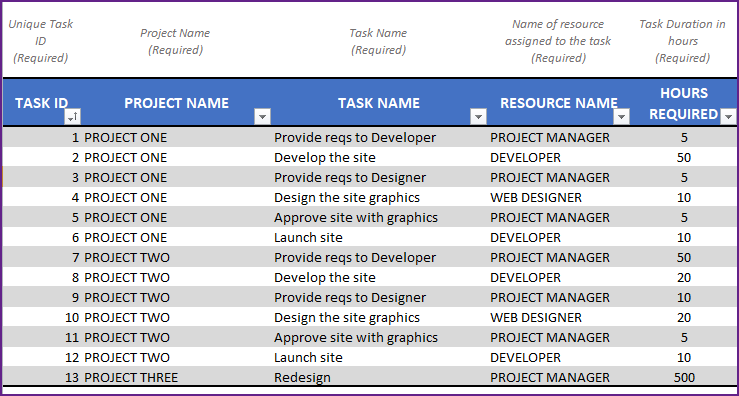
- Task ID should be unique
- Enter Project Name and the Task Name
- Enter Resource assigned to the task
- Enter planned duration of the task in Hours Required
There are optional fields that are available to handle additional scenarios that you may face in project management.
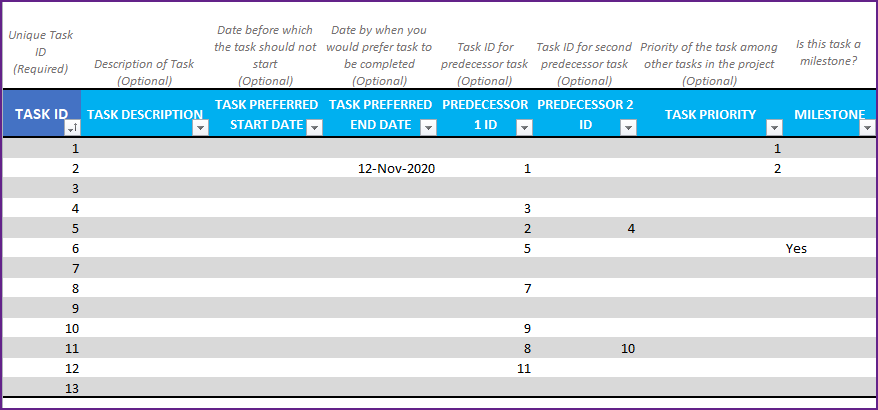
- Task Preferred Start Date: Just like we entered a Project Preferred Start Date in the Projects sheet, we can enter a preferred start date for tasks. The template will then make sure that no work for that task will be scheduled before that preferred start date. This is another way you have all the control on the project schedule.
- Task Preferred End Date: Similar to Project Preferred End Date, if we have a due date for a specific task, enter that here. The template will then compare the expected end date with this preferred end date and tell us if the task will complete on time or not.
- Predecessors: In most practical scenarios, tasks have dependencies between them. For example, in the image above, Task ID 2 has Task ID 1 as predecessor. This means Task #2 cannot begin before Task 1 is complete. Similarly Task ID 4 cannot begin until Task ID 3 is complete.
- The template supports up to 2 predecessors per task. For example, Task ID 5 will not begin until both Task ID 2 and Task ID 4 are completed. This can get very complex for planning, but the template has calculations built-in to take care of this. So, we don’t have to worry about it. 🙂
- If we don’t pay attention to setting predecessors correctly, we may end up with circular reference errors. How to avoid circular reference errors?
- Note: In this template, the dependent tasks can begin only the day after the predecessors complete.
- Task Priority: Just like we control the order of priority of projects, we can control the order of tasks within each project. Just enter the priority number. 1 is highest priority. This informs the template that higher priority tasks should be taken first. For example, if a resource is assigned to 2 tasks (one if priority 1 and second is priority 2), the template will schedule such that first task is completed before the resource moves to work on second task.
- Milestone: Certain tasks can be labelled as milestones and they are highlighted in the Gantt Chart. Just enter ‘Yes’ for those tasks in the MILESTONE field.
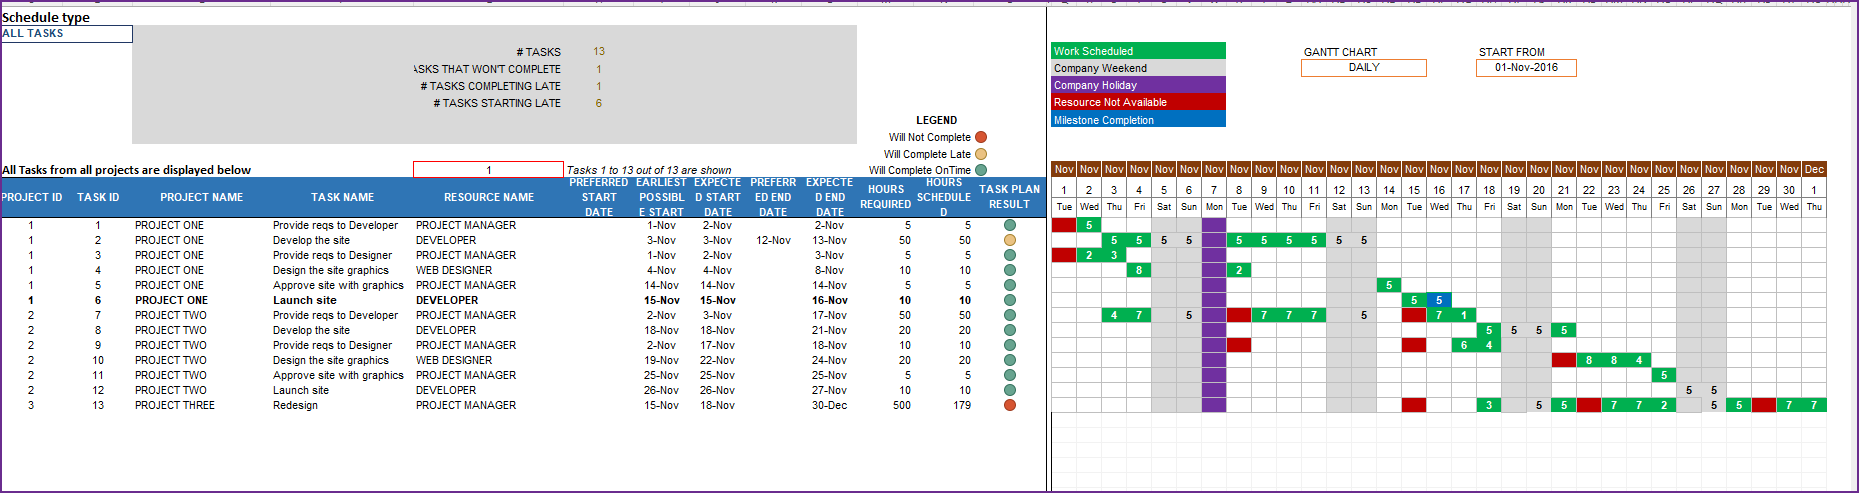
Now, let’s discuss the very important Task Plan Result field.
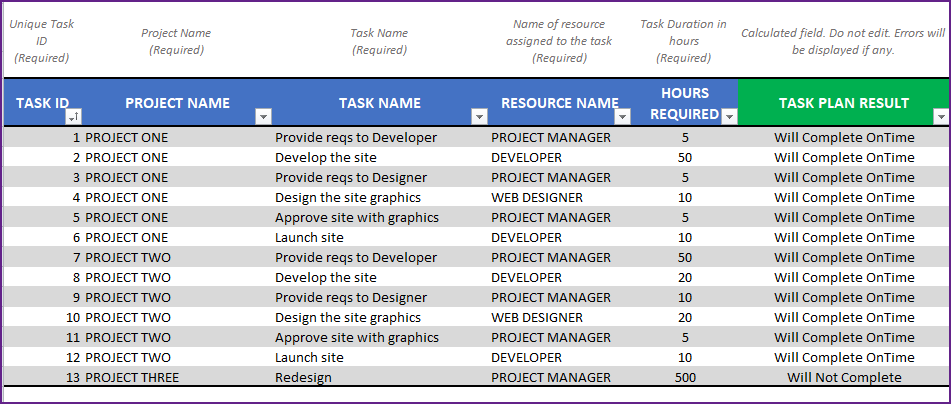
Task Plan Result is a calculated field that will instantly inform whether the task will complete on time, complete late or not complete at all within the planning period. If there is any missing data input, it will also show an error.
This instant feedback is great for a project planner as you can change the resource assignment to see if the task will complete then.
Once we enter all the tasks we are done with our data entry. In the image above, I have entered 13 tasks for 3 projects in total. 1 task (task ID 2) seems to be completing late (Expected End date > Preferred End Date). Task ID 13 will not complete at all within the planning period (by Dec 30, 2016).
Step 4: Viewing Project Plan Summary
The Plan summary sheet is all automated. It has 3 sections (Projects’ Summary, Timeline view and Resource Summary).
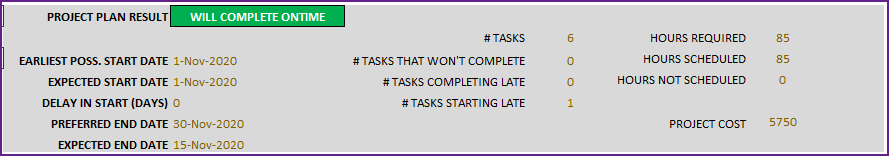
Projects’ Summary
Each project’s plan details are shown.
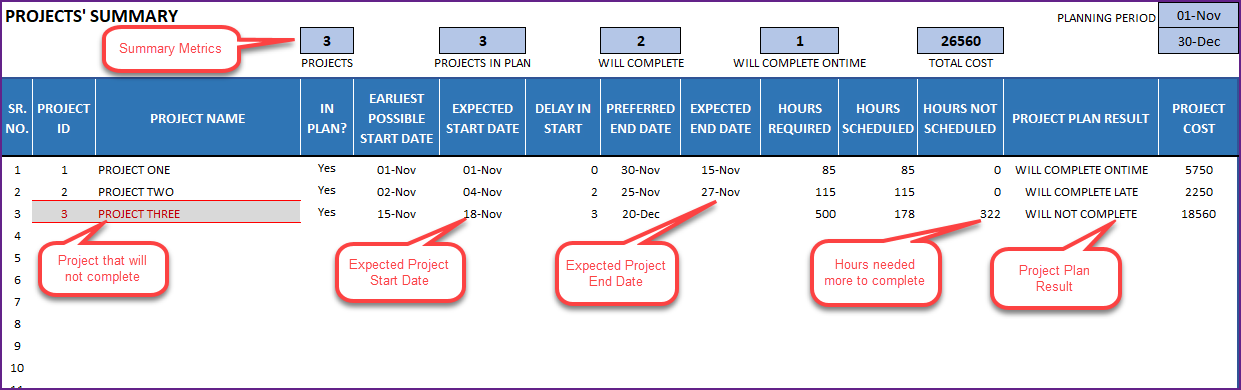
Dates when the project is expected to start and end are clearly shown.
You can just export to PDF and share the summary with your stakeholders.
Project Timeline view
We can also see the project timeline visually.
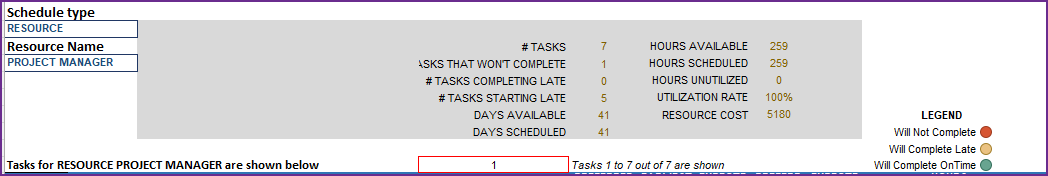
Resource Management Summary
One of the crucial parts of project management is effective resource management. Having a clear view of resource utilization during the project is essential to delivering a successful project.
The Resource Summary table shows each resource’s utilization rate and cost.
Utilization Rate = Hours scheduled / Hours Available
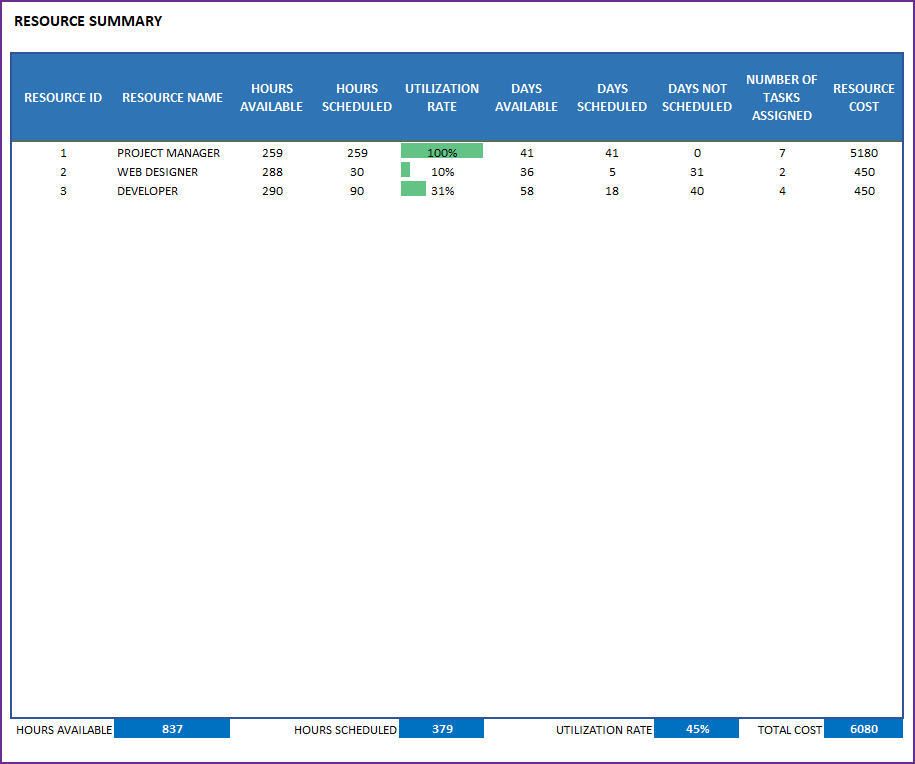
In addition, you can view the detailed number of Hours Available, Hours Scheduled, Days Available and Days Scheduled.
With the Plan Summary sheet, we have seen project level and resource level reporting. Next we can see the task level reporting as well.
Task Schedules
Task Schedules sheet provide three types of detailed schedules. All Tasks, Tasks from one specific project and Tasks assigned to one specific resource.
Once we choose a schedule type, there will be three sections of information.
- Summary Metrics
- Detailed Table with task dates, hours and planning result
- Gantt chart view
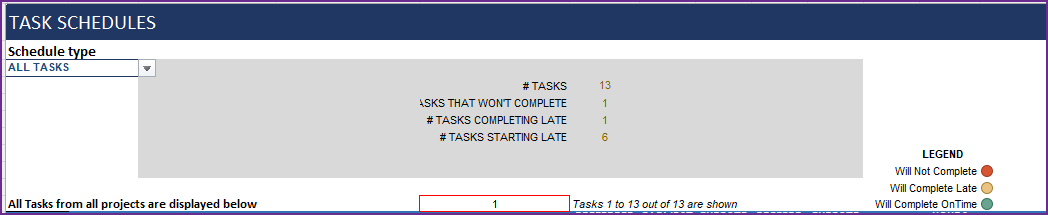
Summary Metrics
For ‘All Tasks’, the summary metrics appear like this.
If we choose a specific project, then the summary metrics display change to present relevant project metrics.
If we choose a specific resource, then the summary metrics present relevant resource management metrics.
Detailed Task level Details
We can see each task listed below along with the key details such as expected start and end dates, hours required and scheduled, and the task plan result.

Gantt Chart view
In the Gantt Chart, we have option to view daily Gantt chart or weekly Gantt chart. We can also enter a start date of our Gantt chart.
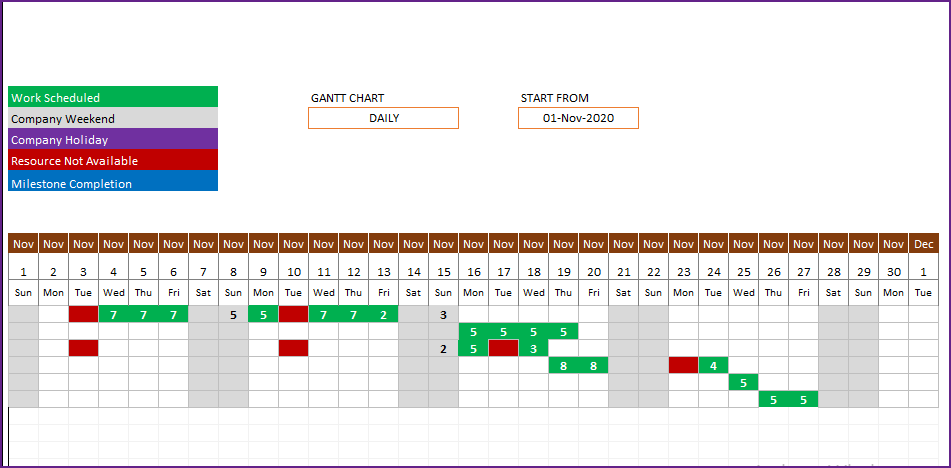
Gantt chart shows the number of hours scheduled for each day for the specific task. It also has the legend that explains the meaning of the different colors.
- Green: Work is Scheduled on this day.
- Gray: It is a company weekend day (resources may be available to work on weekends)
- Purple: Company holiday and no work will be scheduled on holidays.
- Red: Assigned Resource is not available to work on this task. This would indicate an opportunity to assign a different resource to see if that improves project completion.
- Blue: Milestone tasks’ completions are shown in Blue.
Resource View
Finally, we have the Resource View sheet which shows two key pieces of detailed information about resources.
We see the original resource capacity – number of Hours available by each resource on each day during project planning period.

This capacity is calculated based on the availability data we entered for each resource in the Settings sheet, and the Company holiday information.
Next, we also see how many hours each resource is scheduled for project work. In other words, this is the planned utilized time.

The difference between Hours Available and Hours scheduled is the Idle time or unutilized time.
From the above two images, we can see that the Web Designer is available 8 hours a day from Nov 1st to Nov 4th, but utilized only for 8 hours on Nov 4th. So, Nov 1st to Nov 3rd, Web Designer is not utilized at all.
I hope you find the template useful. Please provide your feedback via comments below. If you like the template, please share with others.
Recommended Templates
This basic template can plan up to 25 projects at a time and a total of 150 tasks for maximum Planning period of 60 days. To plan for more than 25 projects and 150 tasks and with a planning period of up to 1 year, please see Project Planner Advanced Excel template.

For more functionality like managing a project, creating customized Gantt charts, resource planning, check out our other products.
-
 Project Management Toolkit Excel TemplatesOriginal price was: $200.$100Current price is: $100.
 -
 Resource Capacity Planner Excel Template$50
 -
 Project Manager Excel TemplateOriginal price was: $40.$35Current price is: $35.