
Reporting in Rental Business Manager Excel template is fully automated and very extensive. We have reporting to help us get an accurate view of business performance in multiple areas (inventory, sales & finance) from multiple dimensions (product and Customer). Reporting is available on inventory levels, accounts receivable, monthly metrics, top and bottom performing product and top performing customers.
This article is part of a series of support articles of Rental Business Manager Excel template. For more information on the product, please visit Rental Business Manager Excel template.
Current Status
First, we can see the current status of inventory and finance.
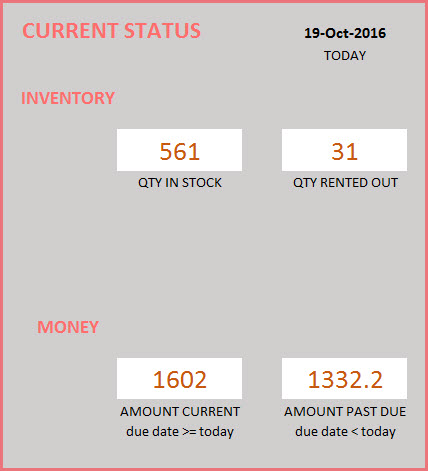
We can see the following metrics
- Total inventory (quantity) on hand
- Quantity rented Out
- Accounts Receivable – Current: Amount due from Customers on Orders with Due Date >= Today
- Accounts Receivable – Past Due: Amount due from Customers on Orders with Due Date < Today
Summary Metrics
Now, we move to looking at the past performance of business. First, we select our report Start and End dates.
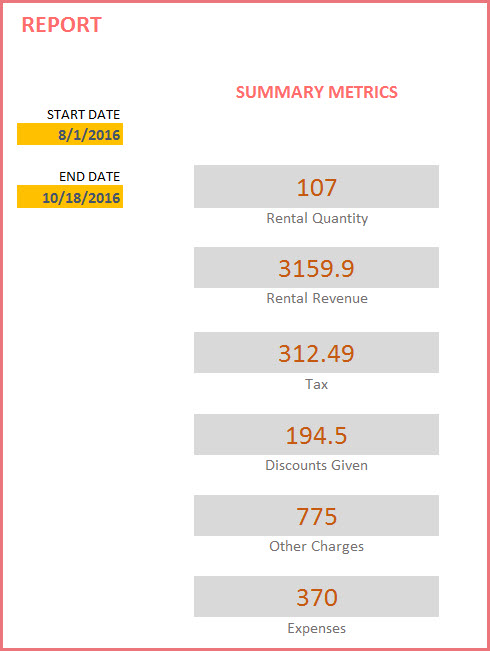
- Rental Qty: Total quantity rented on Booked orders.
- Rental Revenue: Total Order amount on the Booked orders. Includes product level discounts. Does not include tax, order level charges and order level discounts.
- Tax: Total tax amounts on Booked Orders
- Discounts Given: Total amount of discount given to customers on Booked Orders
- Other Charges: Total of other charges on all Booked orders
- Expenses: Total of Expenses
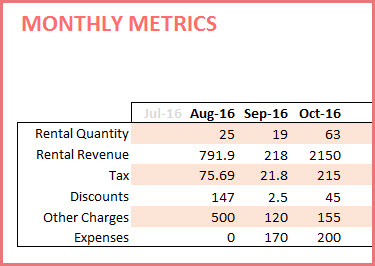
Monthly Metrics
We can view all the metrics by month for up to 12 months.
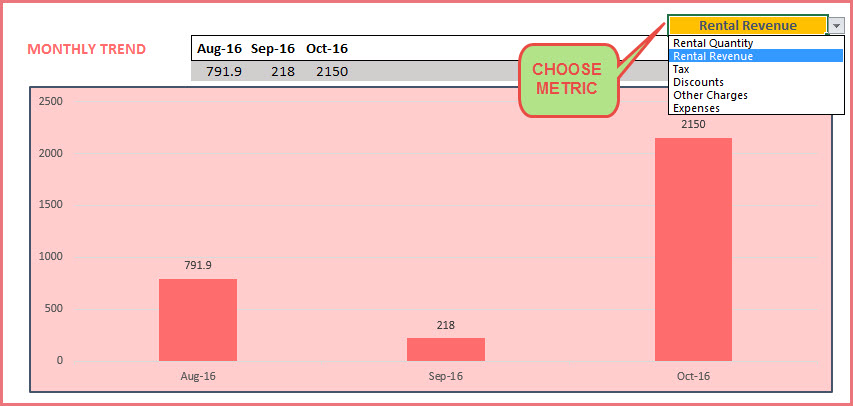
We can choose one of the metrics to update the chart that shows up to 12 months of trend.
Products – Top Performers
One of the important pieces of understanding business performance is knowing which products are rented the most and which ones are not. We have 2 ways of measuring this – Rental Revenue, and Rental Duration. This allows us to understand the true impact of the products to the business.
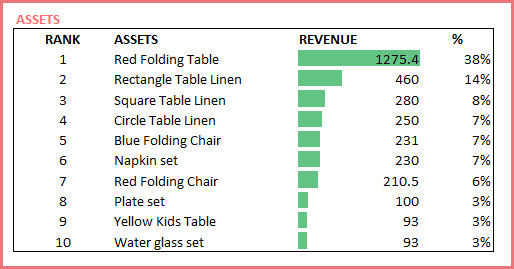
First, we will see the top 10 Asset categories and bottom 10 Asset categories.
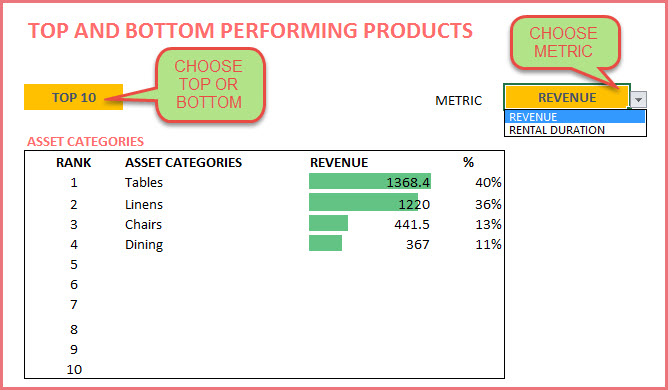
We can also see the top and bottom performing assets.
Product Performance
In addition to that, we would want to look at a specific product and understand its performance. We can choose a product and see its performance summary during the reporting window.
We can see the current inventory status of the product.
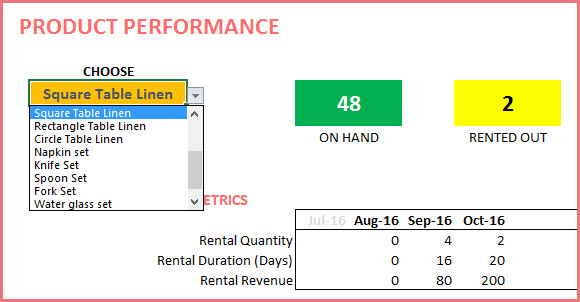
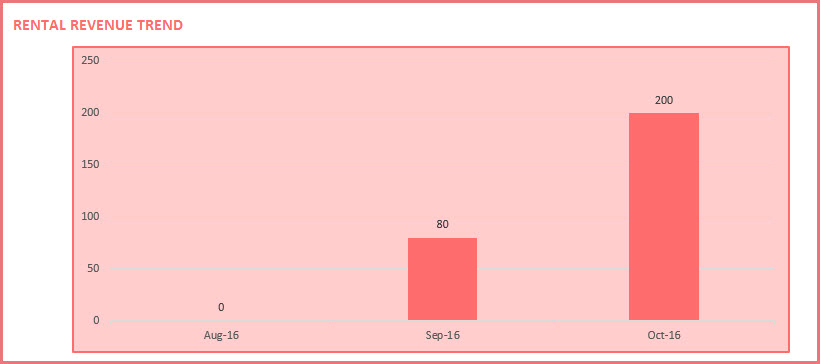
We can also see the sales quantity trend by months of that product.
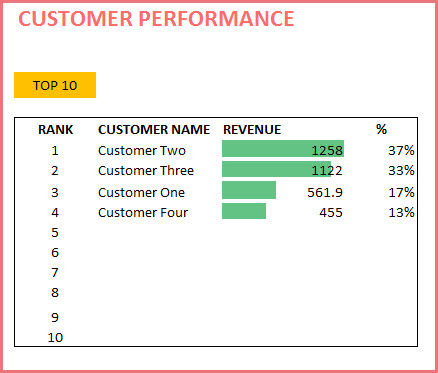
CUSTOMER PERFORMANCE
Another important aspect to understand is best customers.
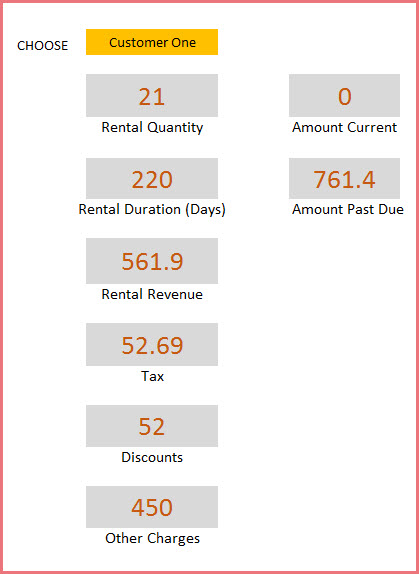
We can choose one specific partner and see their details as well.
Finally, the Assets sheet, the Customers sheet and Order Headers sheet also have useful information that we can filter on to get to the data we need.
In the next article, we will discuss how we can add or retire assets for rental.
[/vc_column_text][/vc_column][/vc_row]