Track sales leads in Excel
Whether you are a small business owner looking for a tool to manage sales leads, or a sales manager needing a simple Customer Relationship Management (CRM) software, you have come to the right place.
I am glad to present a simple Sales Pipeline Template to track and manage your sales leads.
This Excel template is designed for Microsoft Excel, but if you are looking for a Google Sheet template, please visit Sales Pipeline Tracker in Google Sheets.
What is a Sales Pipeline?
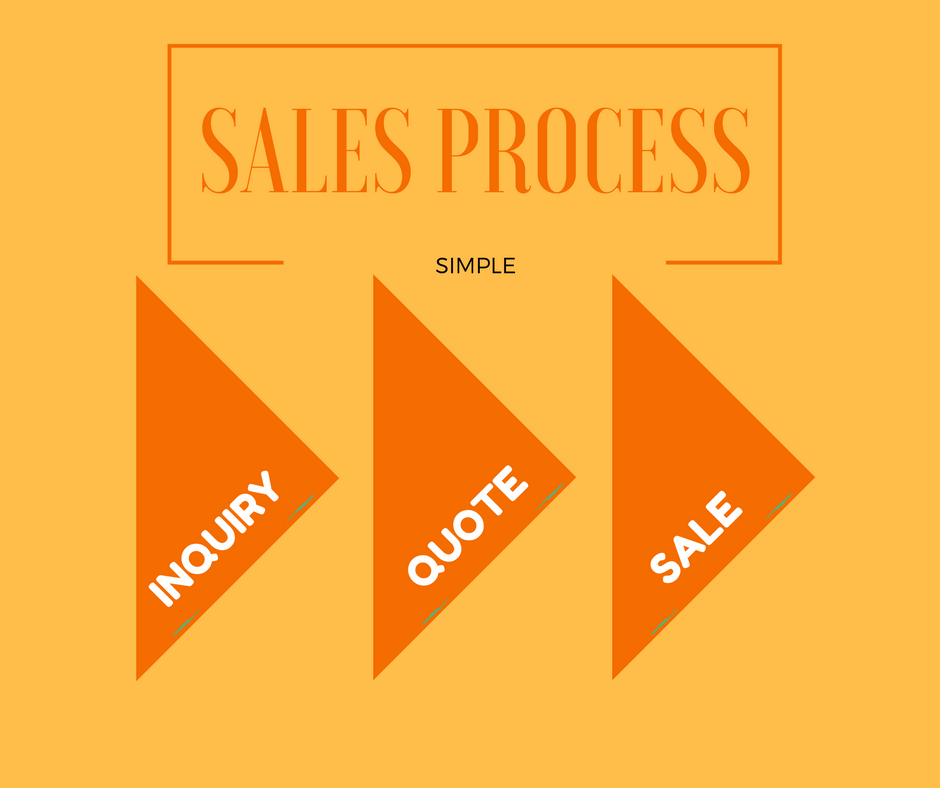
In a typical sales process, a seller or salesman sells a product or service to a customer. The stages of sales pipeline include
Inquiry –> Quote –> Sale
Let us consider a very simple example that explains the 3 stages of sales pipeline
- A prospect sends an inquiry to the company with their needs
- The sales person in the company returns a quote with product and price
- The prospect purchases the product and becomes a customer.
In some scenarios, especially where the product or service’s price is very high, the process can be much longer and may go through many steps.
Companies also, sometimes, prefer the customers to go through a sequence of steps before converting which is called lead nurturing. This allows the sales person to identify the specific needs of prospect and find if there is a match between the needs and the products/service provided by the company. During the stages, the salesperson will be able to gauge the chances of a successful sale.
For example, the following stages could make your sales process.
Lead –> Opportunity –> Demo –> Quote –> Sale
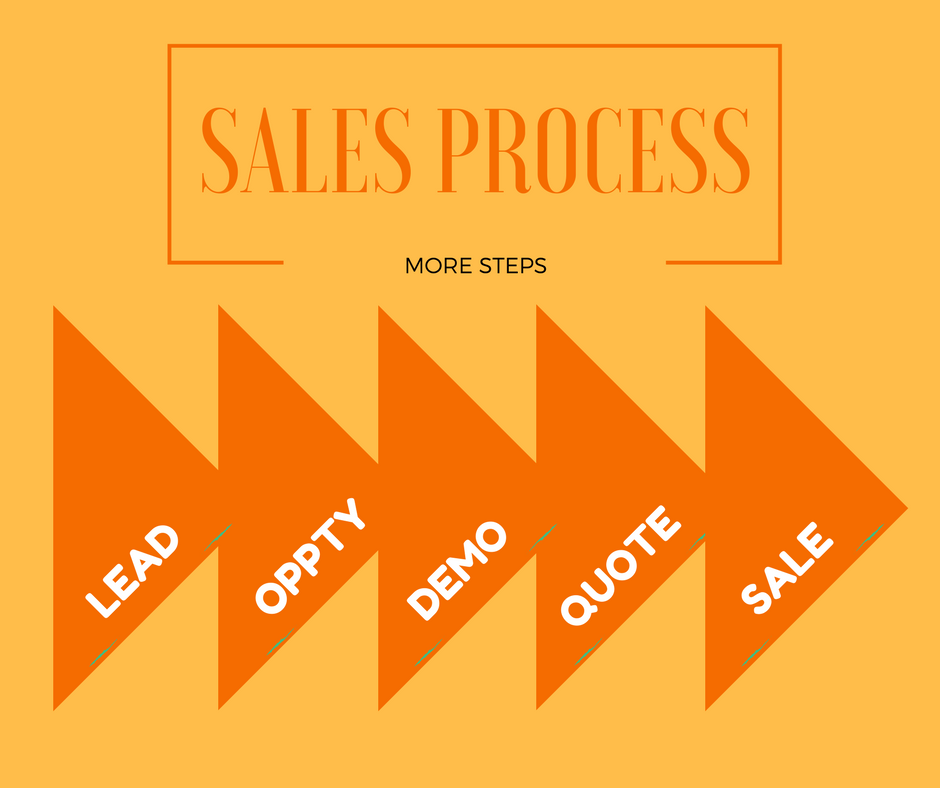
Sales Pipeline is a a visual representation of such a sales process involving the above steps.
Sales pipeline is also referred to as Sales funnel, as the pipeline usually works like a funnel where prospects drop off along each stage before only a few (of those who began at first stage) will finally convert to a customer.
What is Sales Pipeline Management? Why do we need it?
Capturing information related to the sales pipeline and using them allows you to manage the pipeline better. The following are the key benefits.
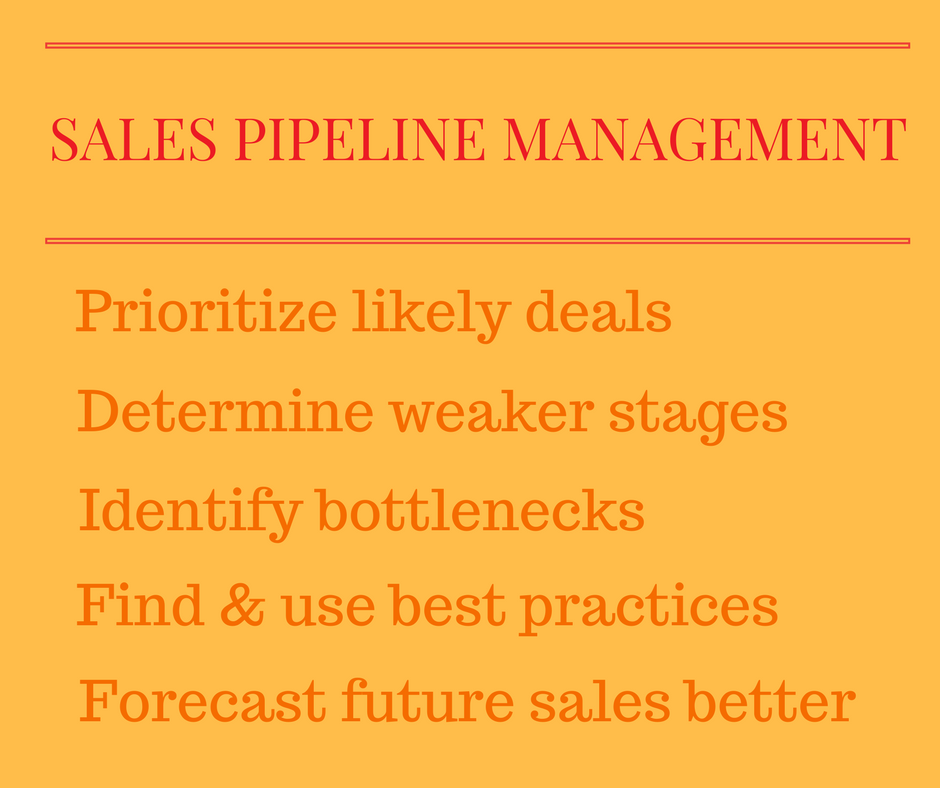
- At any point, know how many deals are in each sales stage and how much are the deal values. This allows prioritization of deals to work on, so that you can work on the deals that need immediate attention and those that are more likely to succeed.
- Determine if there is a weak area in the sales funnel. For example, if more prospects drop off in the final closing stage , it tells you what you need to improve (may be the closing skills of a salesperson or incentives to quickly close the deal).
- Identify if there is a bottleneck in the sales process. For example, if one of your steps requires a specialist to interact with the prospect and that step takes several days due to busy schedule of the specialist. This information could be useful to take action to either increase availability of that specialist or hire/train more specialists.
- In a company with a lot of sales people, the sales pipeline metrics become invaluable in identifying best practices used by the most successful sales person. This knowledge could improve the performance of the entire sales team.
- Know exactly how rich the current active pipeline is. Allows forecasting of future sales based on deals in the current pipeline, win % and the projected close dates of those deals. If the forecasts do not meet your sales target, you can take remedial steps earlier so that you improve chances of meeting sales targets in future.
Why Sales Pipeline Excel Template?
There are several cloud based tools, of all sizes, available to manage sales pipelines in the market. They may also have features such as email notifications, reminders and mobile applications.
For simpler small to medium scale operations, to manage a salesperson’s leads, Microsoft Excel would be more than fine. The obvious benefits with Excel are
- Easy to learn and use
- Easy to extend by adding sheets/calculations
- Easy to modify design (fonts, colors, etc.)
- Easy to customize to unique business needs
- Less expensive than a monthly subscription based cloud software
I am glad to present a simple Sales Pipeline Excel Template that you can download for free.
Features of Sales Pipeline Excel Template
- Track all your sales deals in an organized way in one sheet
- View active sales pipeline broken down by stages
- Calculates Expected Deal Values (based on Win %)
- Calculates average time (days) taken to win deals
- Identifies stages where deals are lost
- Easy tool to filter deals by stage and status
- Easy to customize
Free Downloads
Requirements
Microsoft Excel 2013 or later
Microsoft Excel 2010 or later (if slicers are removed)
How to track sales using Sales pipeline Excel Template?
Overview of Steps
Review 4 stages of sales pipeline. Rename if necessary.
- Entering a new deal in Deals table
- Enter basic deals data (Company Name, Contact Name, Deal Value, Created Date)
- Enter current Stage in which the deal is.
- Enter Win % as the chance of winning the deal.
- Updating a deal as you make progress
- Update Stage if the deal has moved forward to the next stage.
- Update Win % if it has changed over time.
- Enter Next Activity Date and Notes
- Closing a deal
- Enter Status (Won or Lost) if the deal is closed.
- Enter Close Date
- Monitoring performance regularly to gain insights
- View active pipeline to know if you are on target to meet your goal
- View deal conversion rate and average time to win a deal
- Identify stages where deals are lost and work on improving
Detailed Steps
Step 1: Review Stages in Sales Process
By default, the sales pipeline template comes with 5 stages (Lead, Opportunity, Demo, Quote and Sale) . The first 4 can be renamed easily by typing directly on the stage names.

Step 2. Entering a new Sales deal (or lead)
We can enter new deals by typing in the Deals table.
For more on data entry in Excel tables, please visit Excel Tables for Data Entry
Each row is a separate deal and it would have Company name, Contact person name, Deal Value and Created Date.
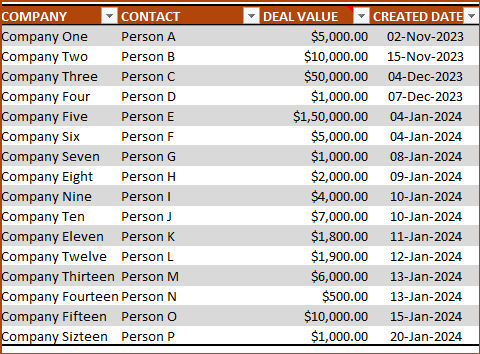
Deal Value can be estimated if it has not been determined yet. But please enter a value so that the sales pipeline can be evaluated.
We will then enter the current Stage of the deal.
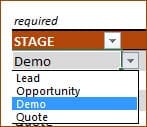
The 4 stages we had defined earlier will be the values to choose from, in the drop down list.
Then, we enter a Win % for each deal. For deals that are not closed yet, we would enter our estimate of the chances of winning a deal. If we have a 50-50 chance of winning or losing a deal, we would enter 50%.
In some businesses, the Win % are defined to be constant for a specific stage. Example: 10% for all Leads, 30% for all Opportunities, 50% for all Demos, 80% for all Quotes.
This is a sample data set with Stage and Win % entered.
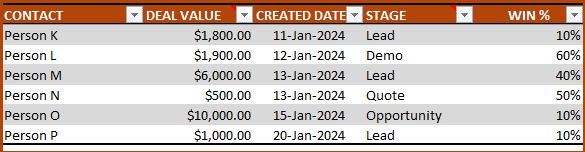
4 more Columns are provided to enter the Email address, Phone Number, Next Activity Date and Notes.
Step 3: Updating a Deal
As we continue to work on deals, new information may arrive. Based on that, we need to update the deals.
Update Win % and Stage columns for deals as needed, so that your active pipeline is always reflecting the reality.
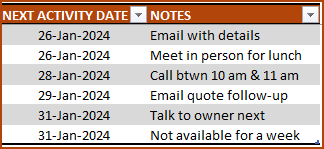
After working on the deal, we would usually schedule the next activity for a future date. We can enter that next activity date in the Next Activity Date column and enter details in the Notes column.
Step 4: Closing a Deal
Deals can be closed if a decision has been taken by the customer to purchase. This is the scenario of a deal WON.
If prospect decides to not to purchase or if it has been a while since the prospect has been in touch, we can close the deal as LOST.
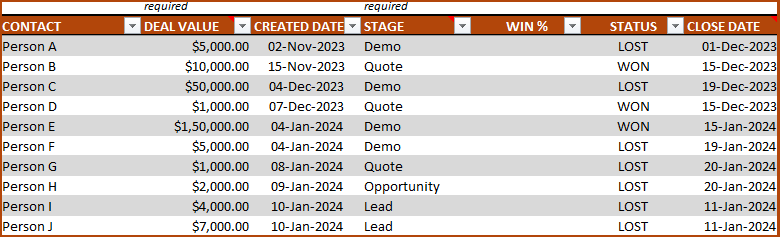
We can enter this information by entering the STATUS to be ‘WON’ or ‘LOST’.
Then, we should enter the CLOSE DATE. This date is used to calculate the Average time taken to Win a deal.
If the Close Date is left blank, you will see a red border indicating that the entry is missing.
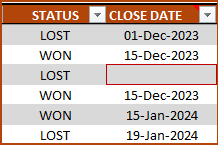
This red border will also appear if Close Date is less than Create Date. This is to ensure that the data is accurately entered.
Tips:
Win % could be deleted for closed deals as we already know the result of the deal. They will be ignored for calculations.
For lost deals, Stage should reflect the last stage the deal was in. This will be used to identify where deals are being lost the most.
Step 5: Monitor Sales Pipeline performance
This step is one that should be done regularly. It is important to keep an eye on the pipeline metrics to improve performance.
The top section of the sheet shows several important metrics needed. Let’s discuss one by one.
Active Pipeline
First, the sales pipeline summary metrics.
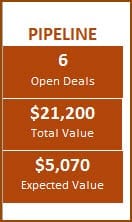
- Open Deals: This represents the number of deals that are not closed yet. Any deal whose status is empty (neither WON nor LOST) will be considered as an open deal. Once a status is entered, it becomes a Closed Deal.
- Total Value: This is the total value of all open deals. The Deal Value we enter in the Deals table will be used as such. If we win all the open deals, this is the amount we will successfully sell.
- Expected Value: The reality is that we will win some deals and lose some deals. So, it is better to be realistic about our estimated sales. Expected value is the weighted sum of deal value by Win %.
Metrics by Stage
As the summary metrics describe the current scenario of the entire pipeline, it is also equally important to know the metrics on the deals by stage.
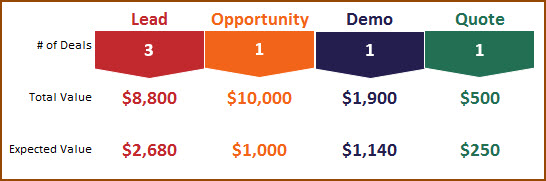
As shown in the image above, the same three metrics (Number of Open Deals, Total Deal Value and Expected Deal Value) are shown for each of the 4 stages.
Closed Deals Performance
The previous section showed the active pipeline. As important that is, it is also important to know how we have been performing in closing deals. It can tell a lot about the future.
The next section shows the performance of closed deals.
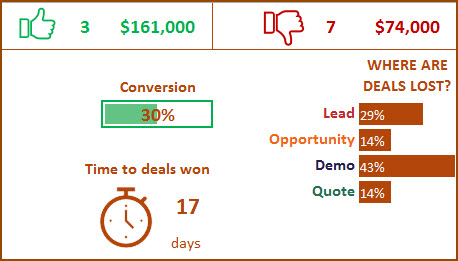
Deals Won and Lost

In the sample above, 3 deals were won for total of $161,000 and 7 deals were lost valued at a total of $74,000.
Conversion Rate & Average Time to win deals
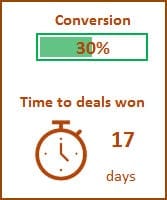
3 deals were won out of 10 closed deals and hence Conversion Rate is shown as 30%.
The 3 won deals took on average 17 days to close. This is based on the Close Date and Created Date we entered.
Where are deals lost?
By knowing where the deals are being lost, we can work on those stages to improve our performance.
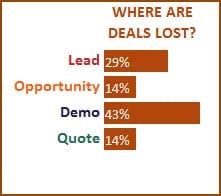
Of the 7 deals we lost, 29% were lost in the Lead stage, 14% in the Opportunity stage, 43% in Demo stage and 14% in Quote stage.
We have entered a small sample of deals here. As we enter more and more data, these % will become very telling in revealing our strengths and weaknesses. If Demo is the stage we fail most often, we may need to improve the demo event to convince our prospects about the usefulness of our products.
Tips on working with Deals Table
Filter deals by Slicers (compatible with Excel 2013 and later)
As we enter more and more rows in the Deals table, it will become important to have a way to easily find the deals to work on. There are a couple of slicers (filters) provided at the top right.
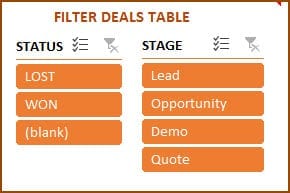
We can use the filters to select deals by Status and Stage.
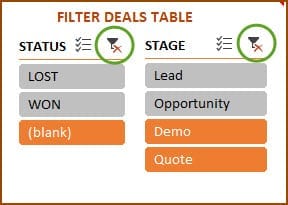
In the image above, I have selected (blank) for Status and Demo and Quote for Stage. This will now filter the table to show only deals that are open and in the Demo or Quote stages.
Tips:
To select multiple values in one slicer, press ctrl key
To clear all selections press the ‘Clear Filter’ button at top right of the slicer.
Filter deals on Table
Since we are using an Excel table, we have the default features such as filtering and sorting.
For example, if we want to filter only deals of values > $5000.
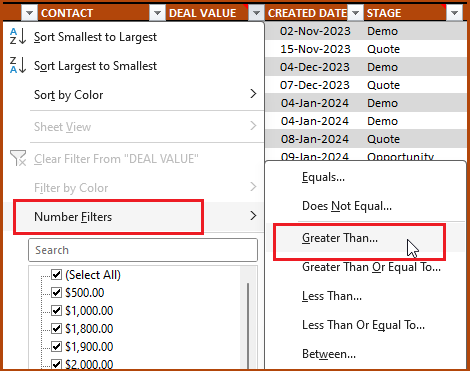
The above (Greater Than) is just an example. You can use all other types of filtering available in Excel tables. You can use the filters in any of the fields (example: Company).
Customizing the Sales Pipeline Excel template
How to modify Currency?
The template by default uses US$ as currency. To change, just select the cells where you want to change the currency. Then, press Ctrl+1.
Now change the currency symbol in the dialog box as shown above.
How to add a slicer? (Slicers on tables work only in Excel 2013 or later)
I have provided Stage and Status as two slicers. If you need to add any of the other columns as slicers, it is easy.
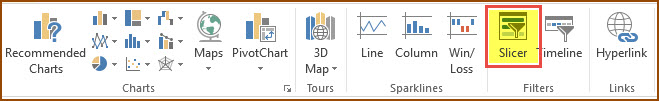
Select a cell inside the Deals table first.
Then, in the INSERT ribbon, choose Slicer.
Then, you will see a dialog box that will display all the fields in the Deals table.
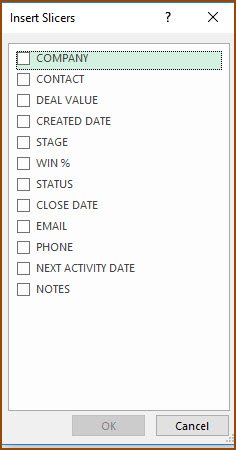
Choose one or more fields for which you want the slicers, and press OK. Now, you should see new slicer(s) that you can use to filter.
How to add extra column?
You can create a column easily by typing the new column name in cell M11.
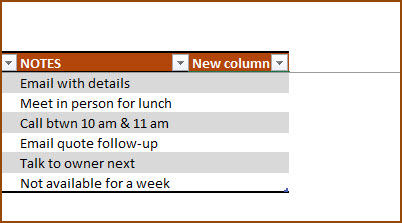
After that, if you need another one, enter a column name in cell N11.
Is the file password protected?
No, the file is free to download and fully open for editing.
The file uses formulas in just the DEALS sheet and there are no hidden sheets. As we are using an Excel table, Excel does not allow both sheet protection and Excel table’s auto-expand feature at the same time. As the table feature is critical to easy and quick data entry, sheet protection is not implemented.
The top section above the table, which has the metrics, have formulas embedded. Please be careful and do not edit the formulas unintentionally.
What do you think about this template?
I hope you find this template useful. This is the first version of the Sales Pipeline Tracker. It will be great if you can provide feedback on what features you like and what can be improved.
Recommended Template
For more functionality, please see our premium templates.
- Automated & Interactive Dashboard with Sales Funnel KPIs
- Actionable Insights on what type of deals are working
- View Active Pipeline with projected sales by month and expected deal value
- Easy to customize. Customize (up to 12) Sales funnel stages. Customize attributes & Dashboard
- All In One File – 2000 deal limit (default) can be extended easily if needed

Available for Excel and Google Sheets.
Buy Premium Sales Pipeline Template and get more functionalities!