


You can use this template to build your own Simple Moving Average technical indicator for any stock.
In this article, we will be covering the following.
- Introduction to Technical Indicators
- Simple Moving Average – Concept
- Template and its Features
Requirements
Microsoft has introduced a new feature in Excel called Data types. One of the data types is ‘Stocks’. That’s what we will be using for these templates. This feature is available in Microsoft 365 Subscription Plans for PC and Web
For all the templates in this ‘Excel for Stock Market’ series, please visit indzara.com/stock-market-templates
Download
Video Demo

Technical Indicators
Technical Analysis is the study of market action, primarily through the use of charts, for the purpose of forecasting future price trends. ‘Market action’ includes the three principal sources of information available to the technician – Price, Volume and open Interest.
Technical Analysis of the Financial Markets – John J. Murphy
Technical indicators are calculations that are performed on the history of the stock, primarily the price and trading volume of the stock, in order to determine when to buy or sell.
There is a lot of technical indicators, commonly used by traders. There is also no limit to what calculation you use to identify trading signals – when to buy, when to sell, when not to buy or sell.
We will see how we can use Excel to calculate some of the most used technical indicators.
How to calculate Moving Averages?
Moving Averages is one of the most used technical indicators. It is a simple concept, easy to understand and interpret. It is basically a smoothing device.
Let’s take a simple example where we have closing price of a stock for each trading day.
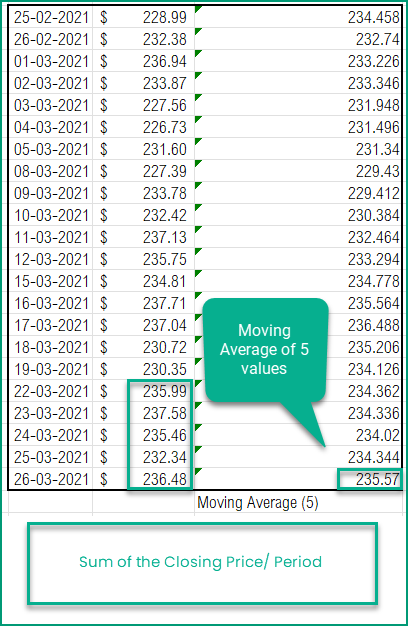
To calculate the moving average of 5 periods, for March 26th, we average the price of 5 days (Mar 22nd to 26th).
To calculate the moving average of 5 periods, for March 25th, we average the price of 5 days (Mar 19th to 25th).
A couple of parameters in this calculation are
1) Length of the moving average – how many periods to use for calculating average. In the example above, we used 5.
Common moving average lengths are 10, 20, 50, 100 and 200.
If the length is greater, the smoothing effect is greater and the indicator is less impacted by sudden price fluctuations.
2) Source – what value are we averaging. In the example we used the closing price of the stock.
Though Closing price is the most used for calculating simple moving average, you can also use High, Low, Open, and Volume as well.
Signals
Commonly used trading signals using the Moving average method are listed below.
Once again there is no golden rule or a rule that works all the time. Otherwise, everyone will use that rule and make a lot of money easily.
- If the closing price moves from below the Moving Average line to above the Moving average line, then a Buy signal is generated.
- If the closing price moves from above the Moving Average line to below the Moving average line, then a Sell signal is generated.
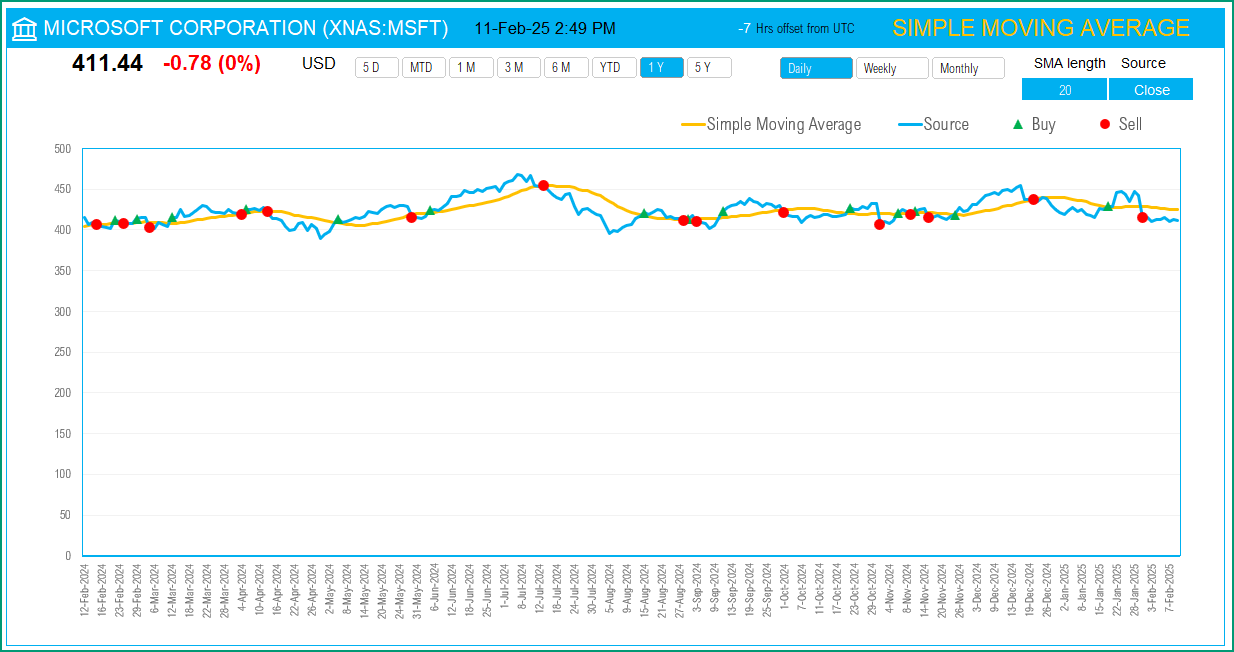
Simple Moving Average Template
The template will help you create the Moving Average line and also calculate the trading signals instantly for any stock.
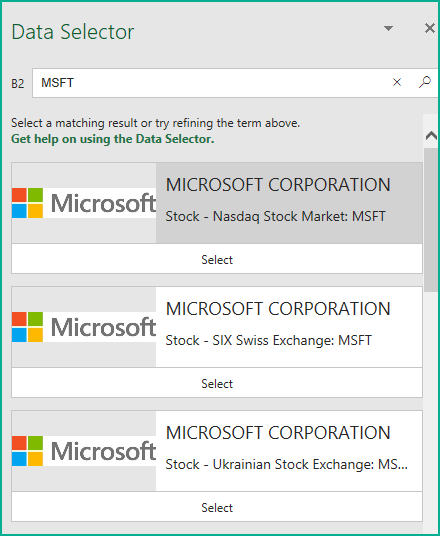
How to calculate Moving Averages in Excel?
Type in a stock sticker symbol. If Excel does not recognize your stock symbol, it will pop up this data selector box.
You can select the stock you are interested in.
Period
The template can pull up to 5 years of price history by default. You can choose how much history to display on the chart easily using the slicer buttons.

The options are 5 Days, Month Till Date, 1 Month, 3 Months, 6 Months, Year Till Date, 1 Year, 5 Years.
Interval
The template allows price history at 3 different intervals.

Daily/Weekly/Monthly are the options.
Simple Moving Average Inuts – Length and Source
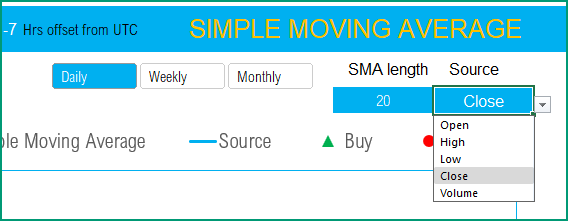
Length: You can type in a length in periods. For example, in the above screenshot, we have entered 5 periods.
Source: Choose from the drop down list of the 5 options for source values.
The chart will update automatically based on all the above inputs.
Trading Signals
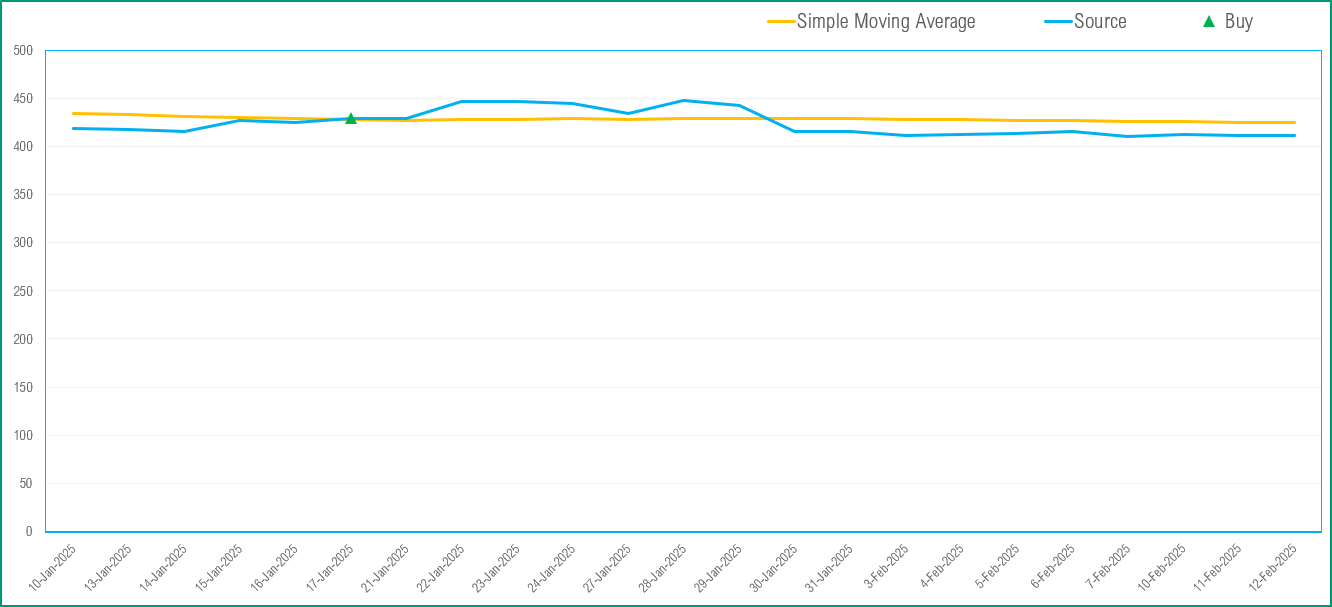
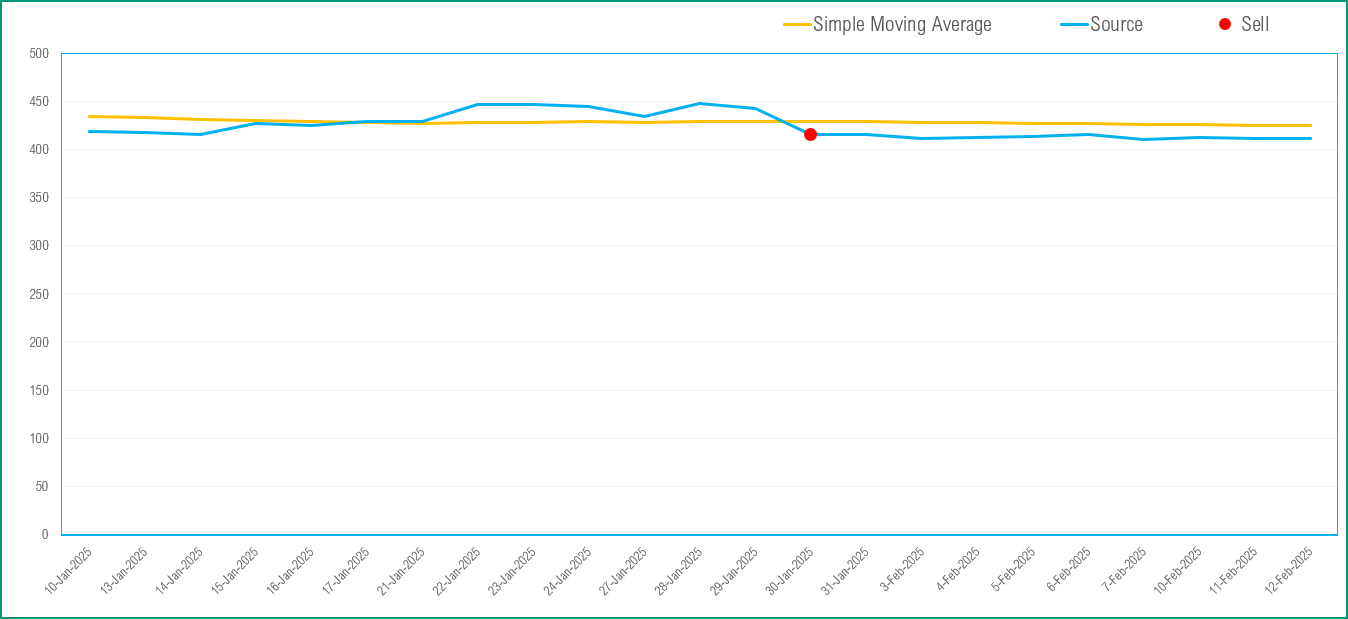
The template shows the buy and sell signals on the chart.
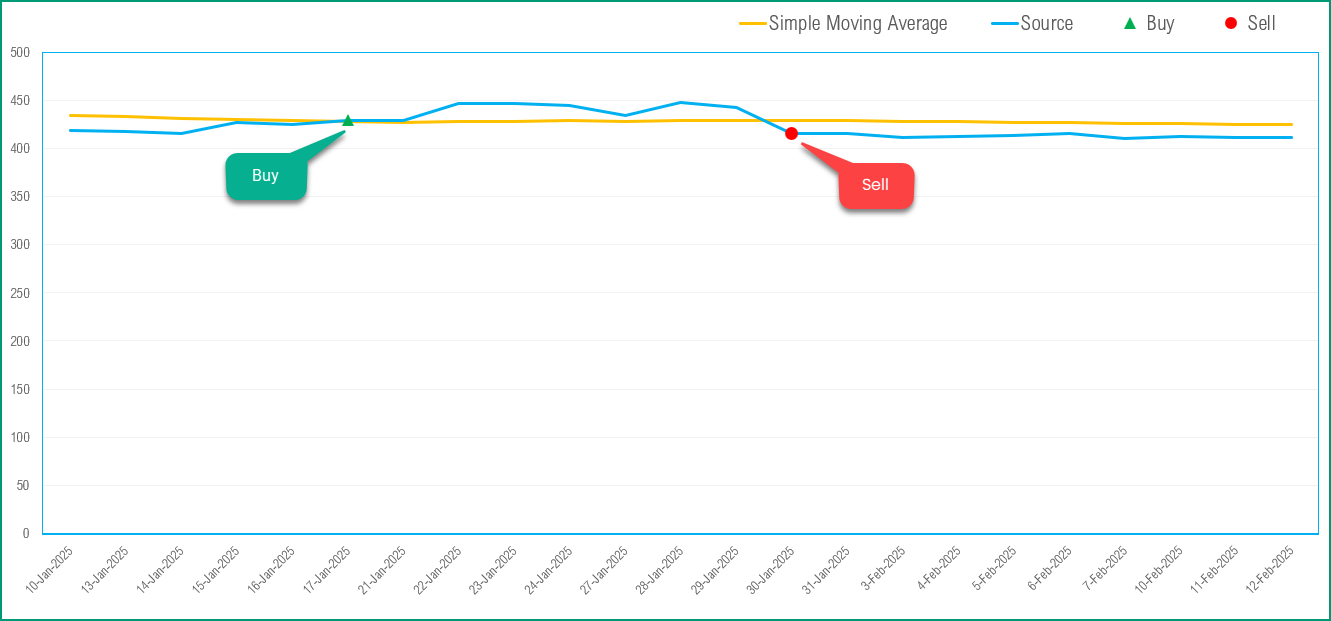
- If the closing price moves from below the Moving Average line to above the Moving average line, then a Buy signal is generated.
- If the closing price moves from above the Moving Average line to below the Moving average line, then a Sell signal is generated.
- If neither is true, no signal will be generated.
In addition, if the latest day has a Buy or Sell signal, it is displayed on the top next to the current price.
Timezone
On the top right you can see the maximum of the last trade time of these currencies.
The default time that Microsoft provides is UTC. The offset is set to -7 hrs, to convert to pacific time zone.
You can modify this if you need the time in a different time zone.
Visit https://savvytime.com/converter/utc to view offset
Resources
https://www.tradingview.com/support/solutions/43000502589-moving-average/
https://www.investopedia.com/articles/active-trading/052014/how-use-moving-average-buy-stocks.asp
The foundation of this template is the Stocks Data type and StockHistory function.
Please read more on Stocks Data Type.
Please read more on StockHistory function and how we use to extract the price history of a stock or currency.
Here is the link to the article from Microsoft which shows which exchanges are available and the delay in data refresh for each.
How to refresh?
To refresh the price and other information, just use the regular Excel refresh in the Data ribbon.

-
 SMA Strategy Backtester Google Sheets Template$25
 -
 SMA Strategy Backtester Excel Template$25
 -
 RSI Strategy Backtester Google Sheets Template$25
 -
 RSI Strategy Backtester Excel Template$25
 -
 MACD Strategy Backtester Google Sheets Template$25
 -
 MACD Strategy Backtester Excel Template$25
 -
 Simple Moving Average Stock Screener Google Sheet Template$25
 -
 Stock Screener Excel Template$97
 -
 Simple Moving Average Stock Screener Excel Template$25

Feedback
Please share your experience. I expect this to be different with different exchanges and countries. Is it working for you? Is it working differently? I would love to hear from you.