


In this article, we will be discussing the Two Stocks Comparison Template that you can use to compare any two stocks.
The template can assist in
- Comparing any 2 stocks on current price data as well as several attributes
- Viewing Price history of the two stocks
- Customizing the price history by time period (5 days, MTD, 1 Month, 3 Months, 6 Months, YTD, 1 Year, 5 Years) as well as time interval (Daily, Weekly, Monthly)
- Viewing the price trends of two stocks on same axis or different axis.
Download
Video Demo

How to compare two stocks in Excel?
The template automatically pulls data from the Stocks Data type service and displays for analysis.
The user has the following input controls to customize the chart.
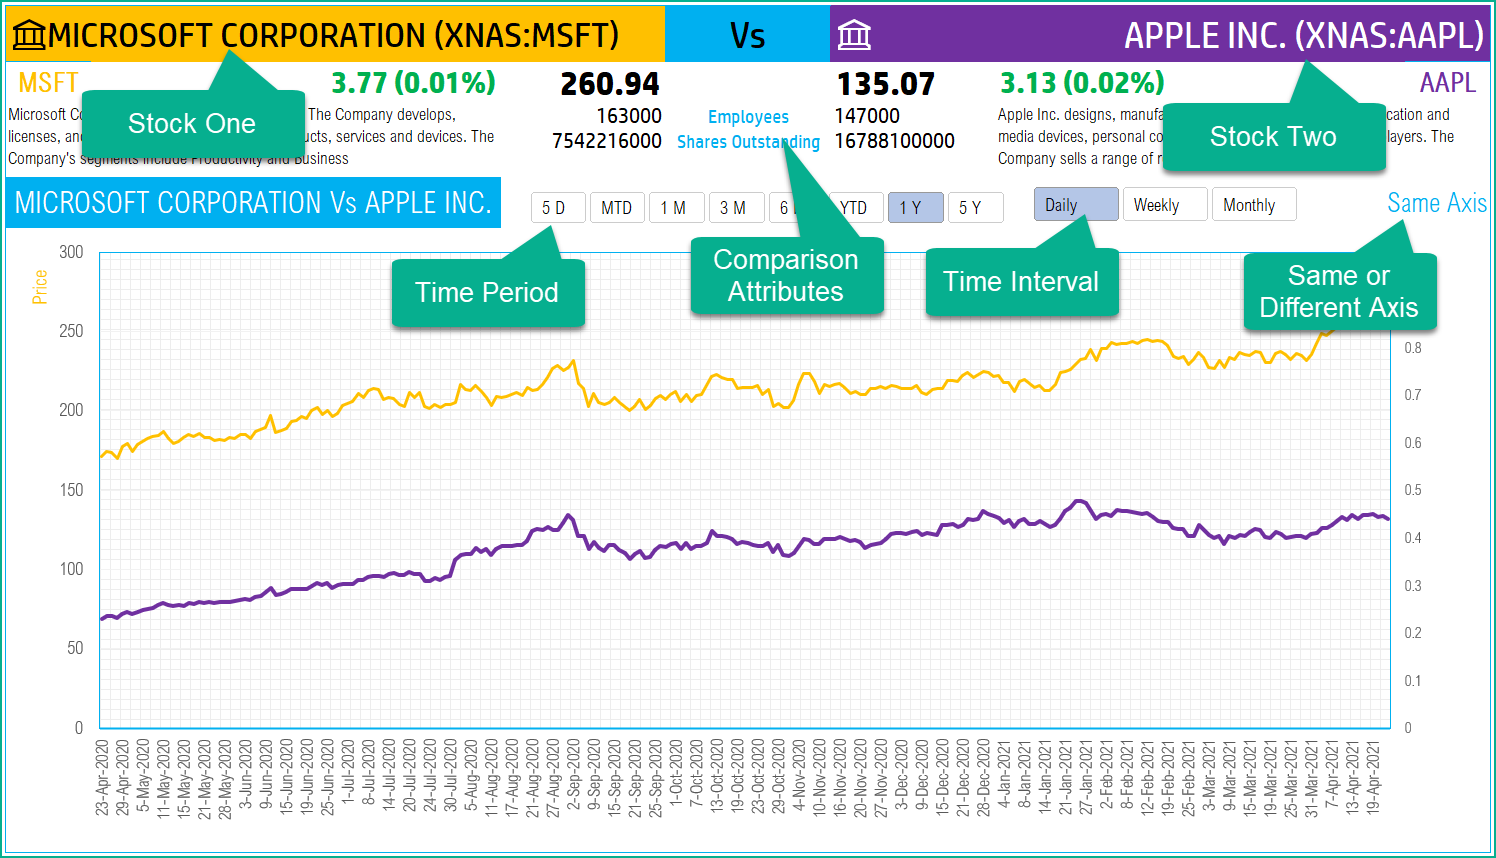
Two stocks to compare
Just type in a ticker symbol stock symbol
If Excel does not recognize your stock symbol, it will pop up this data selector box.
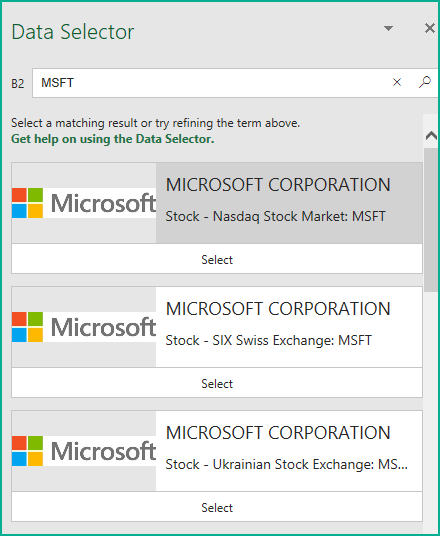
You can select the stock you are interested in.
Period
The template can pull up to 5 years of price history by default. You can choose how much history to display on the chart easily using the slicer buttons.

The options are 5 Days, Month Till Date (MTD), 1 Month, 3 Months, 6 Months, Year Till Date (YTD), 1 Year, 5 Years.
Interval
The template allows price history at 3 different intervals.

Daily/Weekly/Monthly are the options.
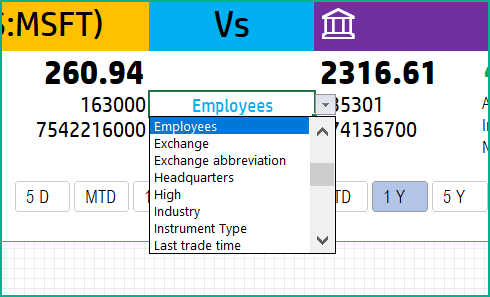
Customize Attributes
There are two attributes that can be compared side by side for the two stocks. You can modify them by choosing from the drop down as shown below.
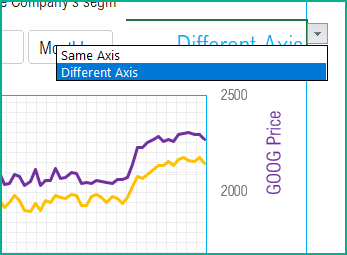
Choose Axis
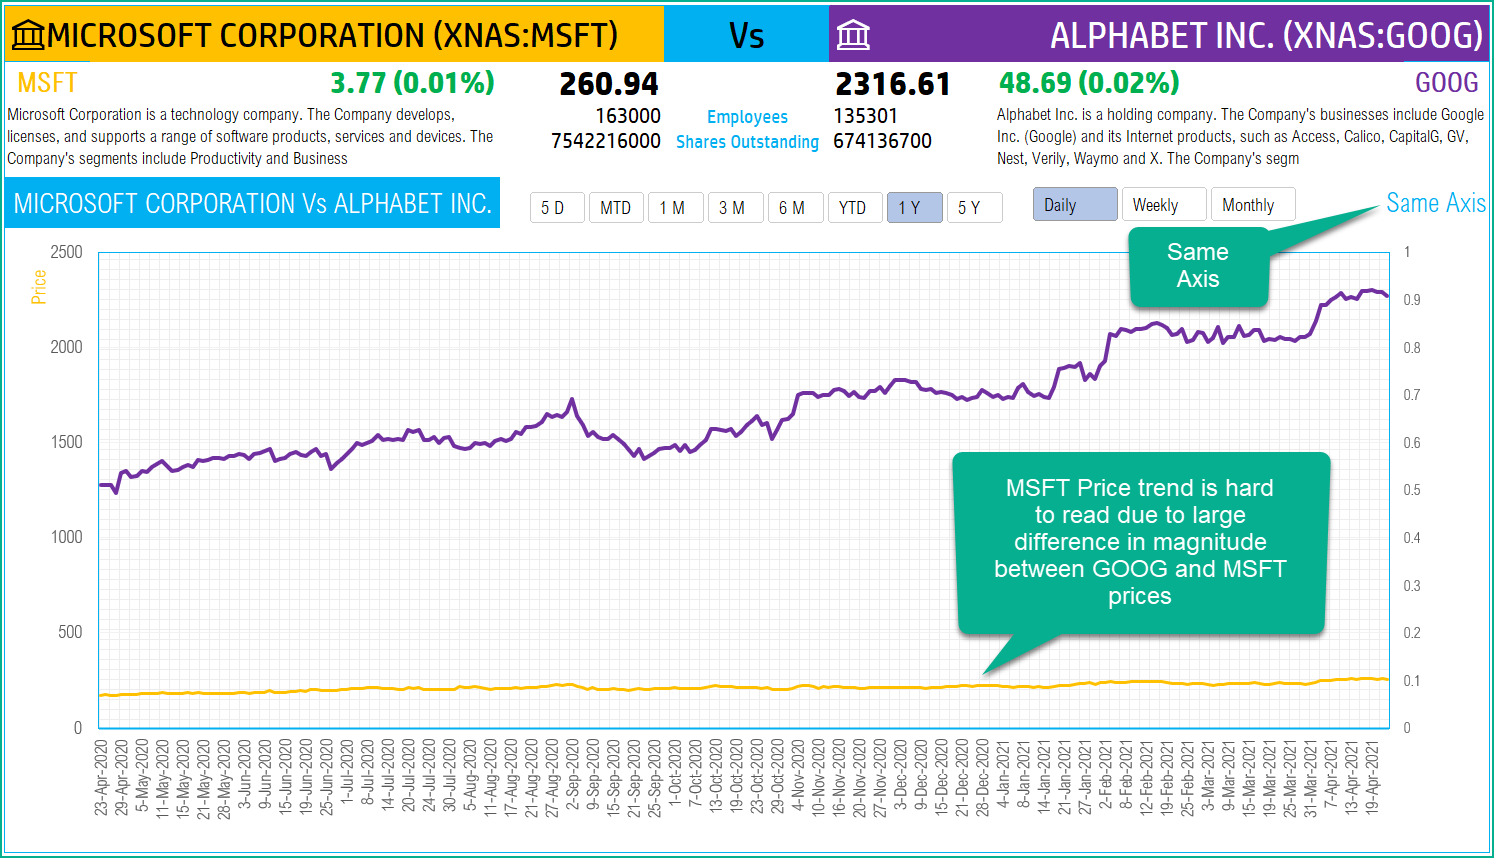
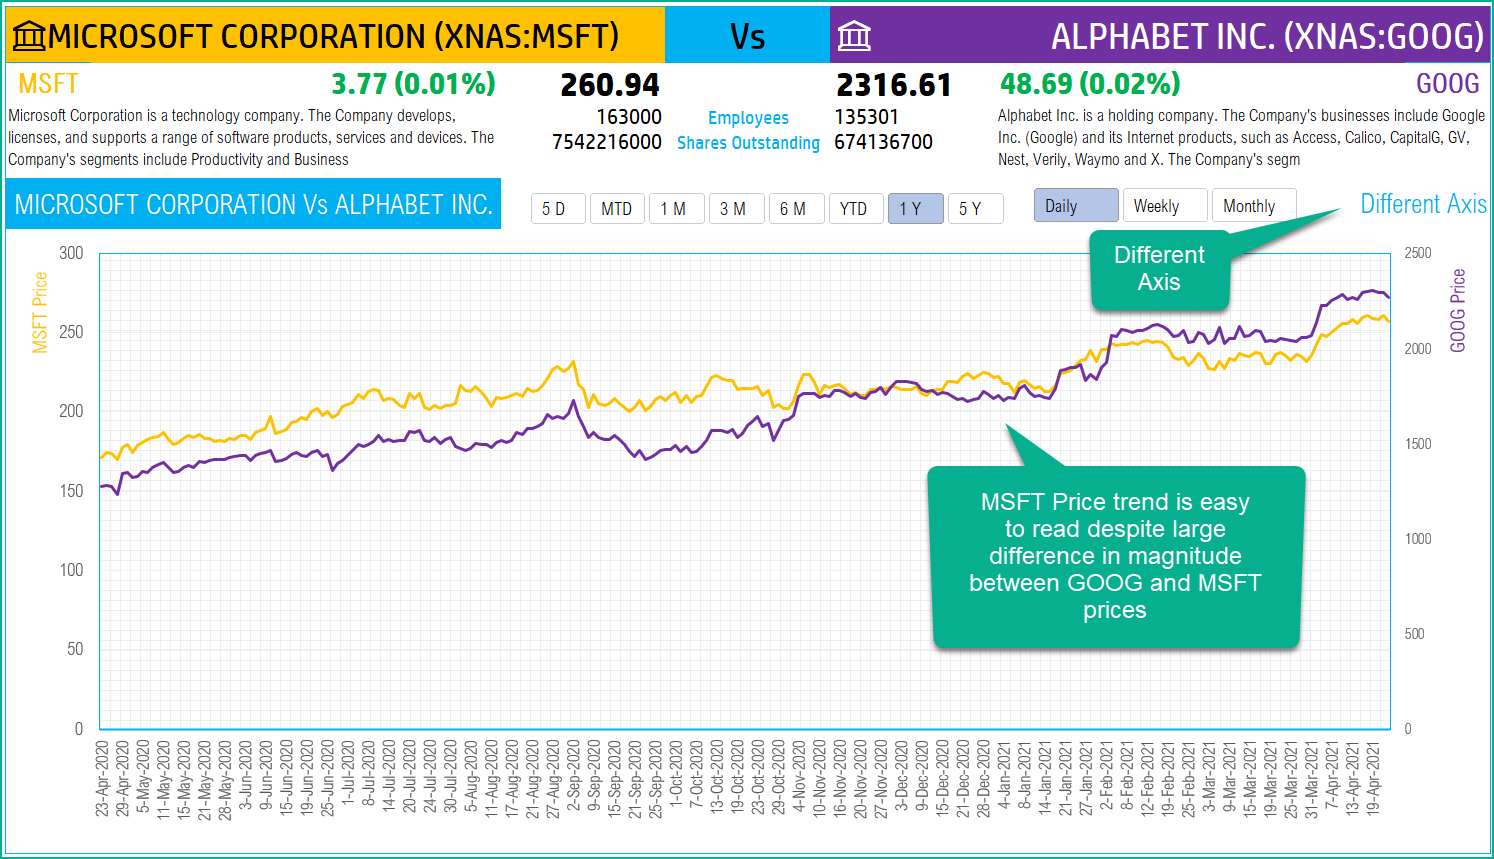
On the top right above the chart, there is an option to choose whether you would like the two price trends to be plotted on the same axis or different.
When you choose Same axis, if the two stocks price magnitudes are very different, the lower magnitude stock trend will be hard to read. Below is an example between MSFT and GOOG.
When we choose Different Axis, now the trends are easier to read.
How to refresh data?
If you have left Excel idle for a few minutes and would like to refresh the data, click on Refresh All in the Data ribbon.

Timezone

On the top right you can see the maximum of the last trade time of these stocks.
The default time that Microsoft provides is UTC. The offset is set to -7 hrs, to convert to pacific time zone.
You can modify this if you need the time in a different time zone.
Visit https://savvytime.com/converter/utc to view offset
Sample Analysis
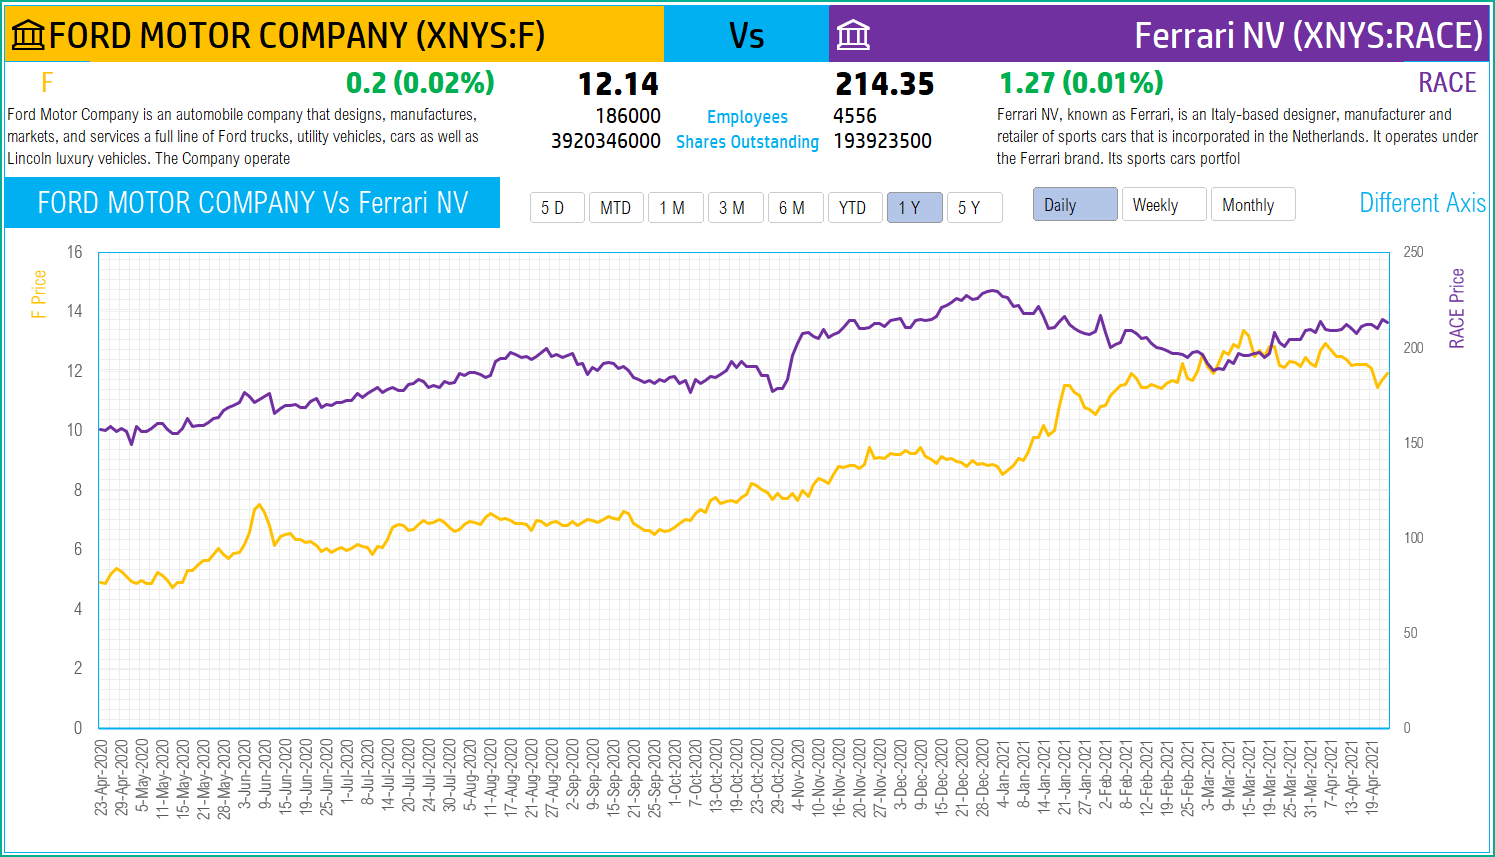
You can type in various combinations of the above inputs to analyze the stocks according to your needs. Here are some samples of what can be done using this template.
Ford vs Ferrari
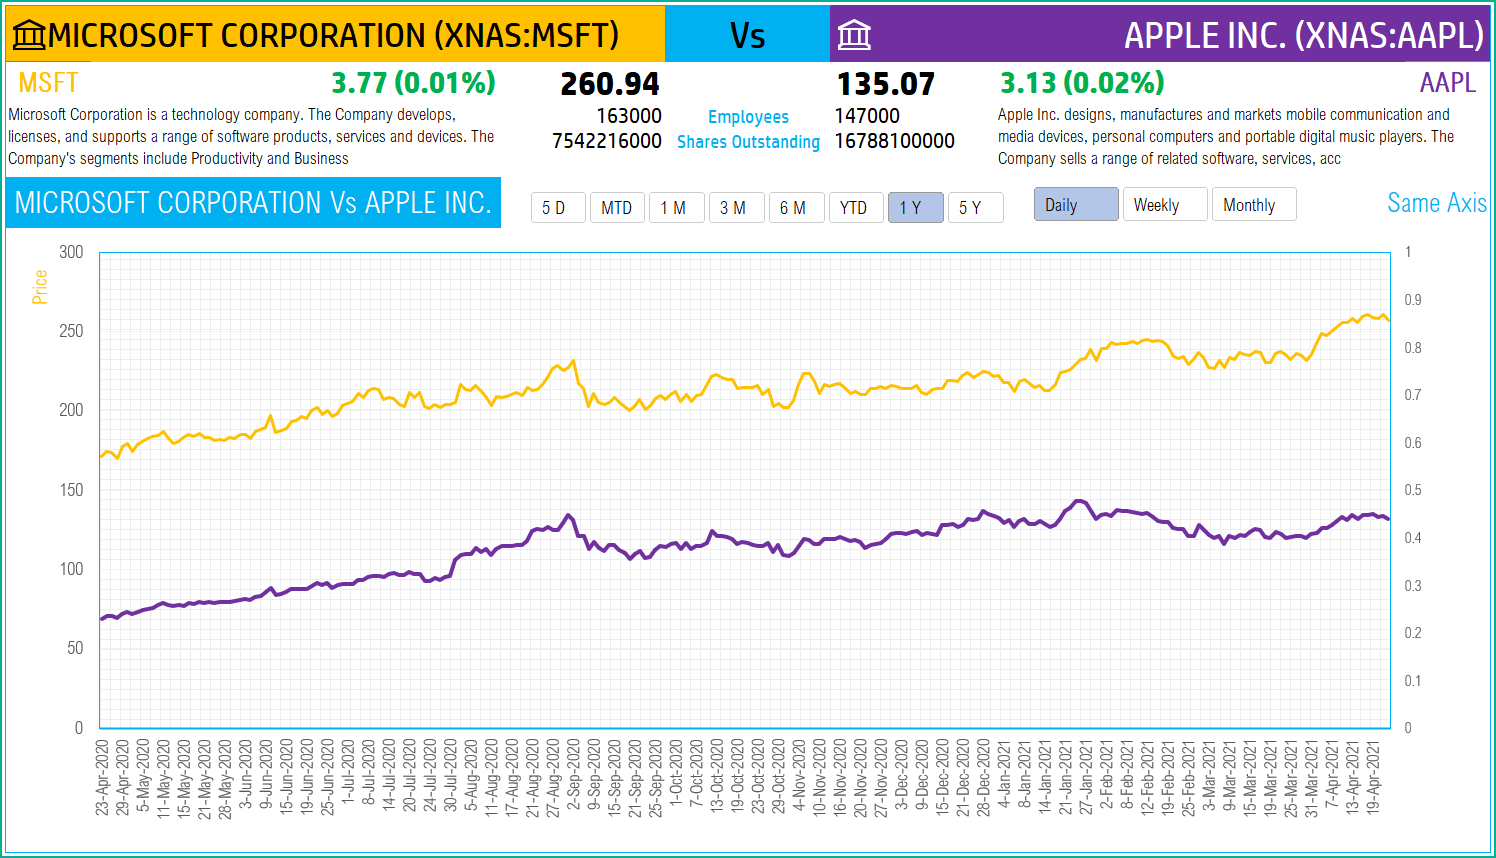
Microsoft vs Apple
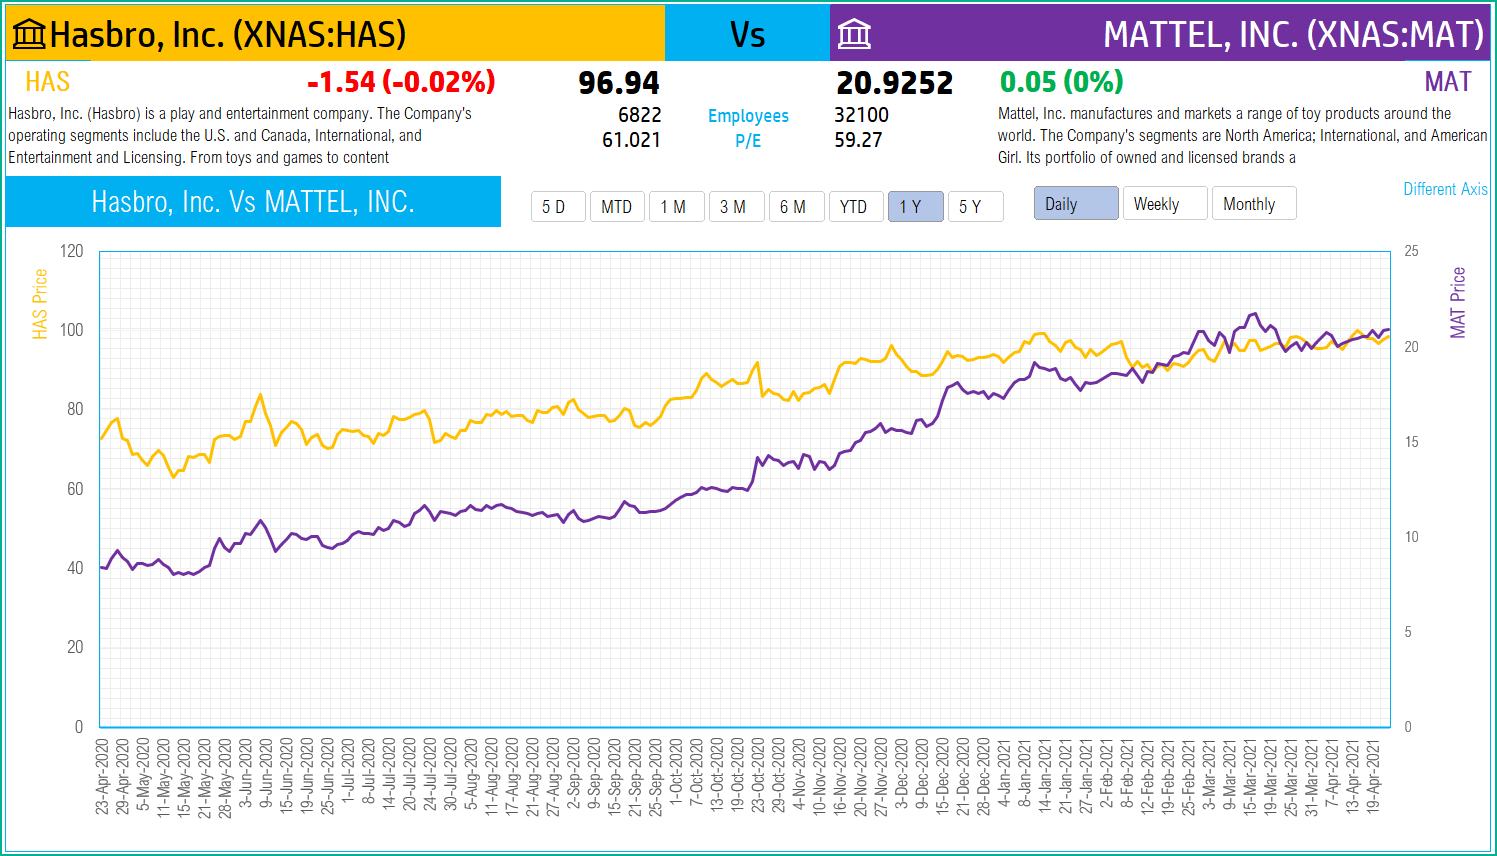
Mattel vs Hasbro
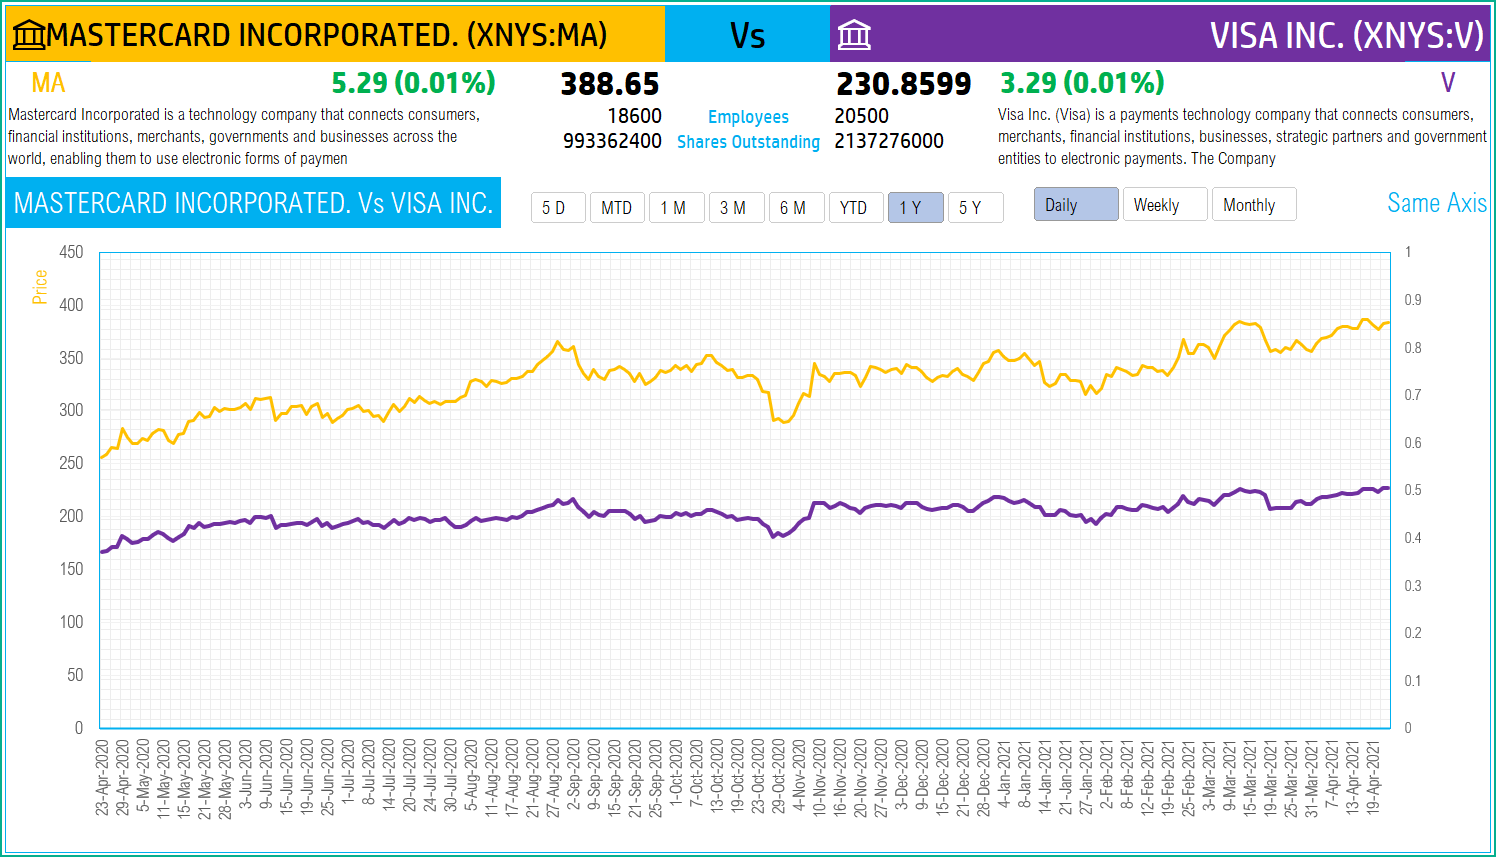
Mastercard vs Visa
Facebook vs Twitter

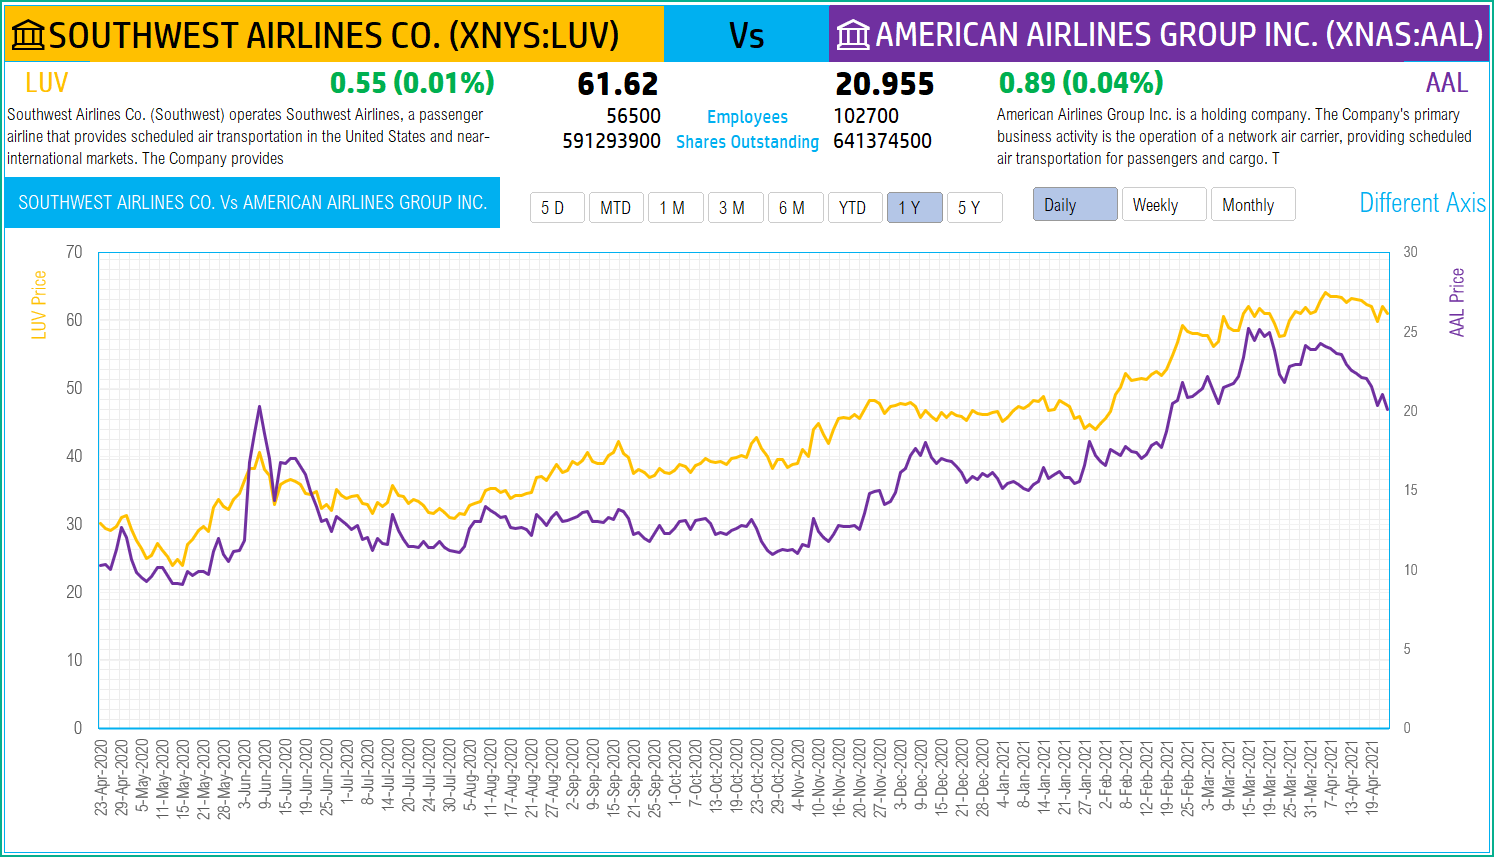
Southwest Airlines vs American Airlines
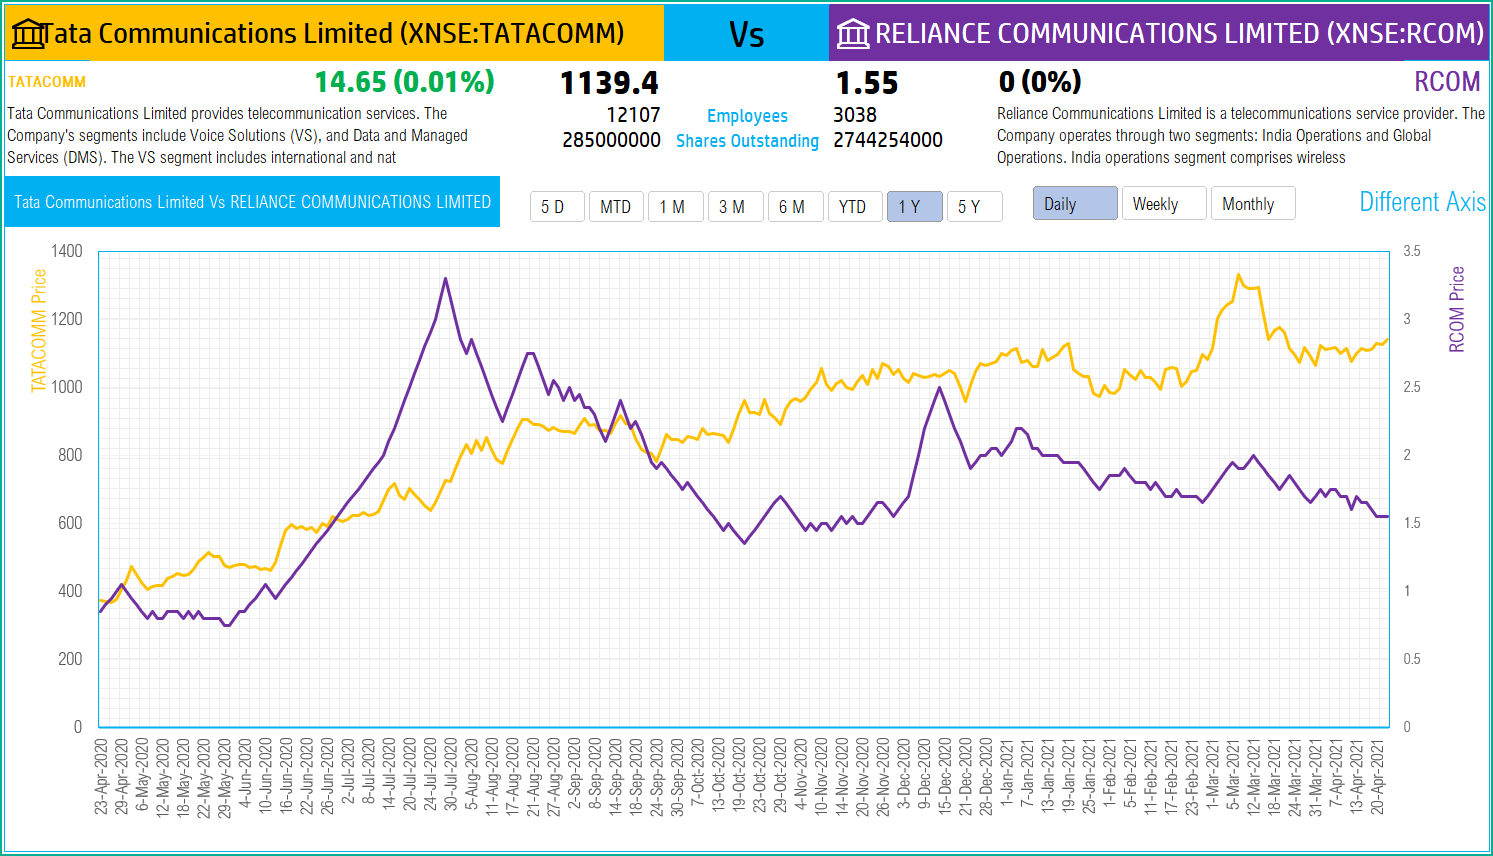
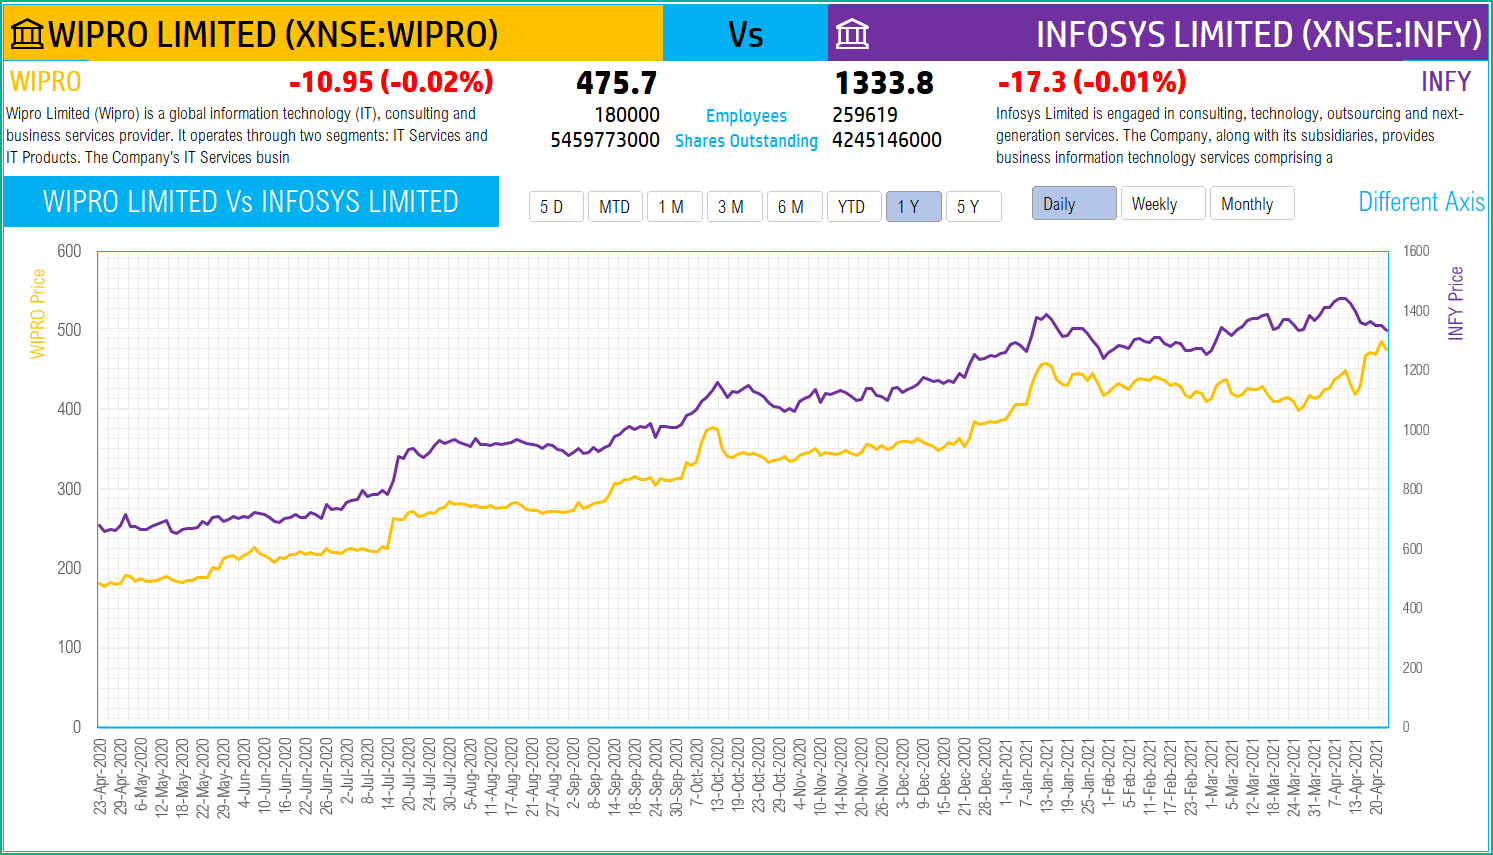
The template will work for non-US stocks as well. Here are some examples of Indian stocks.
Tata Communications vs Reliance Communications
Wipro vs Infosys
Requirements
To pull live Stock data from the services you would need Microsoft 365 Subscription Plans for PC and Web
All the templates in this series can be downloaded from indzara.com/stock-market-templates
-
 SMA Strategy Backtester Google Sheets Template$25
 -
 SMA Strategy Backtester Excel Template$25
 -
 RSI Strategy Backtester Google Sheets Template$25
 -
 RSI Strategy Backtester Excel Template$25
 -
 MACD Strategy Backtester Google Sheets Template$25
 -
 MACD Strategy Backtester Excel Template$25
 -
 Simple Moving Average Stock Screener Google Sheet Template$25
 -
 Stock Screener Excel Template$97
 -
 Simple Moving Average Stock Screener Excel Template$25

Feedback
Please share your feedback on this template in the Comments below. If you find this useful, please share with your friends who may benefit from this content.