


In this article, we will be discussing the US Stock Market Stock Screener Template that you can use to screen or find stocks based on certain criteria.
Features
The template has the following features built in.
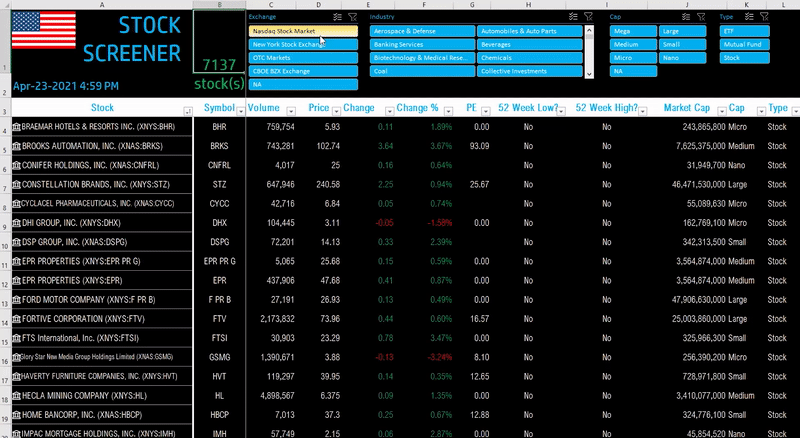
- 7000+ Stocks and ETFs in the Screener
- Filter by Exchange, Industry, Market Cap, Type (ETF vs Stock), 52 Week High and 52 Week Low
- Filter by Price, Change, Change %, Volume, PE
- Customize attributes on display
- Sort by attributes

Download
Video Demo

How to screen Stocks in Excel?
The template is very straight-forward to use. You can use the filters to apply certain criteria and the resulting stocks will appear in the table.

Attributes
The following attributes are displayed in the table for each Stock
- Ticker Symbol
- Volume
- Price
- Change
- Change %
- PE
- 52 Week Low (Yes/No)
- 52 Week High (Yes/No)
- Market Cap
- Market Cap Type
- Instrument Type
- Industry
- Exchange
There are also two columns that you can customize according to your preference.
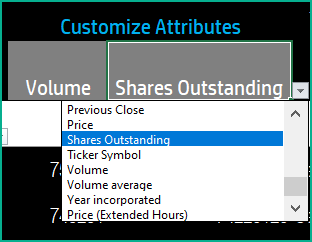
29 possible attributes are available in the drop-down. You can choose any to make that display. You may have to format the values in some cases as some are text, some are whole numbers and some are decimals.
Filters
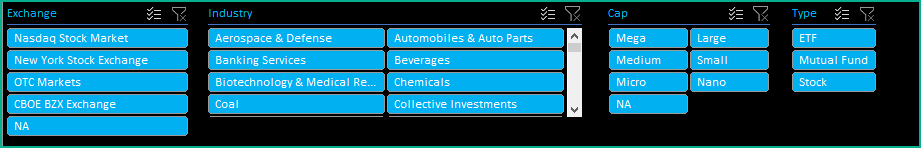
Exchange, Industry, Cap type and Instrument type are available to filter.
Market Cap Categories
Market Cap > $200B are labelled as Mega, $10B to $200B are labelled as Large, $2B to $10B are Medium, $300M to $2B are Small, $50M to $300M are Micro and less than $50M are Nano.
52 Week Highs or Lows
You can also use filters available to select stocks that have hit the 52 Week High or Low.

Clearing Filters
After applying filters, to clear it, click on the Clear Filter button on the top right of each slicer.
You can also use Excel’s native filtering to filter on numeric fields like Price, Volume and Change.
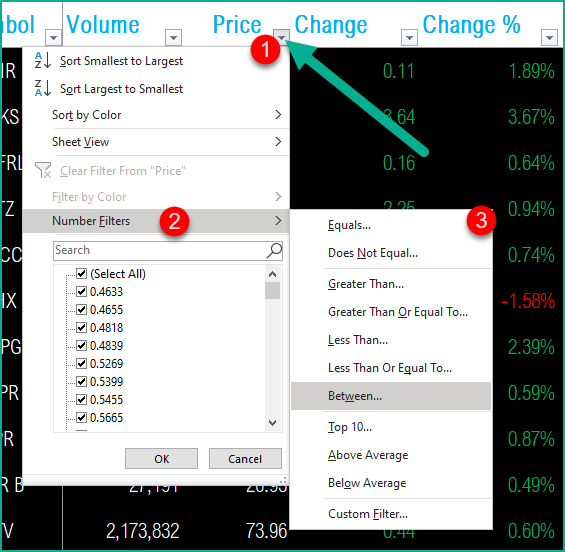
You can choose to filter stocks with price greater than $30, stocks between $45 and $200, stocks less than $100, etc.
When you apply multiple filters (whether using slicers or the table filters option), please note that all the conditions must be satisfied for the stock to appear in the table. The conditions are treated as AND conditions.
Sorting
We use Excel’s native Sorting feature to sort the stocks by criteria.
For example, you can sort by Volume to find the stocks that traded the most by volume (or most active).
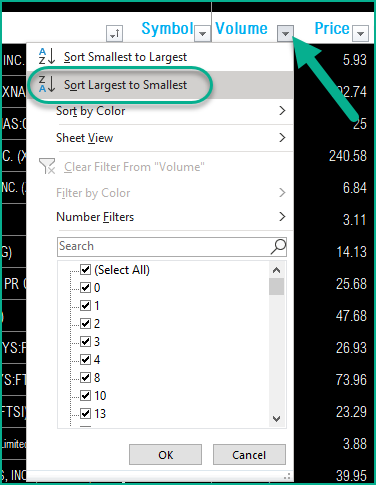
Just click on the little down arrow button next to Volume and choose Sort Largest to Smallest.
For another example, you can sort by Change % (descending) to find the stocks that gained the most by %.
How to refresh data?
If you have left Excel idle for a few minutes and would like to refresh the data, click on Refresh All in the Data ribbon.

How to add new stocks?
To add new stocks, please go to the last row of the table. Type a ticker symbol in the first column of next row.
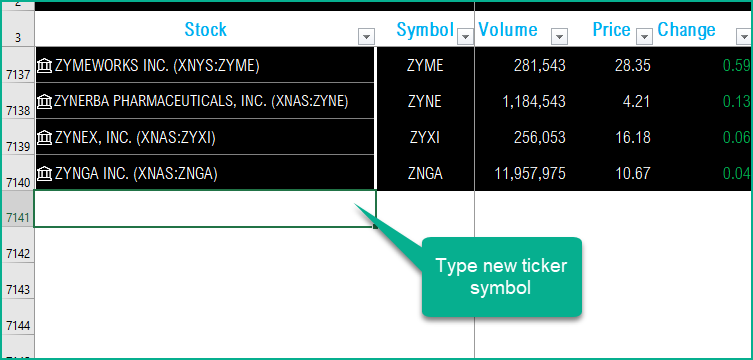
If Excel recognizes the stock symbol, it will auto-populate all the other columns in the row and no more action is needed.
If Excel does not recognize your stock symbol, it will pop up this data selector box.
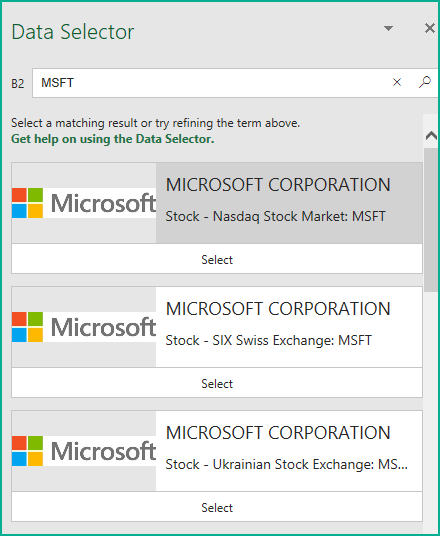
You can select the stock you are interested in.
No more changes are needed and from now, the new stock will be used for screening.
Requirements
To pull live Stock data from the services you would need Microsoft 365 Subscription Plans for PC and Web
All the templates in this series can be downloaded from indzara.com/stock-market-templates
-
 SMA Strategy Backtester Google Sheets Template$25
 -
 SMA Strategy Backtester Excel Template$25
 -
 RSI Strategy Backtester Google Sheets Template$25
 -
 RSI Strategy Backtester Excel Template$25
 -
 MACD Strategy Backtester Google Sheets Template$25
 -
 MACD Strategy Backtester Excel Template$25
 -
 Simple Moving Average Stock Screener Google Sheet Template$25
 -
 Stock Screener Excel Template$97
 -
 Simple Moving Average Stock Screener Excel Template$25

Feedback
Please share your feedback on this template in the Comments below. If you find this useful, please share with your friends who may benefit from this content.