
In this article, we will cover the overview of how to use the Project Manager Excel Template. Then, we will use a simple project to illustrate how to use the template.
SIMPLE OVERVIEW OF INSTRUCTIONS
PLANNING
- Enter basic inputs in SETTINGS
- Enter task details in TASKS
- Review Baseline Plan summary in PROJECT_REPORT
- Take action to improve plan if needed (use TASK REPORT, RESOURCE REPORT, TASK SCHEDULE)
- Finalize Baseline plan
MANAGEMENT (when project work actually begins)
- Enter actual work performed in ACTUALS
- If work estimate for tasks change, update TASKS input
- View Project and Resource Reports to monitor project progress
- Share reports with project members and stakeholders
- Take action to address delays if any (use TASK REPORT, RESOURCE REPORT, TASK SCHEDULE)
- Save/Share final report when project closes
SAMPLE PROJECT – DEMO
In this section, we will be using a sample project to demo how to use the template.
PLANNING
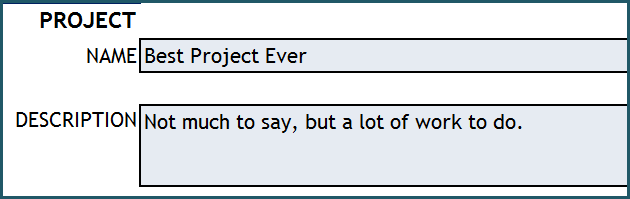
Let us imagine that today is Feb 15th, 2016. We are ready to plan our project. We will begin by entering Project Name and Project description.
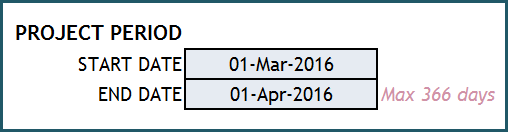
We want to work on this project beginning March 1, 2016. Let’s enter Project Period. The template can handle a period of up to 1 year.
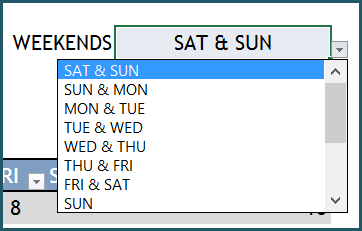
Then, we will choose SAT & SUN as weekends. The weekend days will be highlighted on the Gantt Chart that we will see later.
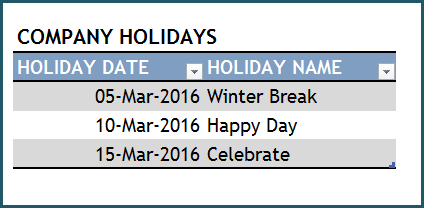
Let us enter 3 holidays that we are going to have during our project. Work will not be scheduled by the template during these days.
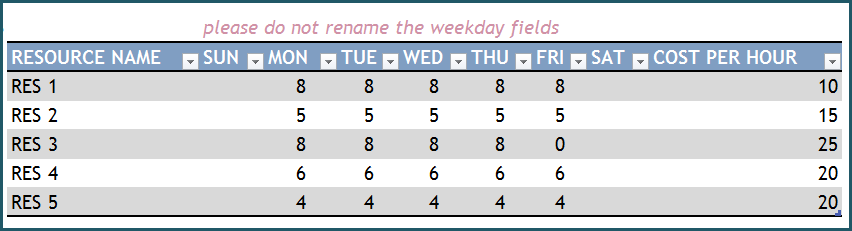
It’s time to enter resources. We have 5 resources or employees that are available to work on the project. So, we will enter their standard availability by weekday. We will also enter their hourly rate.
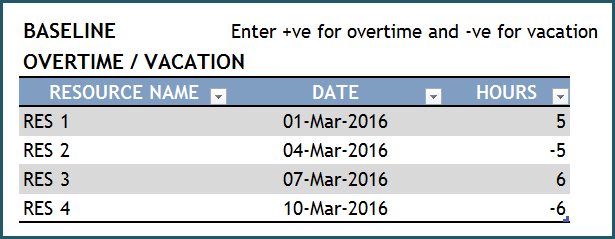
To wrap up the resource availability information, we will enter details on vacation/overtime to be taken by our resources. Vacation will be entered as negative values while Overtime will be positive values.
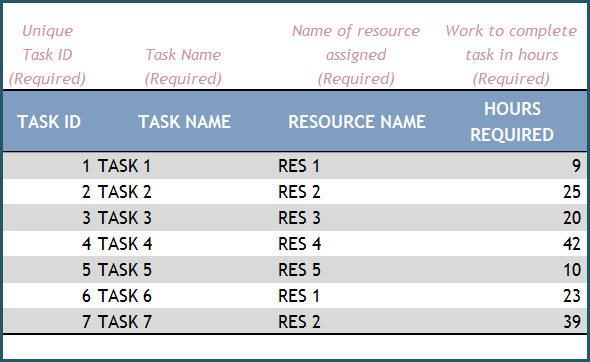
We are ready to move on and enter the tasks in the TASKS sheet. We have 7 tasks in our project. Required information here are the TASK ID, TASK NAME, RESOURCE NAME and HOURS REQUIRED.
If tasks have any constraints on start dates, we can enter the TASK PREFERRED START DATE. The template, while scheduling the work will follow this constraint and will not schedule any work for a task prior to the TASK PREFERRED START DATE. Similarly, if there is a preferred end date, we can enter that too. The template cannot guarantee that the work will be completed by that date. However, it will highlight if tasks will not complete by TASK PREFERRED END DATE.
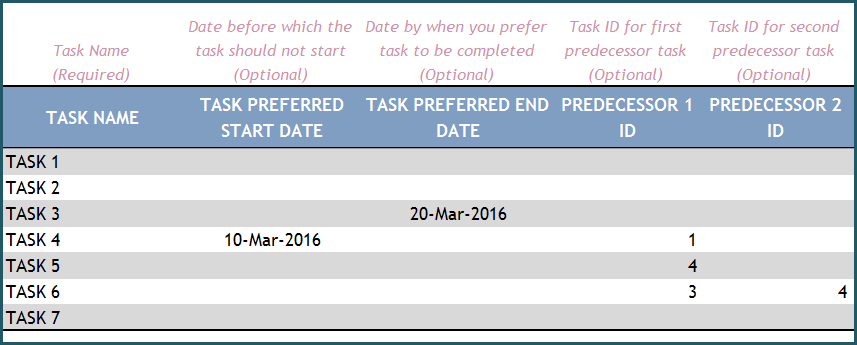
Most often tasks are dependent on completion of other tasks. We can establish dependency using the two columns (PREDECESSOR 1 and PREDECESSOR 2). We will enter the TASK ID of the predecessors.
Now that we have entered the necessary input, let’s jump to the PROJECT_REPORT sheet to see how our project plan looks.
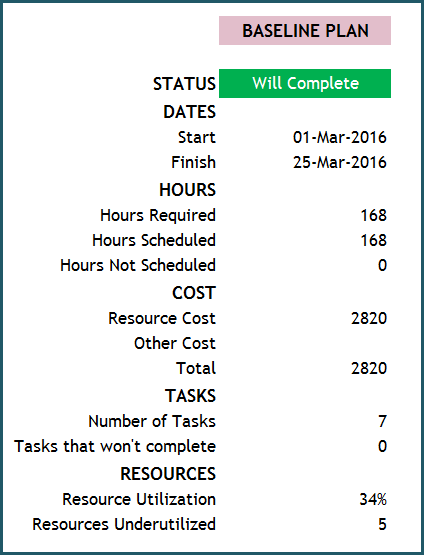
We can see that the project will complete during our project period. It will start on Mar 1st and finish on Mar 25th. Total work effort is 168 hours, costing resource cost of 2820. Resource utilization is 34%.
Let’s say we are happy with the plan and so we submit to our leadership or sponsors for approval. After it is approved, we are ready to begin actual project work on March 1st. This completes the Planning Stage.
MANAGEMENT
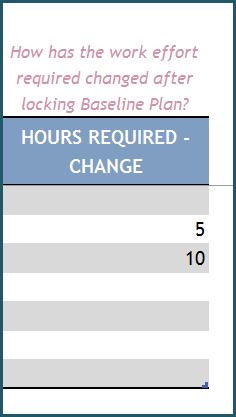
Let’s fast forward time. March 1st arrives and we begin the project work. As we are about to begin, we realize that our original work estimates for a couple of tasks were incorrect. So, we go to the TASKS sheet and enter the HOURS REQUIRED – CHANGE field. This will not impact our baseline plan, but will impact our current plan.
To see what work needs to be done for the next seven days, we can view the TASK_SCHEDULE sheet.
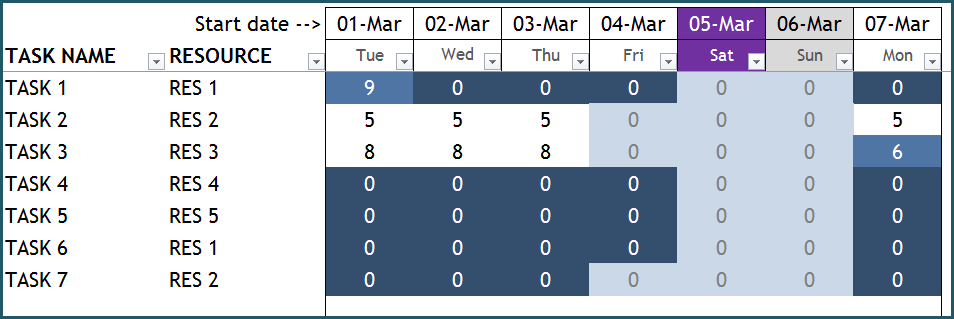
If we enter March 1st in the first cell, then we can see how many hours of work need to be performed for each task for the next 7 days.
We begin work on March 1st and, at the end of the day, we enter the work performed on that day. We do the same on March 2nd as well. The data is entered in the ACTUALS sheet as shown below.
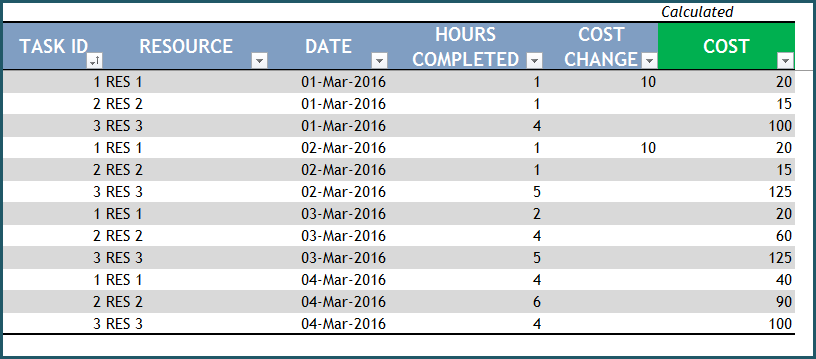
Please note that the task can be performed by a resource other than the one originally assigned in the baseline plan. Also, more than one resource can perform actual work (planning is limited to one resource per task).
Cost is automatically calculated based on cost per hour of the resource that worked on the task. If additional or less cost was incurred for any work performed, we can enter that in the COST CHANGE field. COST field will include that additional cost.
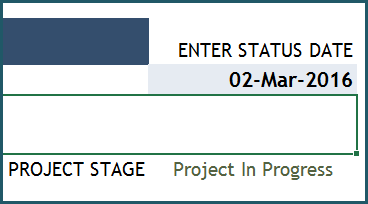
After entering actual work performed, it’s time to check how we are progressing towards our project goal. Let’s switch to the PROJECT_REPORT sheet. Enter Mar 2nd as the STATUS DATE.
We can view the summary of baseline and current plans.
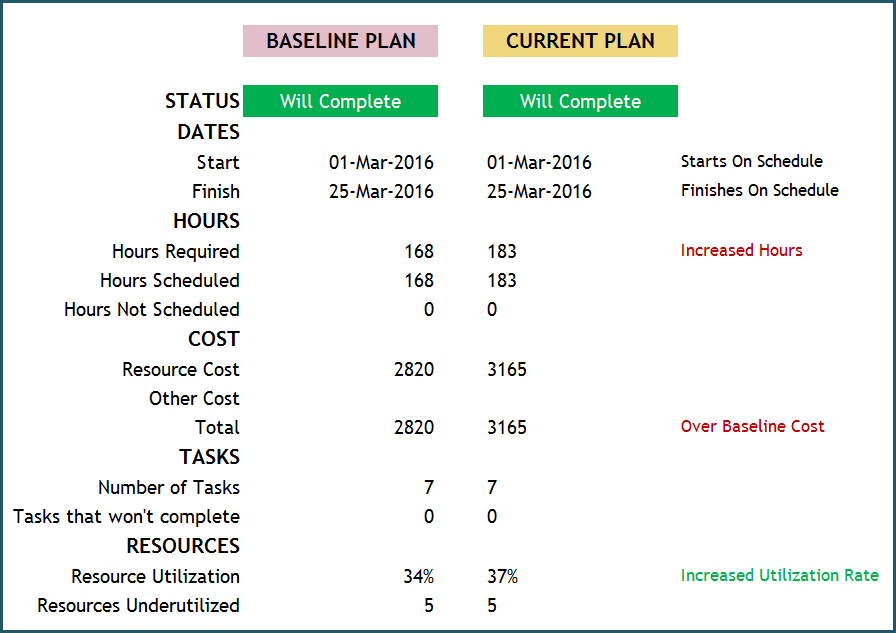
We can see that we have increased hours of work to do (and thus the cost) in the current plan Vs baseline plan. However, the current plan will still finish on schedule due to the increased utilization rate.
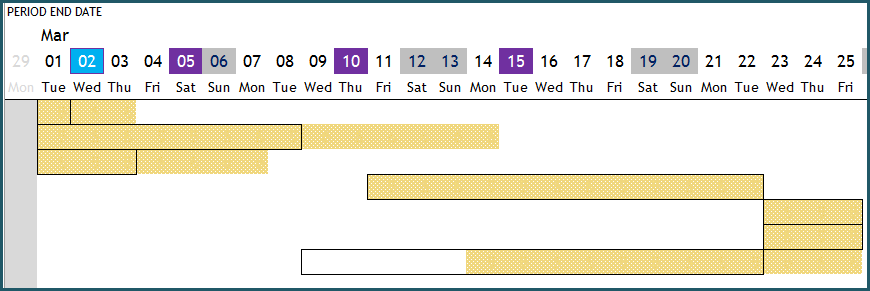
We can see the progress visually on the Gantt Chart.
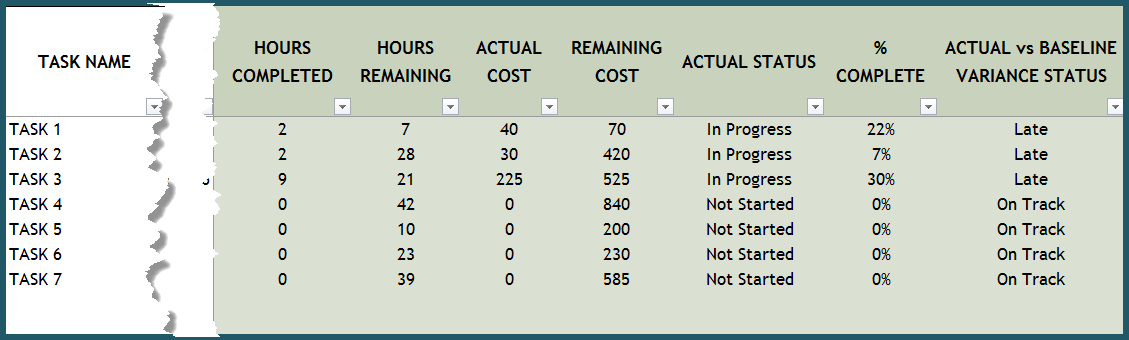
In the TASK_REPORT, We can see individual tasks to identify if any are late (compared to baseline). We can also view the % Complete (Actual hours completed/total hours planned in current plan).
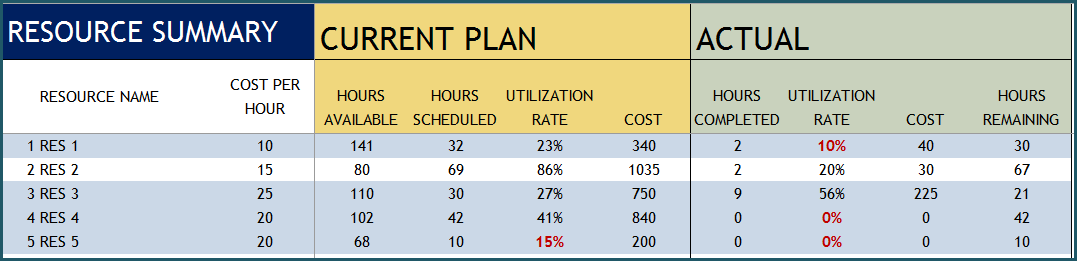
Resource Report will present the resource side of performance measures.
This is how we can monitor the project progress. As we input actual work performed and update status date, the reports will reflect the new data input.
That’s how simple it is to use the template. It does have a lot of features and lot of access to relevant data about the project. I have tried to balance the need for transparent useful data Vs simplicity in operation. I look forward to your feedback.