


In this article, we will be discussing the India Market – Industry Analyzer template that you can use to analyze stocks.
The template can assist in
- Analysis of the stocks across any two measures (out of 16 measures available) – for example, Price and Market Cap, Trading Volume and Price – in a scatter plot
- Analysis of stocks in any specific industry – for example, Telecommunications industry, Pharmaceuticals industry, etc.
- Comparing two or more specific stocks across various measures
Download
Video Demo

How to analyze stocks by Market/Industry?
The template automatically creates a scatter plot of 1663 stocks in the India Stock market, across two measures. The user has the following input controls to customize the chart.
There are six input controls available.
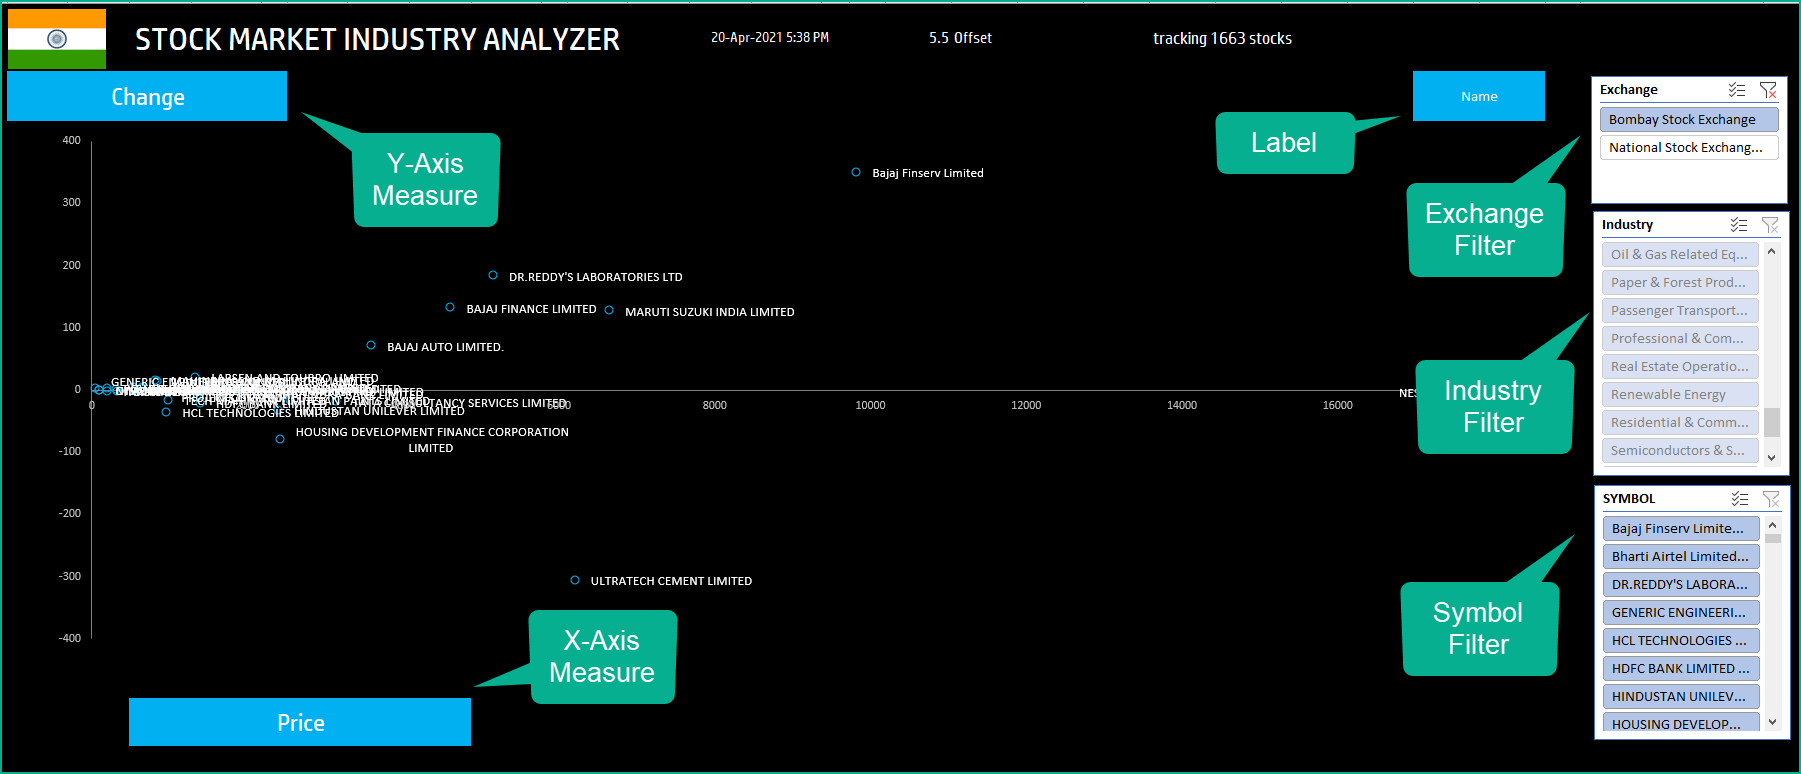
X Axis Measure
Y Axis Measure
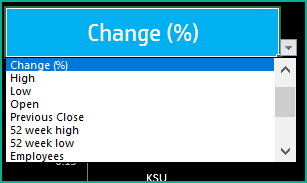
The following 16 measures are available for analysis.
- Price
- Change
- Change (%)
- High
- Low
- Open
- Previous Close
- 52 week high
- 52 week low
- Employees
- Market cap
- P/E
- Beta
- Shares Outstanding
- Volume
- Volume average
Label
Toggle between Ticker Symbol and Name of the Stock)
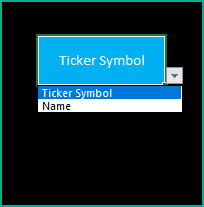
When you have a lot of stocks in the chart, the ticker symbol will be better to use as it will be less cluttered on the chart. When you have only a few stocks to analyze, the Name option is better as it clearly displays the company name. If you know your ticker symbols very well, then you can stick with the Ticker Symbol itself.
Exchange filter
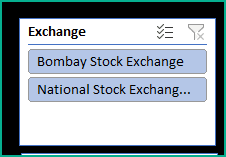
You can filter to specific exchange(s) if you would like.
Industry filter
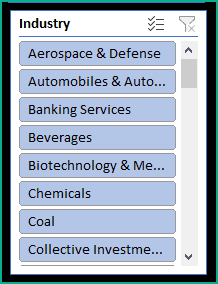
You can select one or multiple industries for analysis
Ticker Symbol filter

Finally, you can choose one or multiple stock ticker symbols.
Timezone

On the top right you can see the maximum of the last trade time of these currencies.
The default time that Microsoft provides is UTC. The offset is set to 5.5 hours, to convert to Indian Standard Time zone.
You can modify this if you need the time in a different time zone.
Visit https://savvytime.com/converter/utc to view offset
How to refresh data?

Sample Analysis
Just use various combinations of these inputs to analyze the stocks according to your needs. Here are some samples of what can be done using this template.
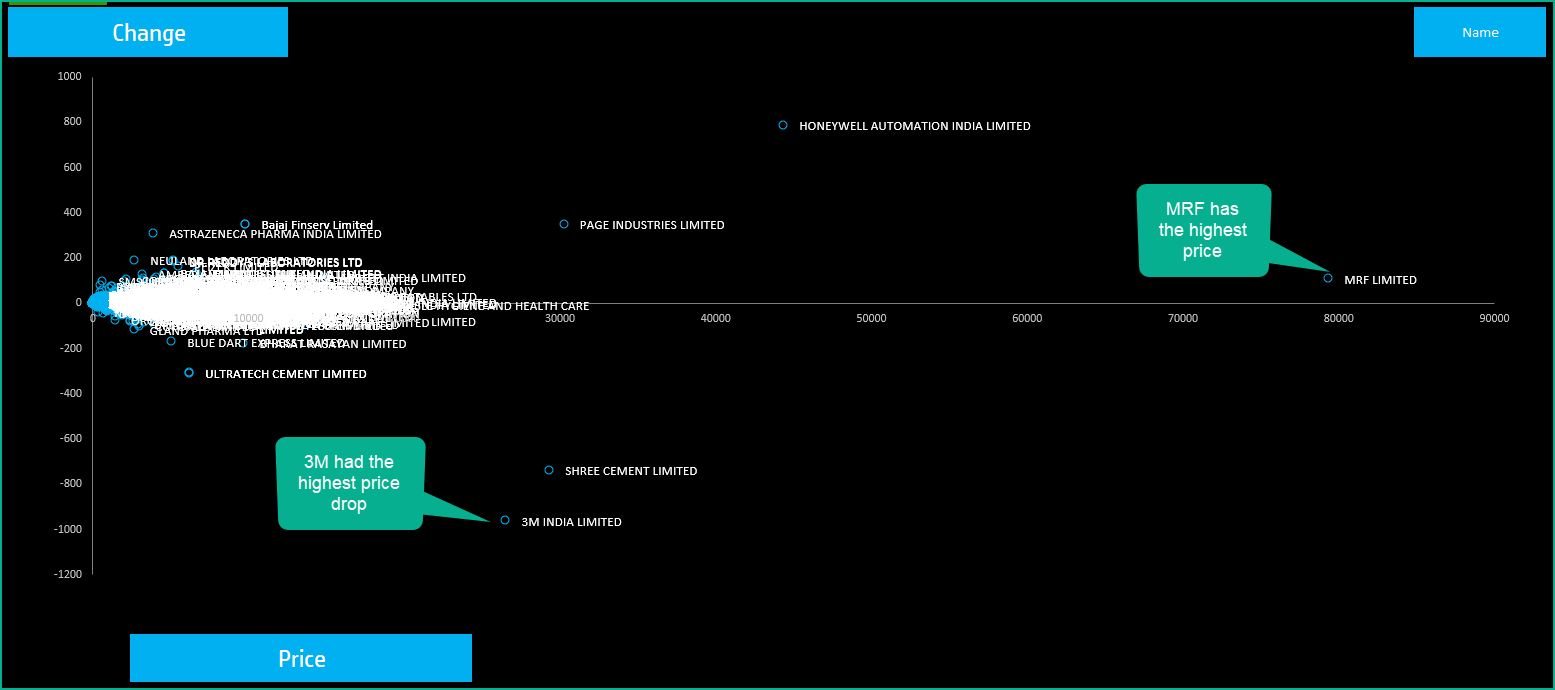
- Of all 1663 stocks, Price vs Change
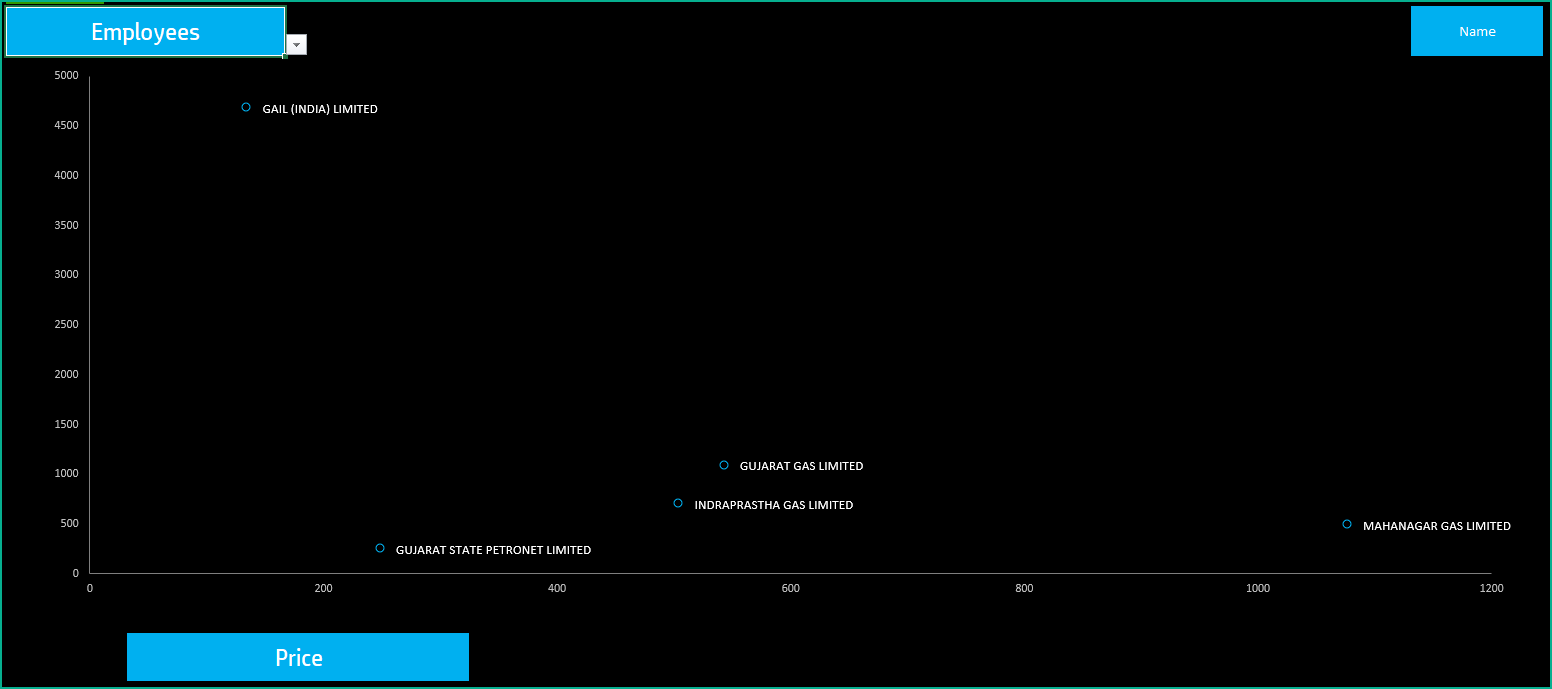
- Natural Gas Utilities industry – Price vs Employees
- Oil & Gas industry – Market Cap vs Employees

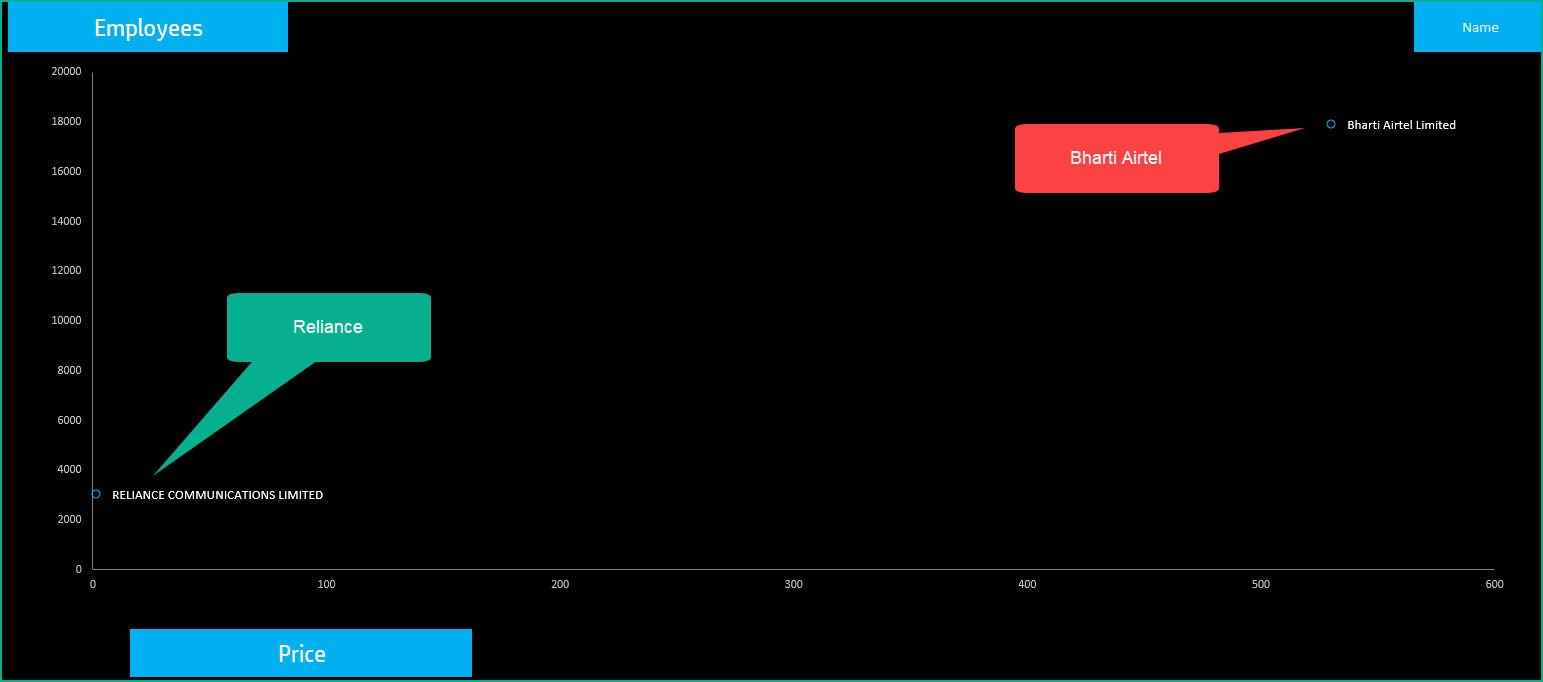
- Reliance and Airtel – Price vs Employees
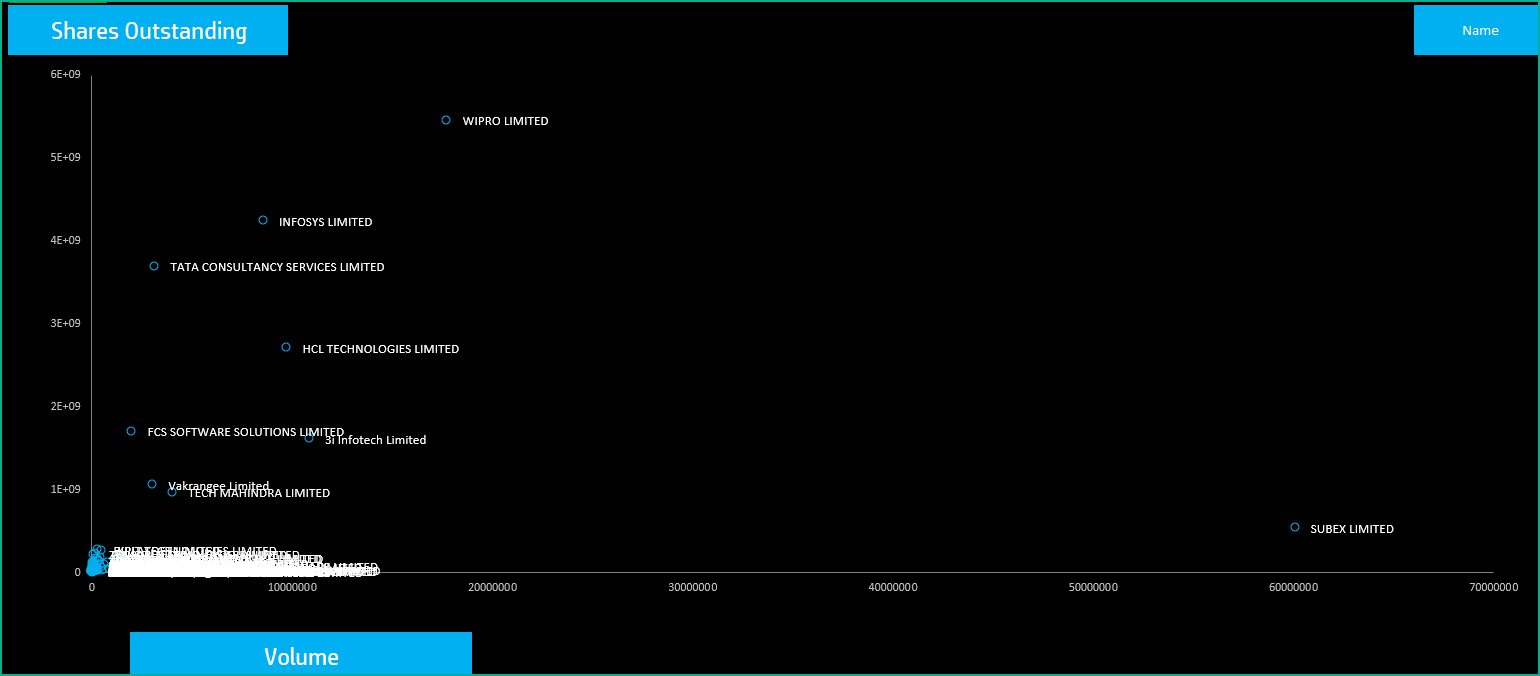
- Software industry stocks – Volume vs Shares Outstanding
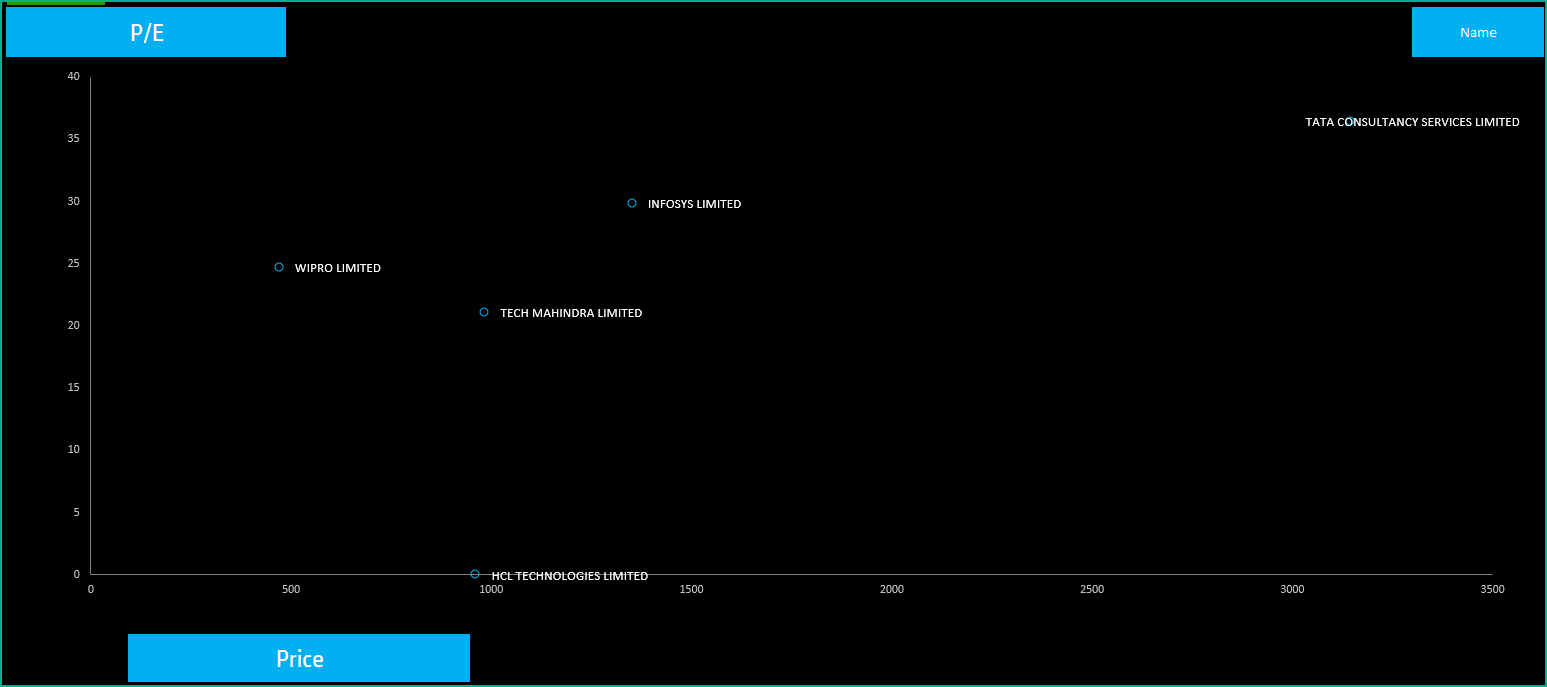
- Specific Software industry stocks – Price vs P/E
Requirements
To pull live Stock data from the services you would need Microsoft 365 Subscription Plans for PC and Web
How to add a new stock?
The 1663 of the stocks or the ticker symbols in the NSE and BSE exchanges are included. There are a few that are not in the template since the market data is not available in the Excel service.
You can also add your own stocks and I will explain how that can be done easily.
Unhide the hidden DATA sheet and follow this simple two-step process to add new stocks to analyze.
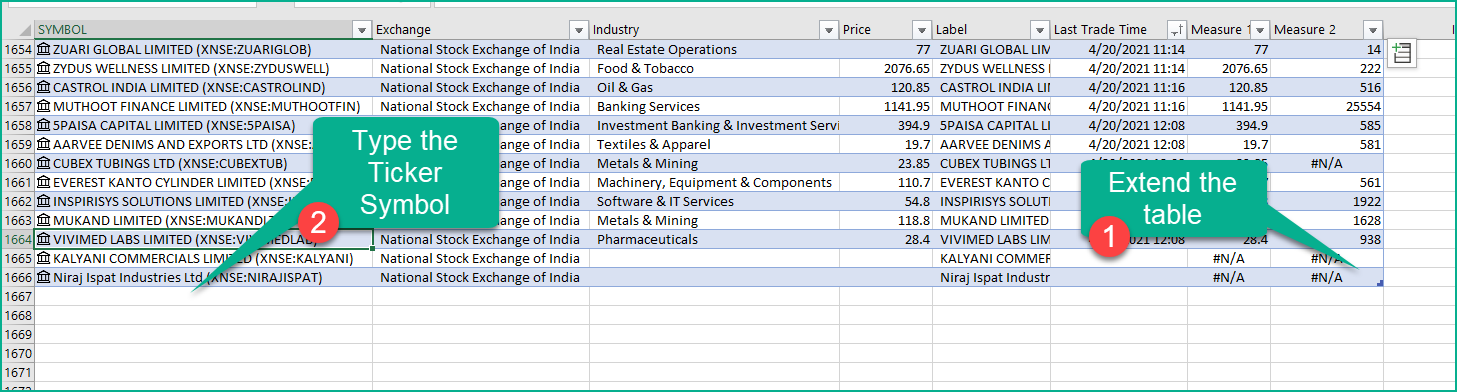
- Extend the table to more rows as needed
- Enter stock symbol
If Excel does not recognize your stock symbol, it will pop up this data selector box.
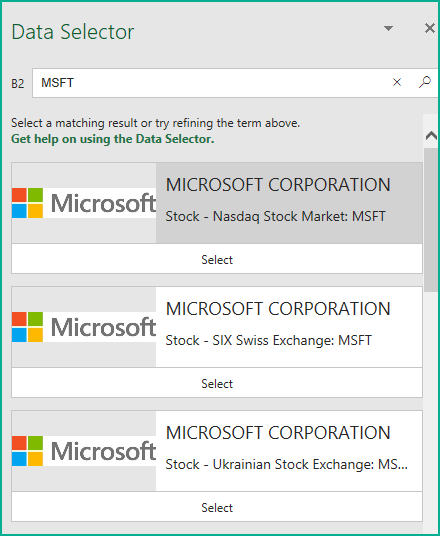
You can select the stock you are interested in.
For more templates in this series, please visit indzara.com/stock-market-templates
-
 SMA Strategy Backtester Google Sheets Template$25
 -
 SMA Strategy Backtester Excel Template$25
 -
 RSI Strategy Backtester Google Sheets Template$25
 -
 RSI Strategy Backtester Excel Template$25
 -
 MACD Strategy Backtester Google Sheets Template$25
 -
 MACD Strategy Backtester Excel Template$25
 -
 Simple Moving Average Stock Screener Google Sheet Template$25
 -
 Stock Screener Excel Template$97
 -
 Simple Moving Average Stock Screener Excel Template$25

Feedback
Please share your feedback on this template in the Comments below. If you find this useful, please share with your friends who may benefit from this content.