


You can use this template to view price history of a Stock.
In this article, I will go over the following.
- Stock Price chart template and its features
- Introduction to the StockHistory function
Download
Video Demo

Template features
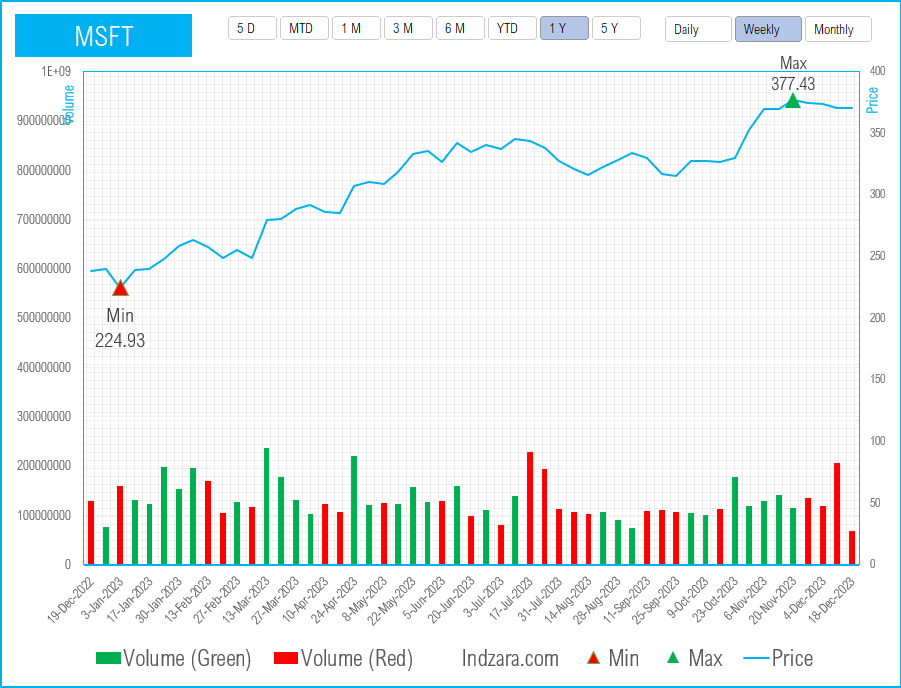
A very important visual in the area of stock markets is the price chart of a stock.
The template allows
- Entering a stock ticker symbol to pull in up to 5 years of price history
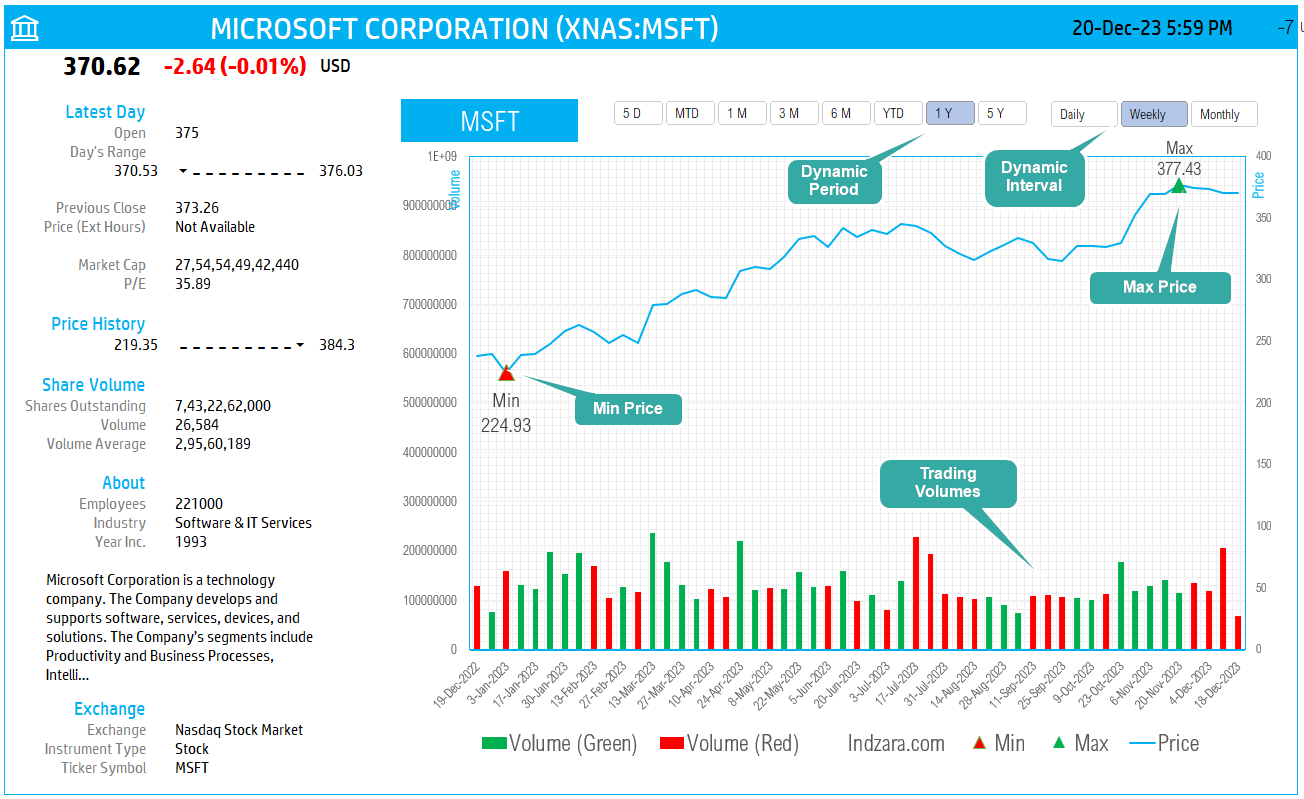
- Allows controlling the period displayed on the chart (5 days, Month To date, 3 Months, 6 Months, etc.)
- Allows controlling the interval of price data – Daily, Weekly or Monthly
- Automatically identifying the max and min price points on the chart based on your period range and interval choices
- Shows the volume of trading daily with green color bars for periods when closing price was greater than previous period’s closing price and red bars when closing price was less than previous period’s closing price.
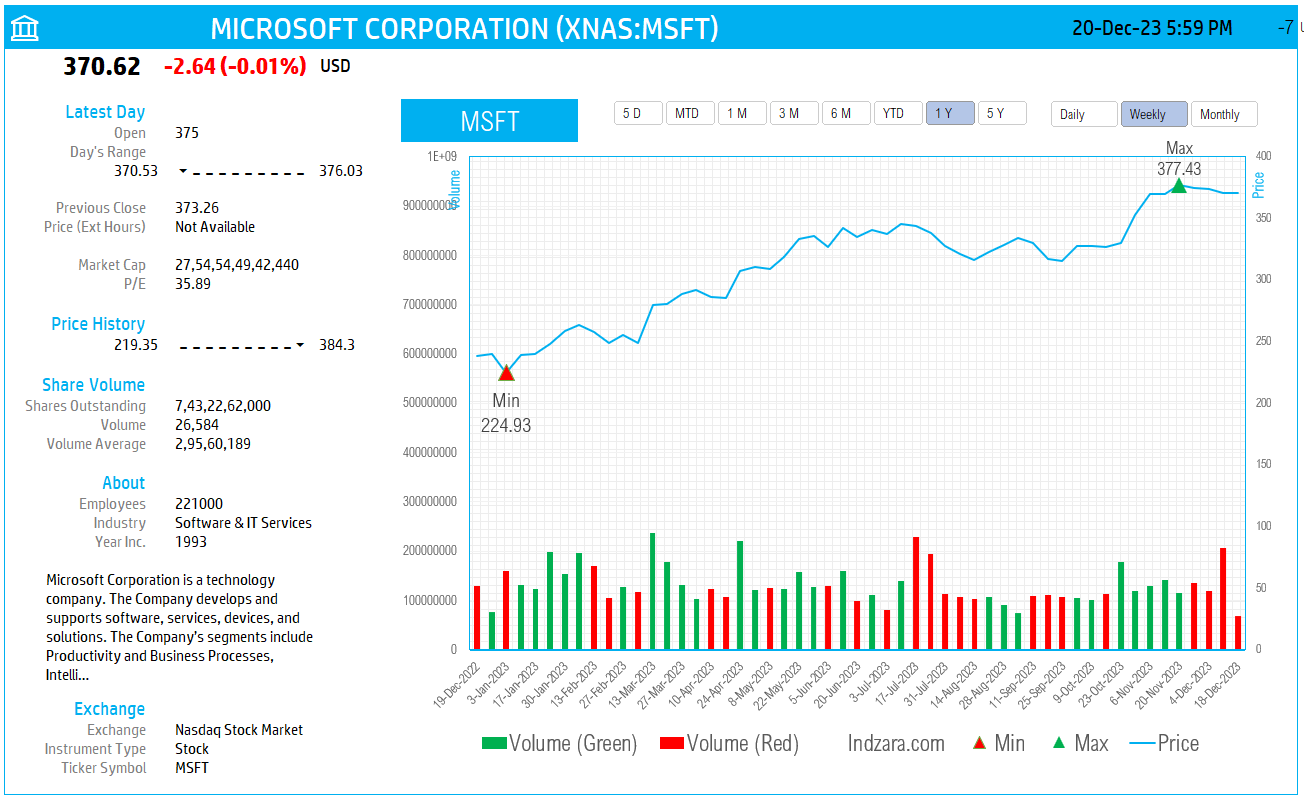
You can change the Ticker symbol and immediately view the price chart for a stock.
How to build a stock price chart in Excel
Type in a stock sticker symbol. If Excel does not recognize your stock symbol, it will pop up this data selector box.
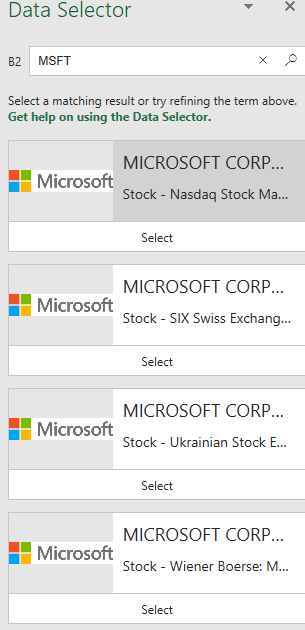
You can select the stock you are interested in.
Period
The template can pull up to 5 years of price history by default. You can choose how much history to display on the chart easily using the slicer buttons.
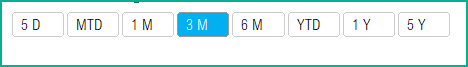
The options are 5 Days, Month Till Date, 1 Month, 3 Months, 6 Months, Year Till Date, 1 Year, 5 Years.
Interval
The template allows price history at 3 different intervals.
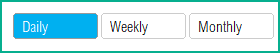
Daily/Weekly/Monthly are the options.
About StockHistory Function in Excel
The foundation of this is the StockHistory function.
The function uses the following syntax.
=STOCKHISTORY(stock, start_date, [end_date], [interval], [headers], [property0], [property1], [property2], [property3], [property4], [property5])
Please visit Microsoft’s knowledge base article on Stockhistory function here.
Stock is the stock or the ticker for which we want to retrieve the history.
Start date and End Date are the date ranges for which we want to see the history.
Interval is the interval of the price history. The options are 0 (daily), 1 (weekly) or 2 (monthly). This allows us to pull the data daily, weekly or monthly.
Header can be toggled on or off. If you would like to not display the headers, choose accordingly.
Property available are 0 = Date, 1 = Close, 2 = Open, 3 = High, 4 = Low, and 5 = Volume.
We can choose the 6 properties in any order we like.
If you are new to Stocks Data type in Excel, please visit Stocks Data Type in Excel
Here is the link to the article from Microsoft which shows which exchanges are available and the delay in data refresh for each.
How to refresh?
To refresh the price and other information, just use the regular Excel refresh in the Data ribbon.

Requirements
Microsoft has introduced a new feature in Excel called Data types. One of the data types is ‘Stocks’. That’s what we will be using for these templates.
This feature is available in Microsoft 365 plans.
For all the templates in this ‘Excel for Stock Market’ series, please visit indzara.com/stock-market-templates
-
 SMA Strategy Backtester Google Sheets Template$25
 -
 SMA Strategy Backtester Excel Template$25
 -
 RSI Strategy Backtester Google Sheets Template$25
 -
 RSI Strategy Backtester Excel Template$25
 -
 MACD Strategy Backtester Google Sheets Template$25
 -
 MACD Strategy Backtester Excel Template$25
 -
 Simple Moving Average Stock Screener Google Sheet Template$25
 -
 Stock Screener Excel Template$97
 -
 Simple Moving Average Stock Screener Excel Template$25

Feedback
Please share your experience. I expect this to be different with different exchanges and countries. Is it working for you? Is it working differently? I would love to hear from you.