Description
Welcome to the Data Visualization Toolkit by Indzara
Our intent for this toolkit is to empower you with the essential tools to create impactful visuals using Microsoft Excel for swift and informed decision-making.
This toolkit is designed to streamline the visualization process for busy professionals, who require a simple and efficient method for chart creation amidst their time constraints.
Introducing the Instant Chart Maker: Your Ultimate Charting Solution!!
Say goodbye to the hassle of chart creation with our Instant Chart Maker – your go-to resource for all your charting requirements. What is so unique about our chart maker template? Read along as we give you detailed, and compelling reasons to buy!
👉🏼 Instant Charts: Instant and Effortless Visualization at Your Fingertips
Gone are the days of painstakingly crafting charts from scratch. With our Instant Chart Maker, you can generate professional-grade charts in seconds. Simply input your data, and watch as our intuitive tool transforms it into visually stunning charts.
Need to tweak the data? No problem. Our flexible interface allows you to adjust data points on the fly, ensuring your charts accurately reflect your insights.
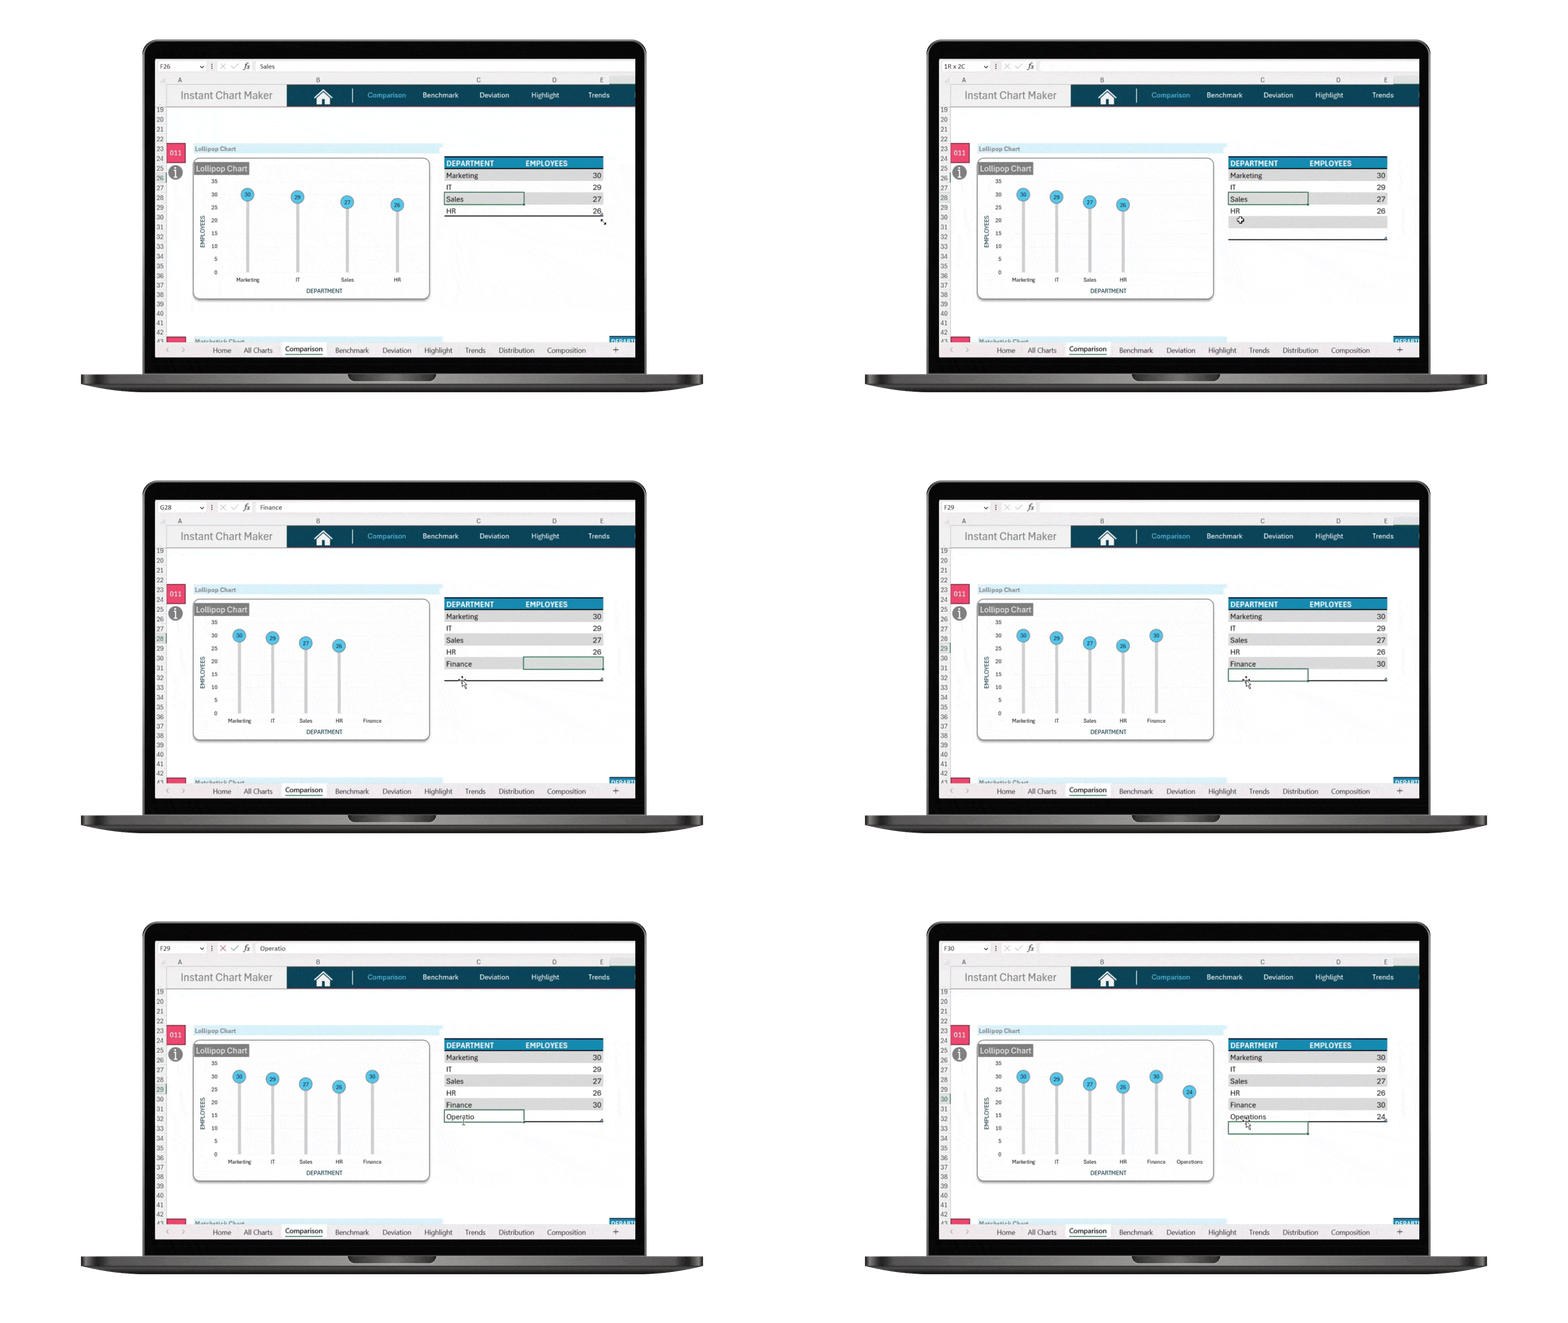
Seamless Integration for Maximum Efficiency
Whether you’re preparing a PowerPoint presentation or composing an email, our Instant Chart Maker seamlessly integrates with your workflow. With the ability to copy chart images directly, you can effortlessly incorporate visuals into your narrative.
👉🏼 A One-Stop Shop: Your Comprehensive Charts Repository
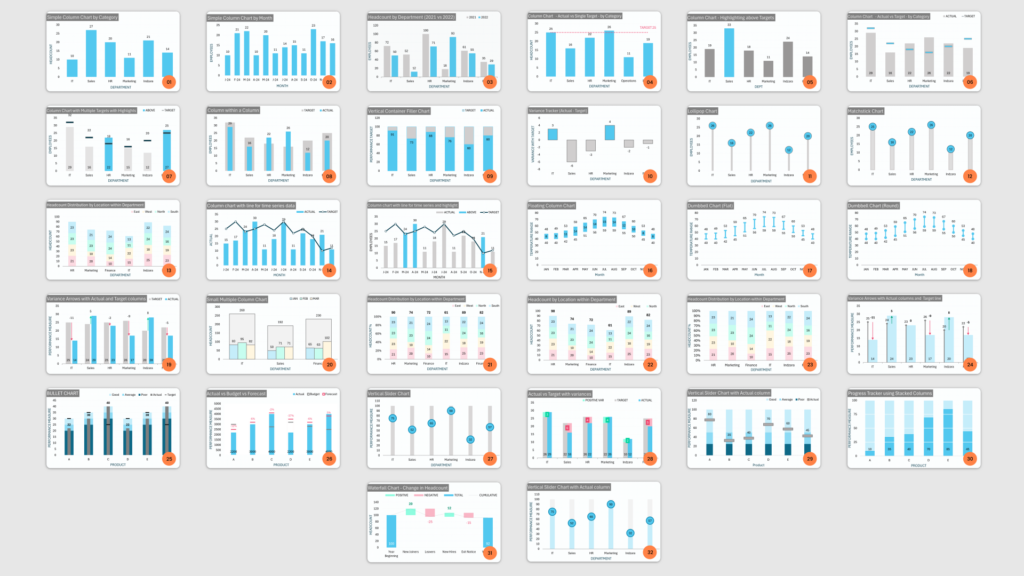
Forget scouring the internet for individual charts. With our Instant Chart Maker, we’ve compiled a comprehensive library of 32 charts – and counting – all conveniently housed in one file.
Say goodbye to endless Google searches and wasted time. Our curated selection covers a diverse range of chart types, ensuring you’ll find the perfect visualization for every scenario.
And the best part? We’re constantly expanding our repertoire, adding new charts every month.
Can’t find what you’re looking for? Simply drop us an email, and we’ll gladly accommodate your request.
👉🏼 Ideas: Spark Inspiration for Your Data
Unlock a treasure trove of creativity with our Instant Chart Maker. Explore a myriad of visualization ideas curated to inspire and elevate your data presentations.
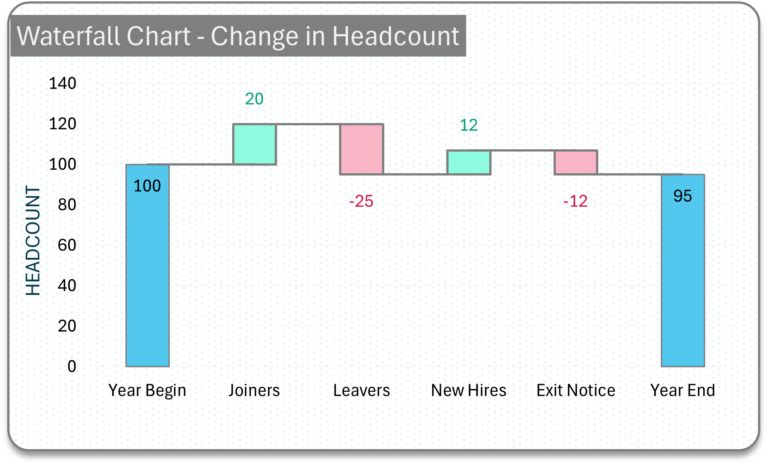
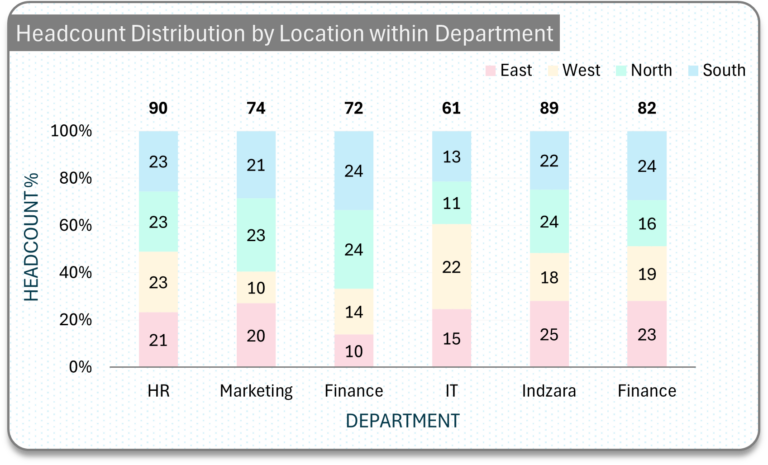
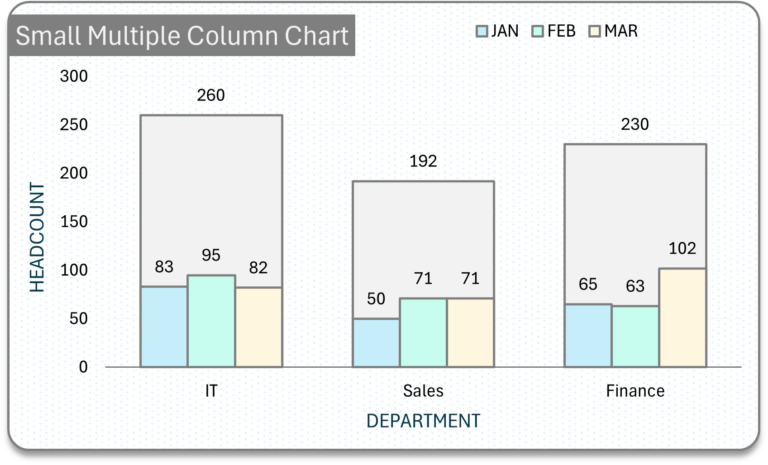
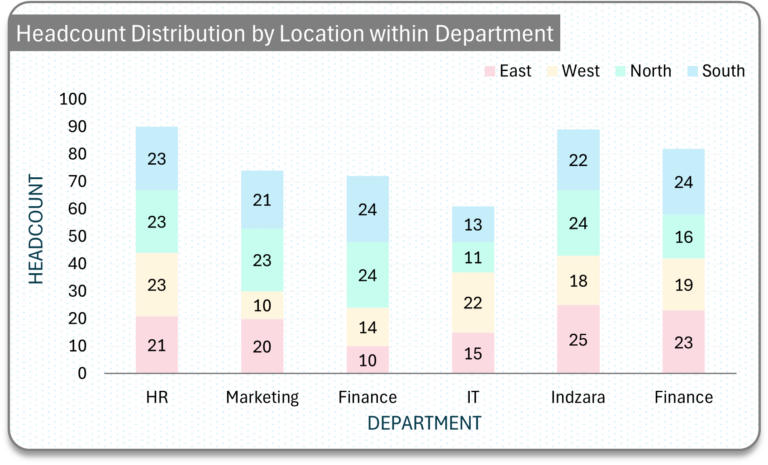
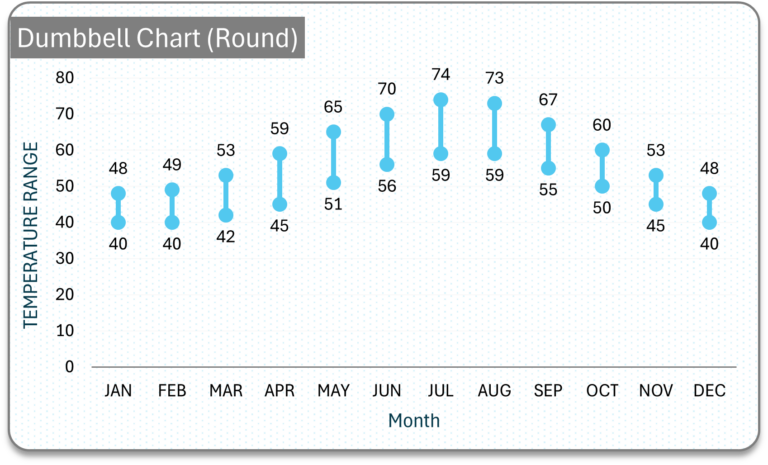
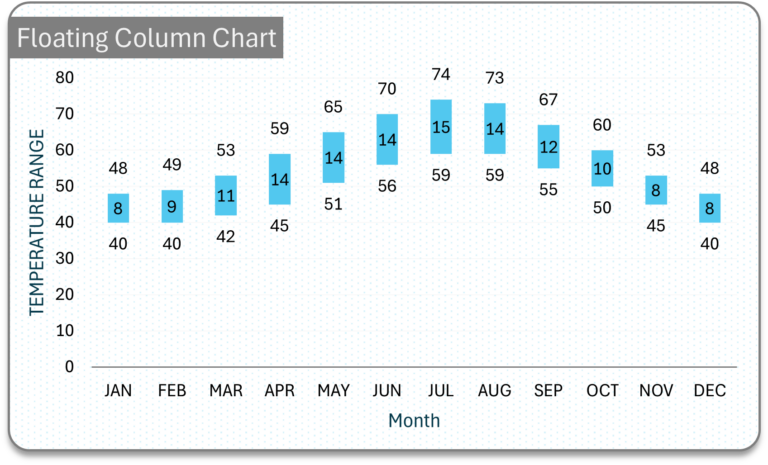
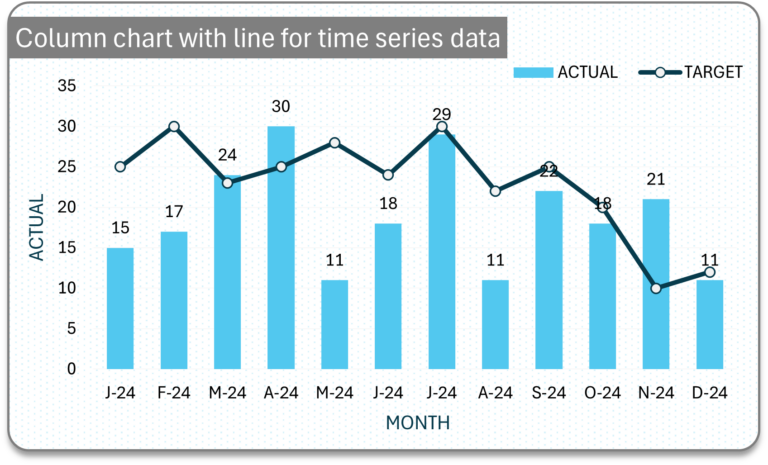
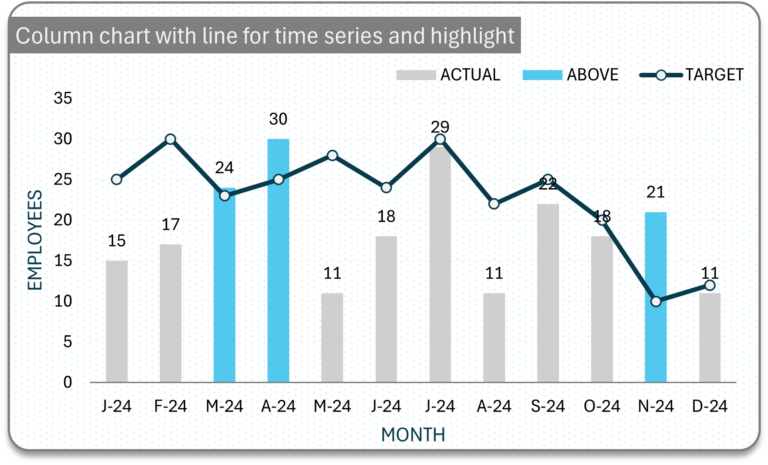
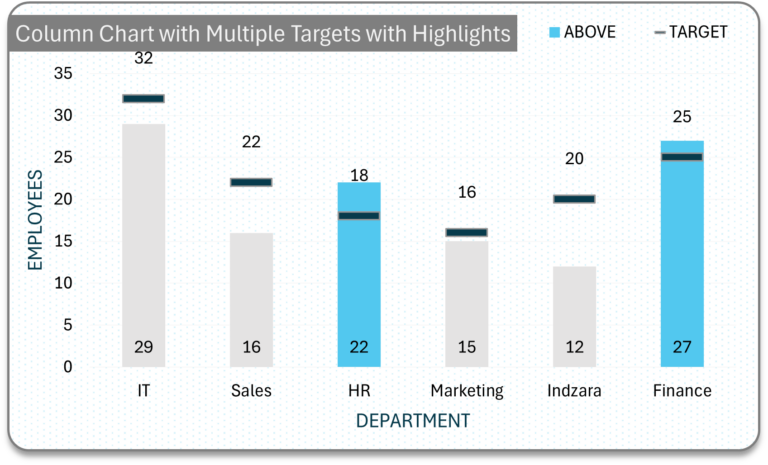
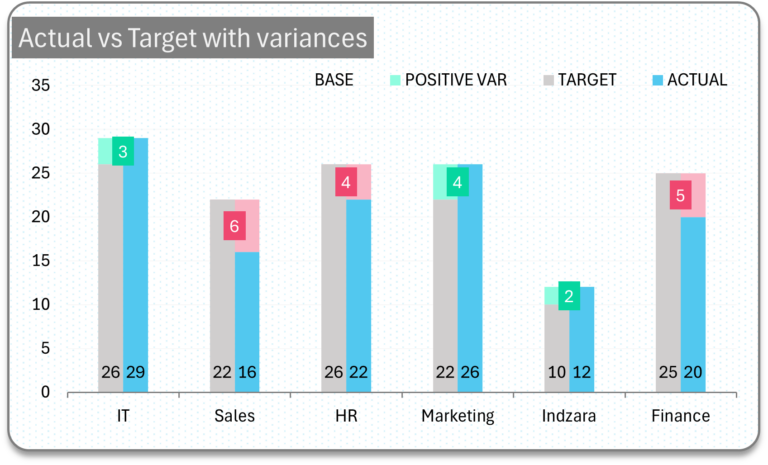
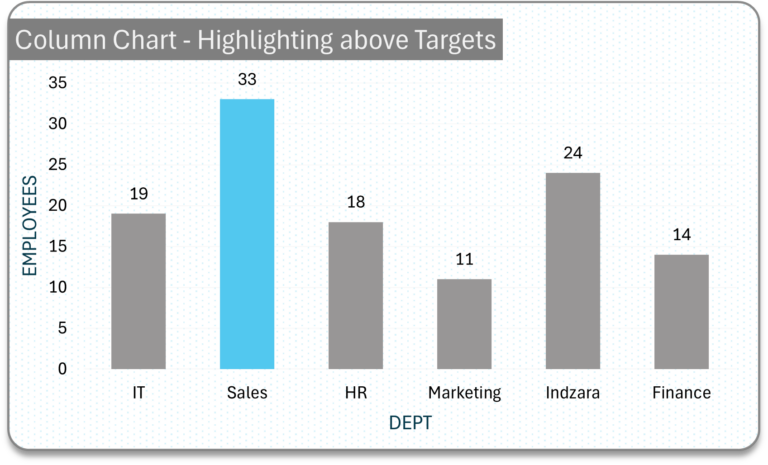
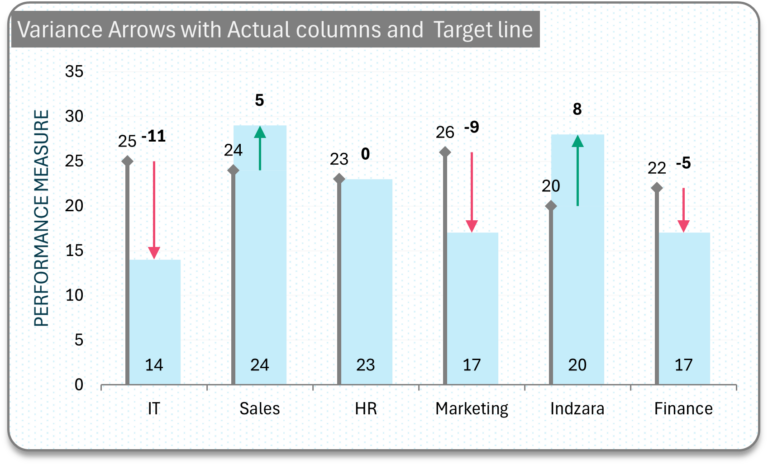
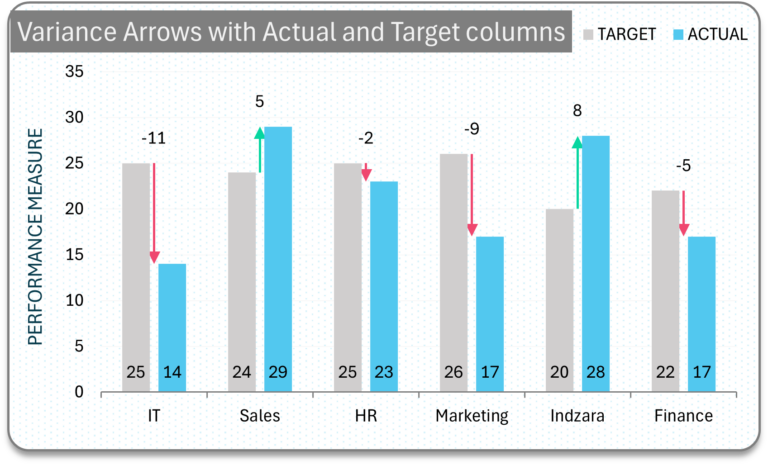
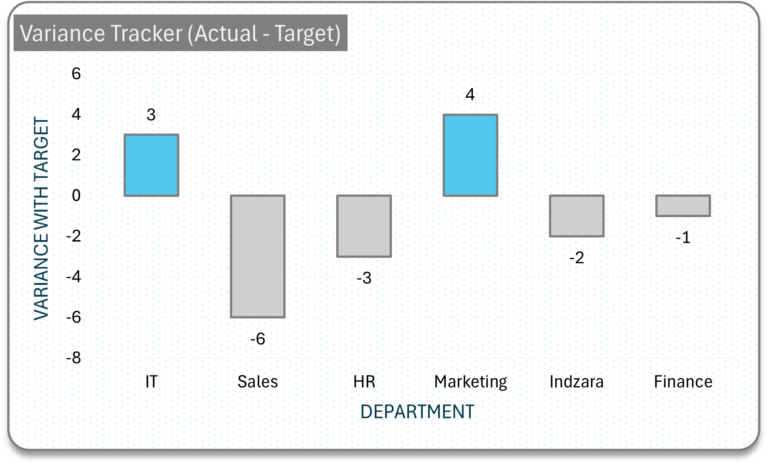
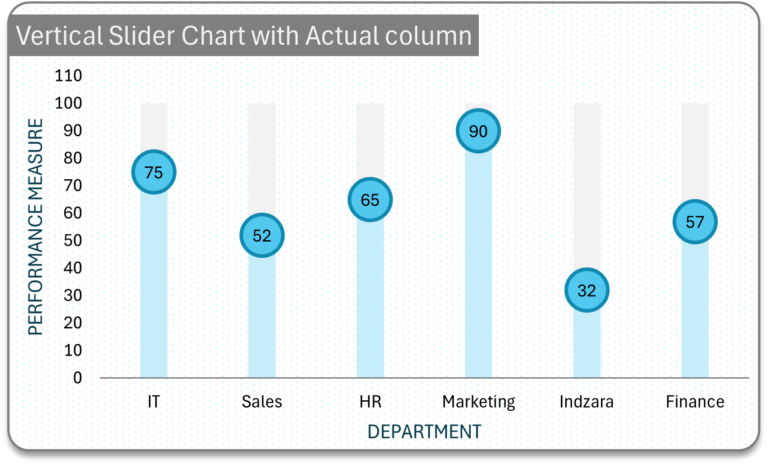
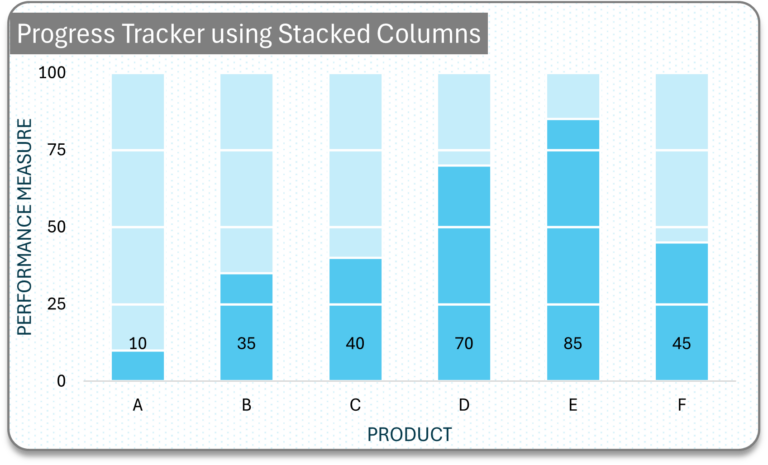
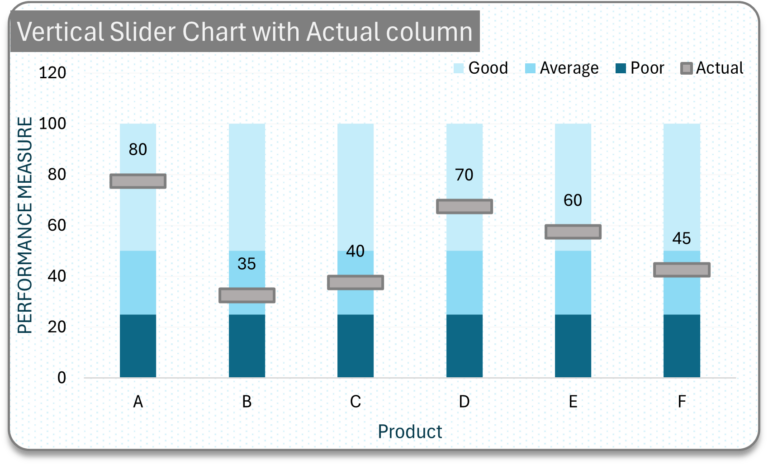
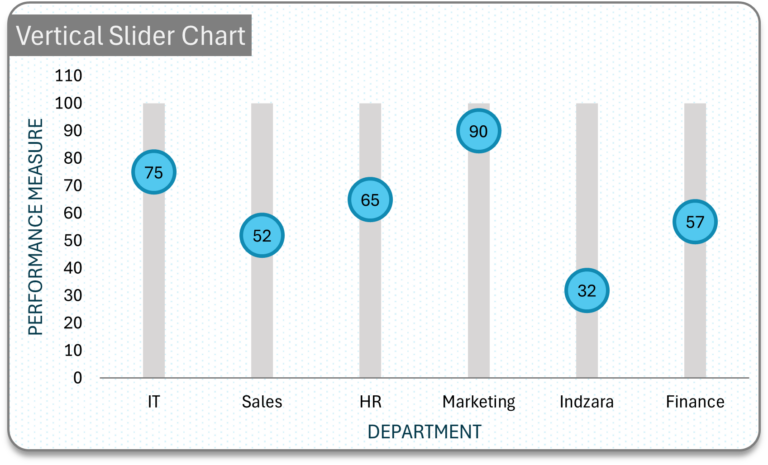
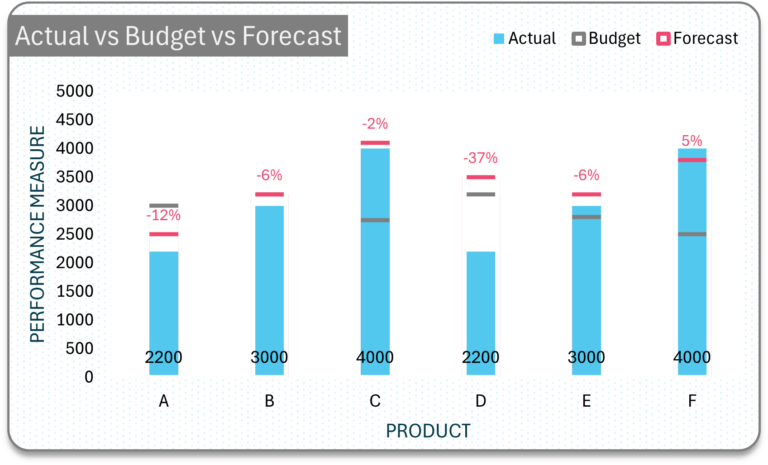
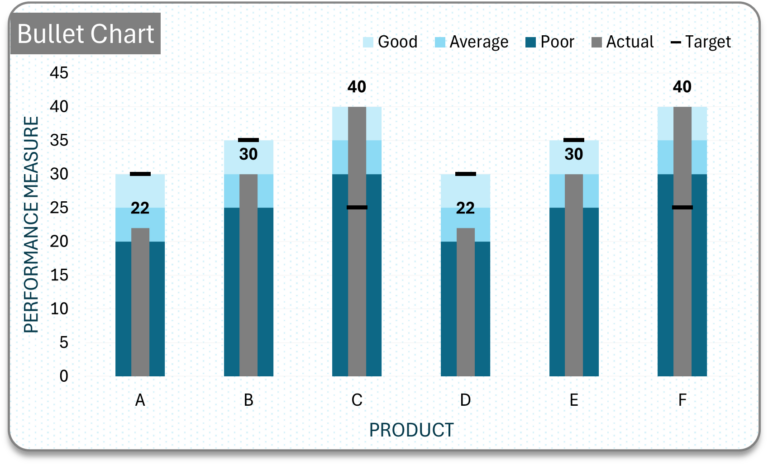
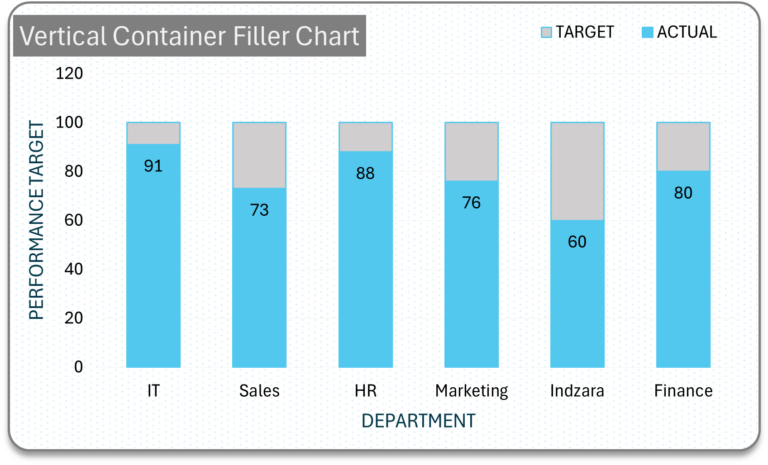
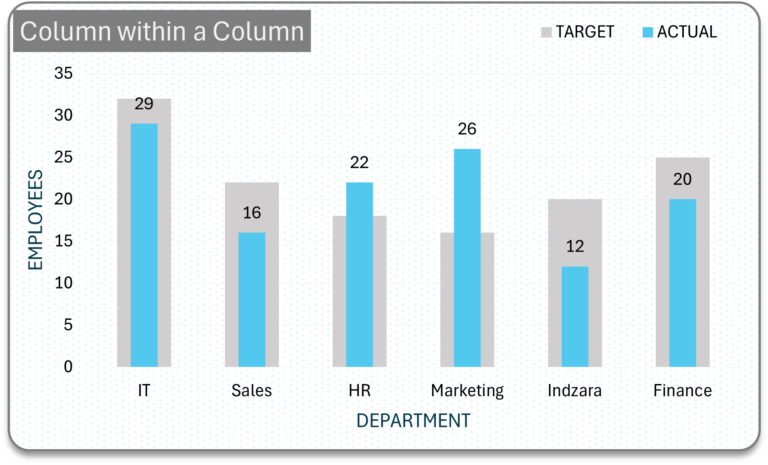
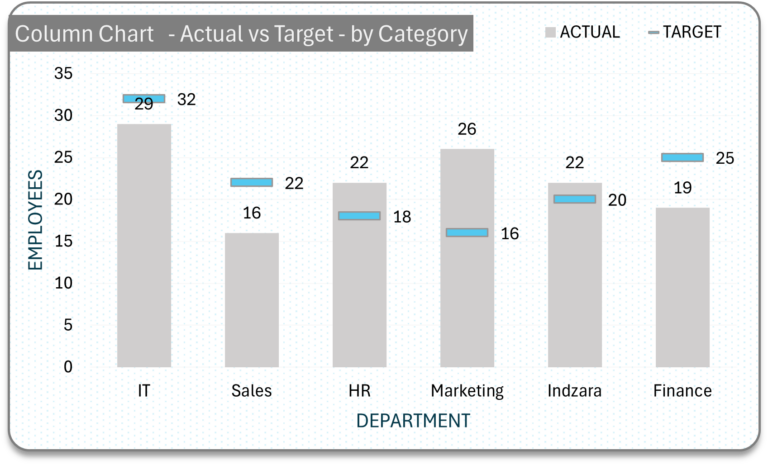
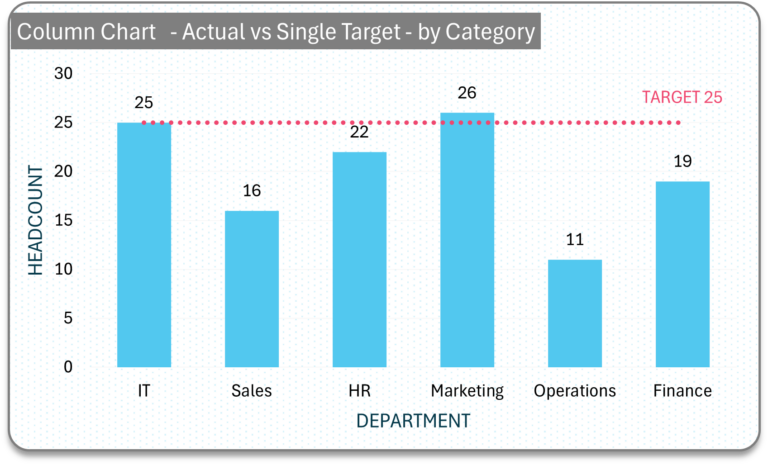
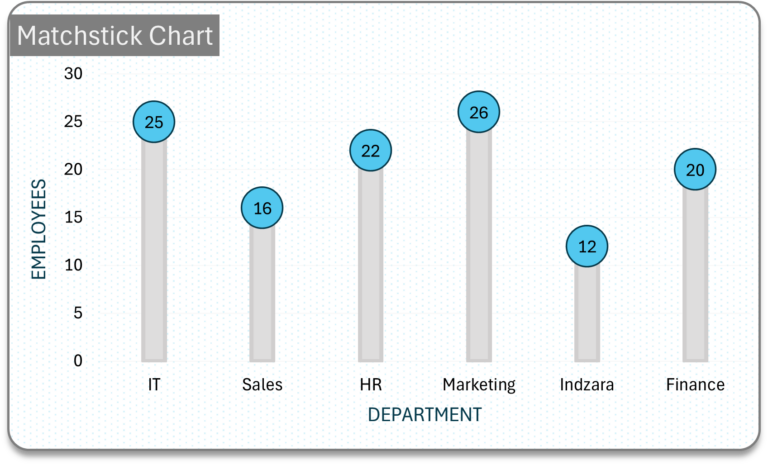
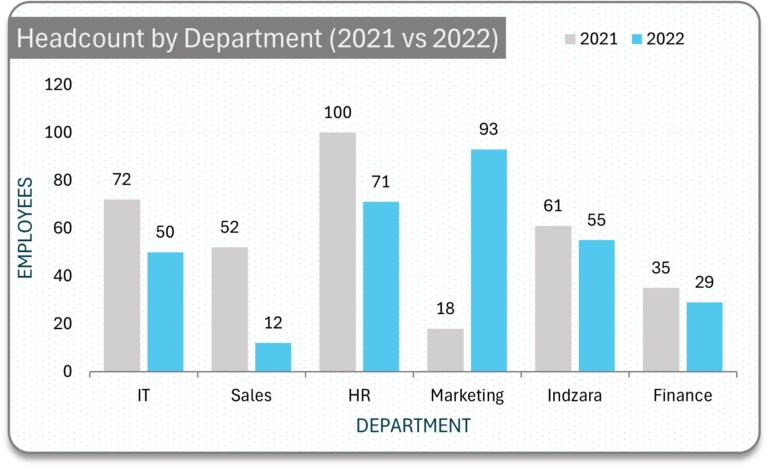
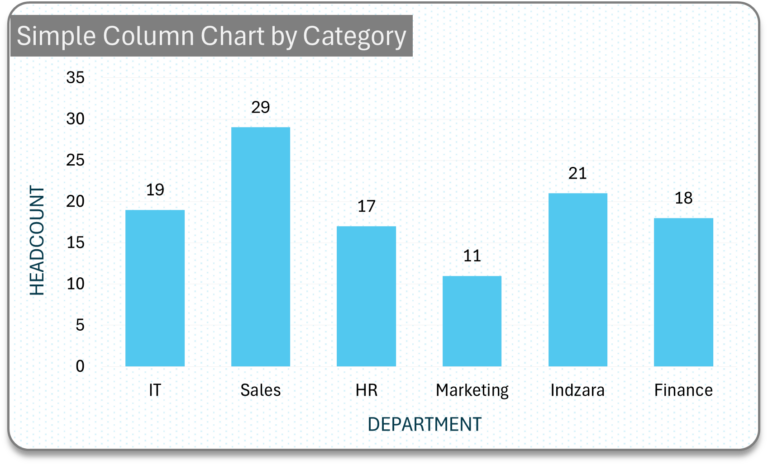
Whether you’re seeking innovative ways to showcase trends, compare metrics, or highlight correlations, our extensive collection of charts offers endless possibilities.
👉🏼 Customization: Tailor-Made Visuals to Suit Your Style
While our templates offer a solid foundation, we understand that one size doesn’t fit all.
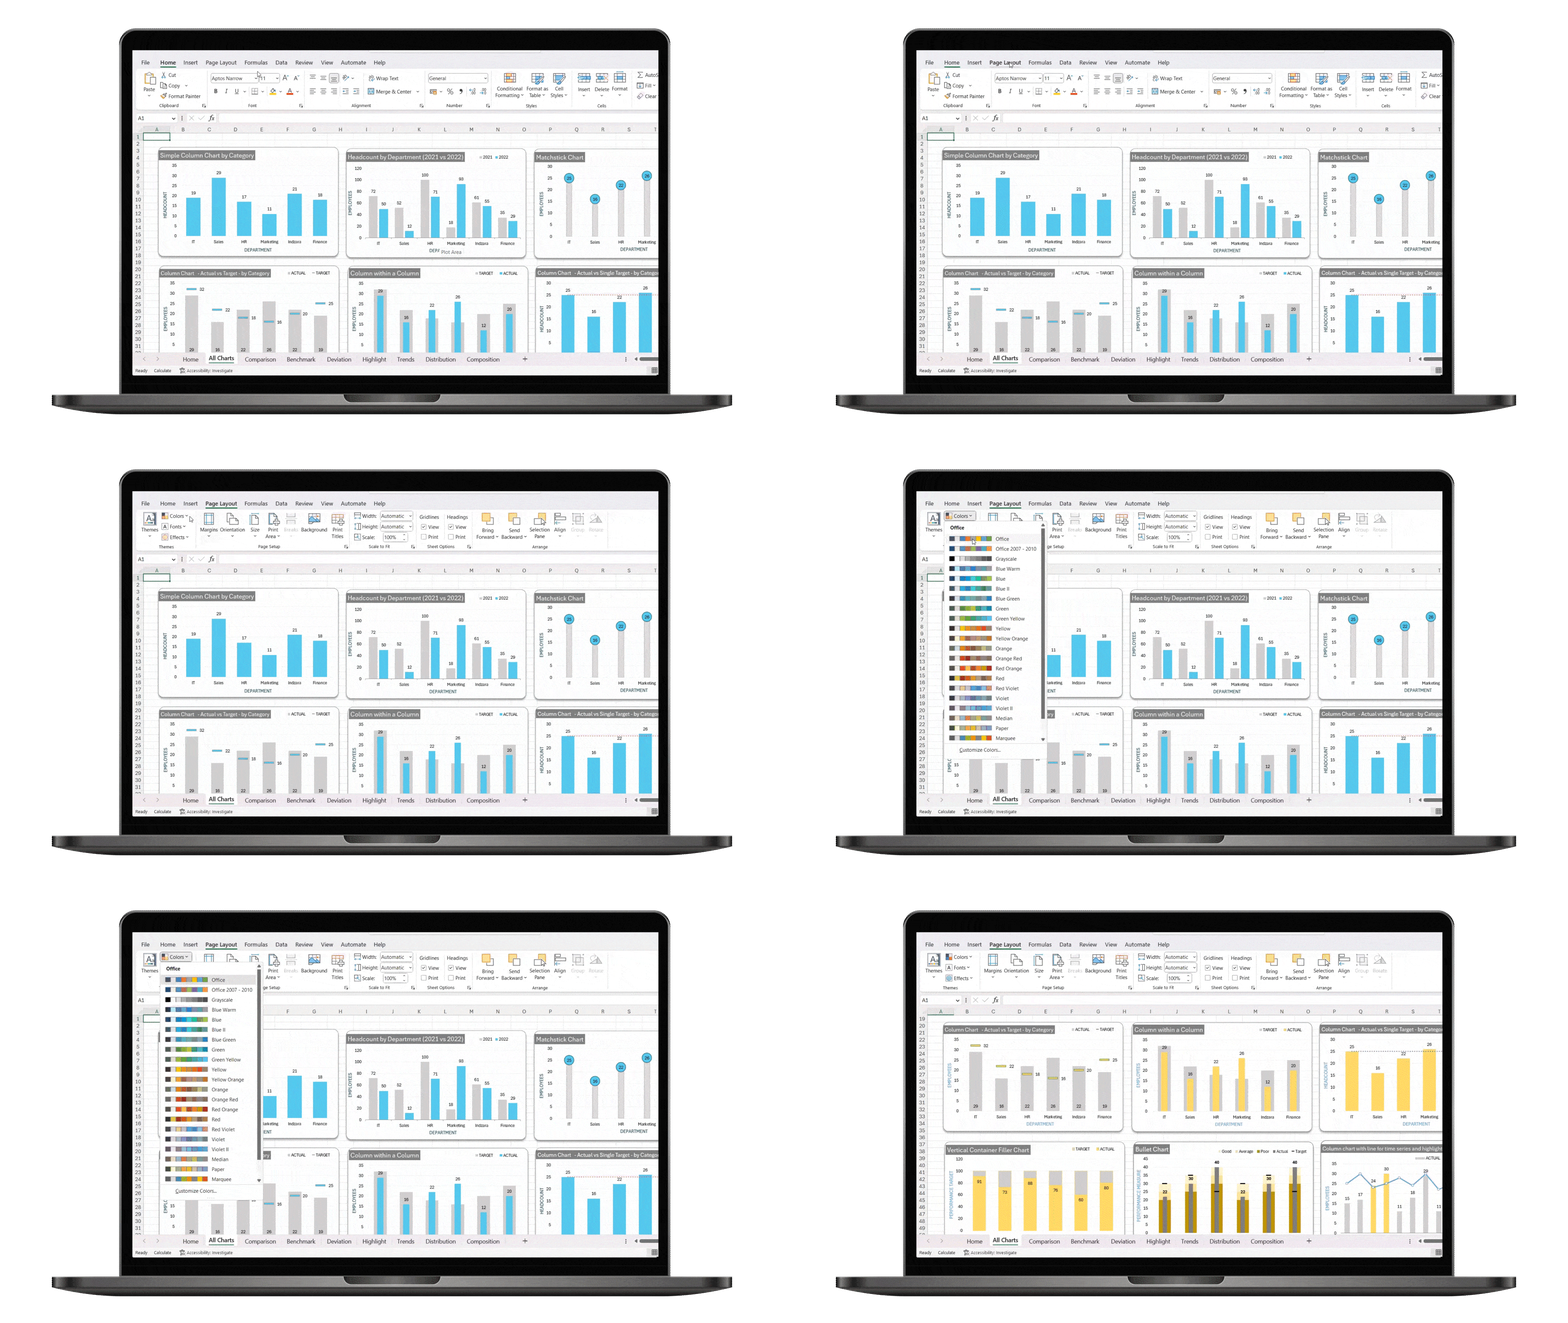
With simple modifications, you can effortlessly switch colors, fonts, and more to align with your branding or preferences. Say goodbye to cookie-cutter visuals and hello to tailor-made charts.
👉🏼 Save and Re-use: Effortless Chart Replication
What if you want to incorporate our stunning charts into your existing Excel files, where your raw data resides? We’ve got you covered.
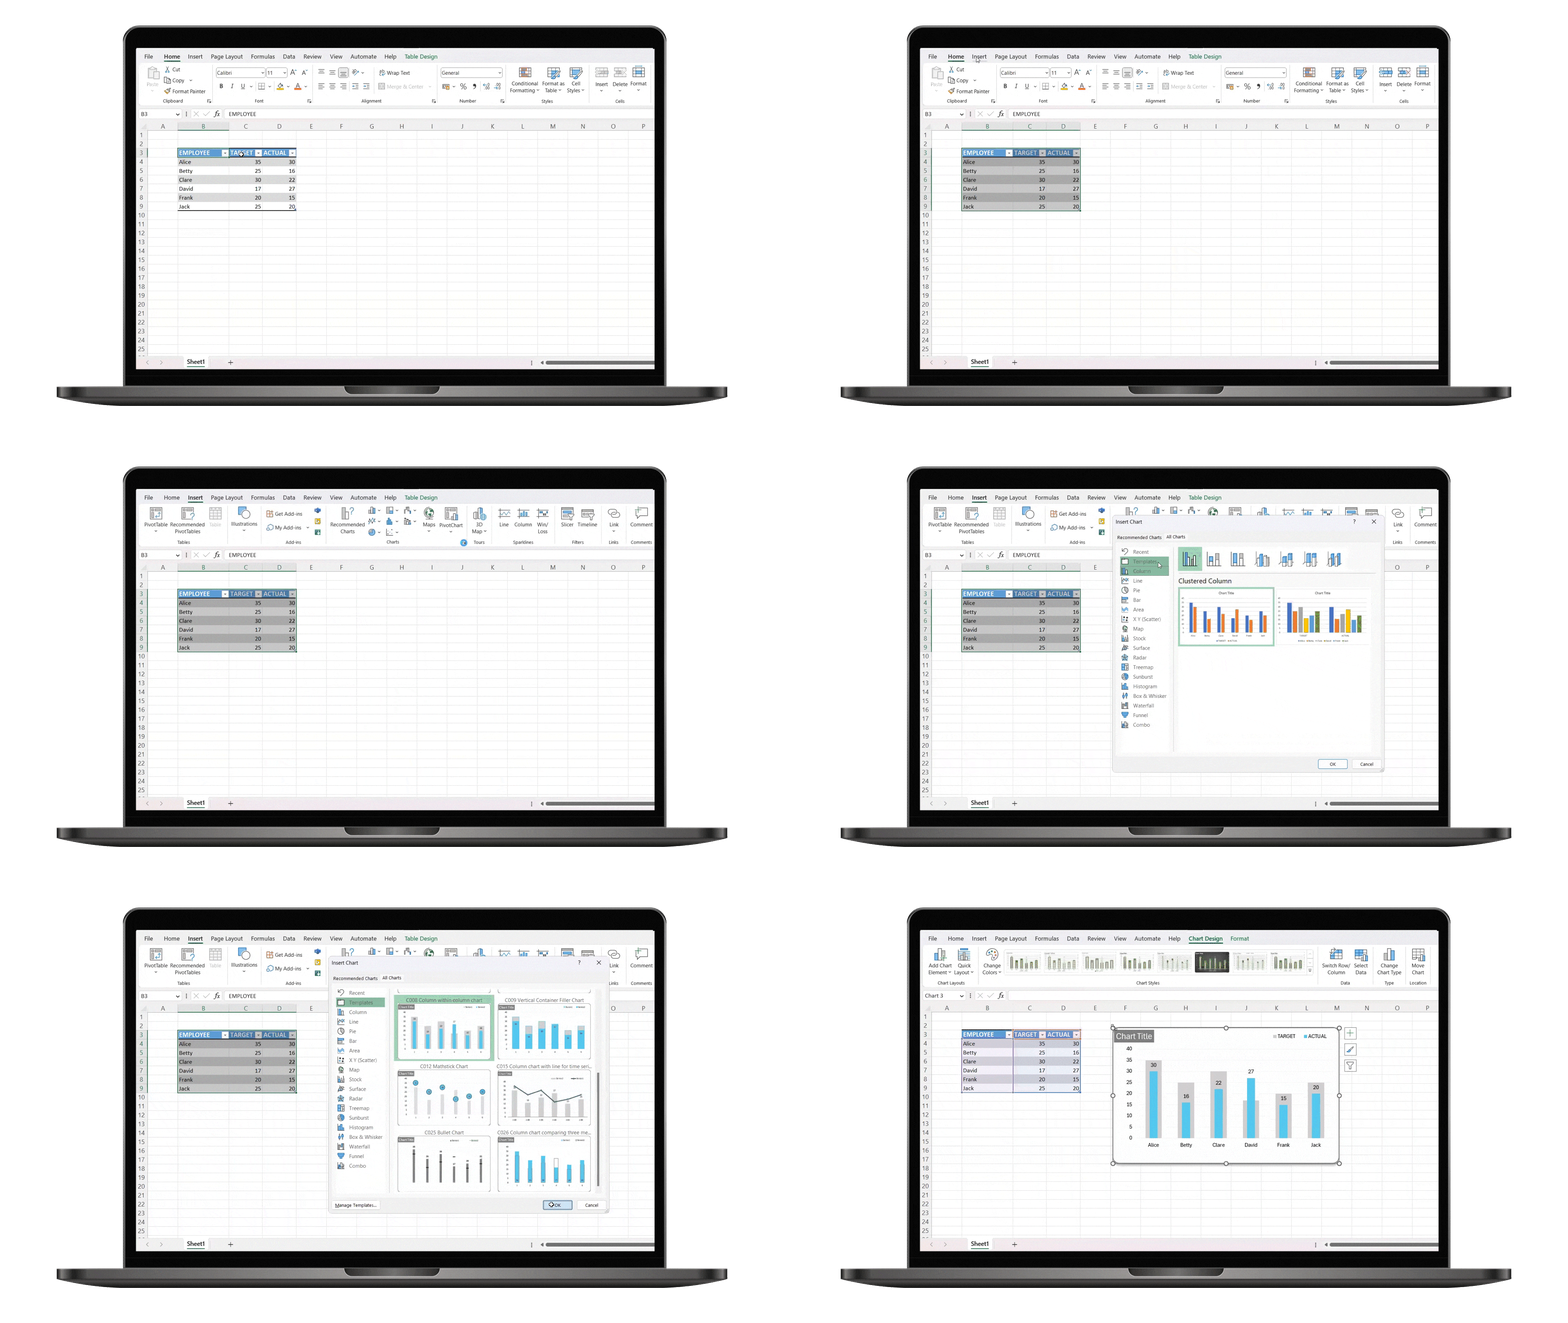
Simply right-click on the chart you wish to use, and save it as a template (.crtx file) with a name of your choosing. Then, navigate to your own Excel file, select the corresponding data, and insert a new chart. Instead of starting from scratch, choose the template we’ve saved, and voila! The chart’s style and formatting are instantly applied to your data.
But here's the best part ✨
You can replicate this process as many times as you like, across all your Excel files. No need to repeatedly open our template – once you’ve saved the chart template, it becomes a versatile tool at your fingertips, ready to elevate your data visualization efforts with minimal effort.
👉🏼 Dedicated Support Portal
At Indzara, we’re committed to ensuring your experience with our Instant Chart Maker is as seamless and efficient as possible. That’s why we’ve created a dedicated support portal tailored to your needs, brimming with valuable resources to guide you every step of the way.
Our support portal features a wealth of articles, videos, and screenshots meticulously crafted to provide comprehensive assistance. But what if you encounter a hurdle along the way? Our expert support team is here to help. Simply shoot us an email, and we guarantee a prompt response within 1 business day.
If you have specific charting requirements or need custom reports developed, write to us at support@indzara.com.
Furthermore, to ensure you always have access to the latest charts, we’re thrilled to announce that new charts will be added to our library monthly – and yes, these updates are free. Stay ahead of the curve with our ever-expanding collection of charts, designed to meet the evolving demands of data visualization.
Seize this opportunity to unlock the power of visual storytelling. Purchase our Instant Chart Maker for clearer insights and better decisions.


Reviews
There are no reviews yet