FIFO Inventory Tracker – Free Retail Inventory Management Template
Are you managing a small business with retail inventories? Furthermore, does your inventories have expiration dates and you find it difficult to track them? If your business gets inventories from suppliers and sells them at a profit to customers, tracking your inventory and managing sales is an integral part to be profitable.
Introducing our FIFO (First-In-First-Out) Inventory Tracker, a single tool for all your inventory management woes! This template helps you track expiry dates of your products along with some amazing features like Order Management, Finance, Data Management, Reporting and more.
This Excel template is designed for products that have expirations, if you are looking for a template that just manages purchases from suppliers and sells to customers, please visit Retail Inventory Tracker in Excel.
Why do we need an FIFO Inventory and Sales Management tool?
The following information are key to understanding your small business better and make informed decisions:
- Check your current inventory for each product. Fulfilling orders on time is crucial for maintaining business credibility.
- Identify low inventory products compared to the Re-order point. Use this data to make informed purchase orders.
- Take into account the expired products and track available inventories for products and orders based on purchase orders (using First-In_First_Out_Princliple).
- Monitor product sales. Invest in profitable products and avoid those that underperform.
- Track your business’s profit/loss. Adjust your business strategy if you’re not turning a profit.
- Identify top customers and suppliers. Cultivate strong relationships with high-revenue suppliers and provide special services to top customers for potential sales growth.
In order to get to this information easily and quickly, we need some kind of software. There are several sophisticated and expensive cloud based software available to manage inventory and sales for retail businesses.
For small and medium size businesses, especially when we are starting up, it is important that any software we choose is easy to use, customize and not expensive. This is why I am excited to present a free Excel template as a solution.
If you buy raw materials from suppliers and assemble/produce finished products to sell, please check our best selling Manufacturing – Inventory and Sales Manager Excel Template
Features of Retail Inventory Tracker Excel Template
Order Management
- 3 types of orders (Sale, Purchase, Adjust)
- Handles product returns
- Auto-Populate product prices in orders
- Track expired products and place return orders for the same
Inventory Management
- Calculates current inventory of each product based on the expiry dates of each product
- Set re-order points and know what to order
Finance
- Handles tax
- Handles product level and order level discounts
- Calculates Cost of Goods Sold (COGS) and Profit
Data Management
- Easily access Product, Partner (Customer and Supplier) and Order Lists
- Maintain history of Product price data
Reporting
- 6 page interactive report of business metrics
- 12 month trends of key metrics
- Identify best products and partners
- Calculates Inventory value
How to Use the FIFO Inventory Tracker
Before we get started, I highly recommend reading these articles if you are new to Excel templates or Excel Tables.
- Important tips about using Excel Templates from indzara.com
- Do not edit calculated cells (ones with formulas).
- Input data is always visible and can be edited easily.
- Backup by saving copies of this file regularly.
- Introduction to Excel Tables (How to use Excel tables to enter data)
To make it easy for you to identify which fields are input fields, calculated and custom fields, I have followed the following color scheme in column headings (or labels).
- Color Legend for this template
- Columns with Purple colored labels – Input cells for user to enter pre-defined information.
- Columns with Green colored labels – Calculated cells. Should not be edited.
- Columns with Blue colored labels – Custom Input cells for user to store any information needed.
Requirements: This template is compatible with Microsoft 365 subscriptions only.
Overview of steps
- Initial Setup
- Enter Business Information in Settings sheet
- Enter Product Categories in Settings sheet
- Enter list of Products in Products sheet
- Enter current Prices of products in Prices sheet
- Enter list of customers and suppliers in Partners sheet
- Creating Orders
- Enter list of Orders in Order Headers sheet.
- Enter each order’s details (line items) in Order Details sheet.
- Viewing business report
- View summary of business performance in Report sheet
- View the Inventory details of each batch in the Inventory sheet
Detailed Step by Step instructions (with screenshots)
Initial Setup
These Initial Setup steps are to be done first as a one-time activity.
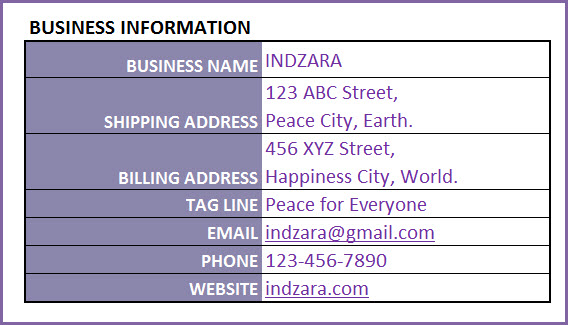
Step 1: Enter Business Information
In Settings sheet, Enter your business information such as address, email and phone number.
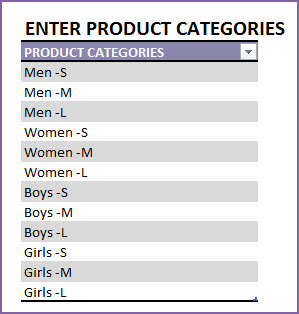
Step 2: Enter Product Categories
If you are selling several products in your business, it is recommended that you categorize your products. This helps a lot in managing them and understanding their sales performance.
Step 3: Enter Products
It’s time to enter our products. In the Products sheet, let’s enter each of our products in a separate row.
Please start entering from row 4
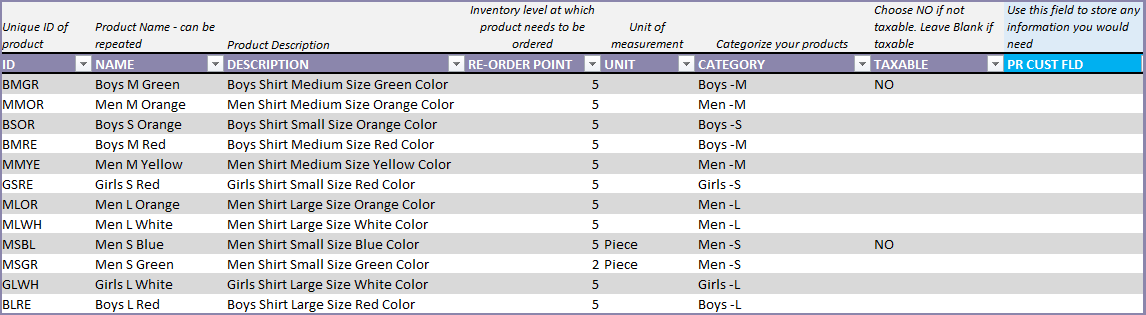
Let’s see each of the fields in the Products table.
- ID: Unique identification of product. This has to be unique. Please do not repeat the same ID or leave the field blank.
- NAME: Name of the product
- DESCRIPTION: Description of the product, as needed in our business.
- RE-ORDER POINT: The quantity of product at which you would like to replenish by ordering.
- UNIT: This is how we measure this specific product.
- CATEGORY: Product category to which this product belongs.
- TAXABLE: In our business, if we have products that are not taxable, we can enter NO. If tax is applicable, just leave it blank. By default, tax will be applicable.
- PR CUST FIELD: This field is provided as a placeholder for you to enter any information you need at Product level. You can rename the field and use it as needed.
For adding starting inventory for each product, the same should be done as a purchase order which is explained in the later sections of this article.
The other columns in this sheet are all calculated columns. We will discuss more about this later in this article.
Note: The columns that have Green colored labels are all calculated columns. Please do not edit the formulas in them.
Step 4: Enter Product Prices
In Prices sheet, we will be entering Purchase and Sales prices. This information will be used to auto-populate prices in our orders. This will save a lot of time in data entry of orders.
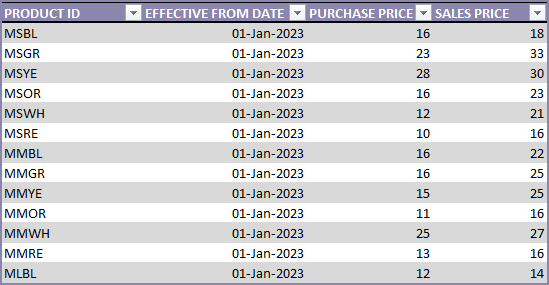
Purchase Price is the price we pay our suppliers to purchase products. Sales Price is the price we sell the products to our customers at.
To begin with, let’s assume we start using this template from Jan 1, 2023 to enter orders.
We enter each product in this Prices table and enter Jan 1, 2023 as the Effective Date. The Purchase and Sales prices we enter will be the prices effective as of Jan 1, 2023.
What if price changes?
The template is designed to accommodate price changes for products. You may have an increase in prices of certain products over time. Not a problem.
If price changed for a product from Jan 1, 2024, we will just add a new row, enter the Product ID, Effective date (as 01-Jan-2024) and the new Purchase and Sales prices. Please note that we have to add new rows whenever prices change, and not to replace the older data.
We have to enter both purchase and sales price in each row, even if there is change in only one of them.
Step 5: Enter list of Partners
In the Partners sheet, we store the list of our partners. Partners include Suppliers and Customers.
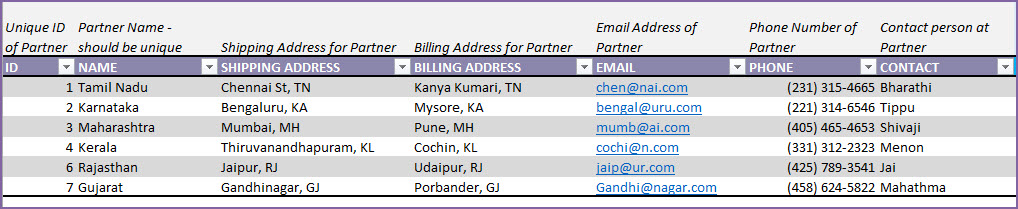
If a partner is both a customer and a supplier (it is possible in some scenarios), enter the partner only once.
- Partner ID and Partner Names should be unique.
- Enter Shipping and Billing address, E-mail address and Phone number.
- Enter the primary person of contact for each company in the CONTACT field.
This sheet now serves as a nice organized set of data about your partners.
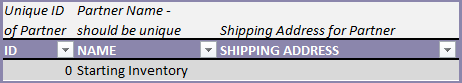
How to enter initial inventories?
Initial or starting inventories should be added as purchase orders and follow the below steps for the same:
1. Create a Partner(used as a dummy entry) in the Partners sheet called “Starting Inventory” and no other details to that row item.
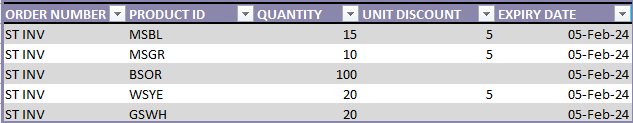
2. In Order_Header, enter the order number (again, a dummy) as “ST INV” and enter the order date and expected date, include the Order type as “PURCHASE” only.

3. Now, in the Order_Details, enter all the starting inventories against the ST INV order number as shown:
We have completed the initial set up now. It’s time to enter our first order.
Creating Orders
Before we enter our order, let’s learn about the types of orders. You can create 2 types of orders in this template.
- PURCHASE: When we purchase products from our suppliers, we enter a PURCHASE order. This order will add the purchased items to inventory on the Expected Date.
- SALE: When we sell products to our customers, we enter a SALE order. This order will subtract sold items from the inventory on the Expected date.
Creating a Purchase Order
Orders are entered in this template in 2 stages – 1) Order Header and 2) Order Details. Let’s use an example. The products here are shirts for boys and girls. They are available in different colors.
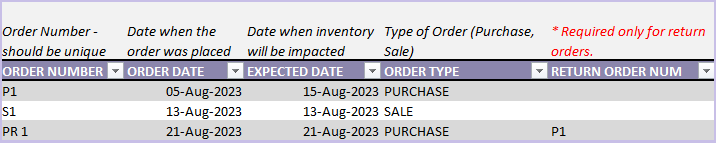
In the Order Headers sheet, we enter the following information.

The Order Number should be unique. In other words, each order should be entered in one and only one row. This field should not be blank.
We can enter any method of numbering orders. The template does not limit that and does not create any pre-defined order numbers. Here, we have entered ‘P1’ as order number, to reflect that it is the first purchase order we are entering.
Order Date and Expected Date
Each order will have 2 dates. Order Date and Expected Date. Order Date is the date when the order is placed. Expected Date is the date when the inventory is impacted.
For example, if you place a purchase order on Aug 5th. The supplier says the products will reach your inventory on Aug 15th. Here, Aug 5th is Order Date and Expected Date is Aug 15th. If there is a delay later and the supplier says it will only reach on Aug 21st, then we have to update the Expected Date of our order to Aug 21st.
Order Type is ‘Purchase’ and we have chosen our supplier in the Partner Name field.
There are additional information we can enter in the Order Header:
- OTHER CHARGES: Any additional cost on the order. For example, shipping charges.
- ORDER DISCOUNT: Any additional order level discount amount (not %). We will be entering product level discounts later.
- TAX RATE: Tax Rate % applicable for this order. We can have different tax rates for different orders.
- ORDER NOTES: Enter any notes for your reference to this specific order.
Now, we enter the items on the order in the Order Details sheet.
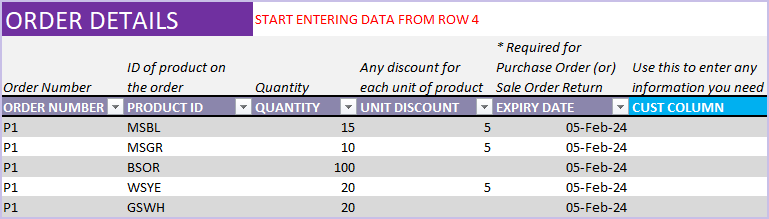
It is very simple. Enter Order Number, Product ID, Quantity and any Unit Discount.
Here, we have entered a purchase order to purchase 15 units of Boys Shirt in Blue color and 10 units in Red color and so on. There is a discount of $5 (any currency you use) for a few of these items.
The template will calculate amounts, tax and other details for each line item as shown below:
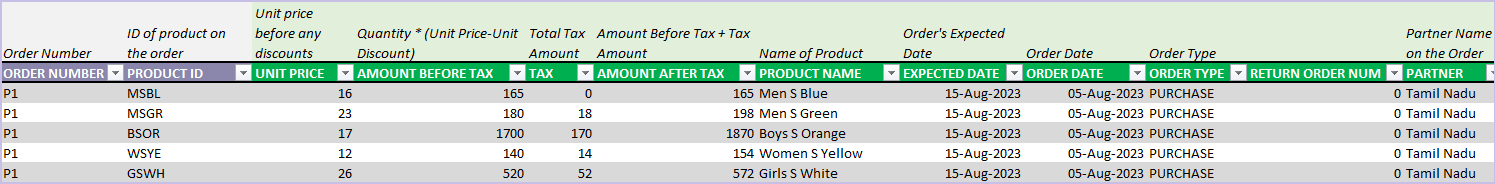
Unit Price is automatically pulled over from the Prices sheet. Price chosen will be the one that was effective as of the Order Date of the order.
Creating a Sales Order
Entering a sales order is very similar to the purchase order, except that our Order Type is ‘Sale’ now.

As shown in the image above, to add an order, we just add our entry in a new row in Order Headers sheet.
We enter S1 as Order Number. This sale order was placed on Aug 13th and products were given to customer on the same day (Aug 13th).
In the Order Details sheet, we add 5 rows of the sale product details.
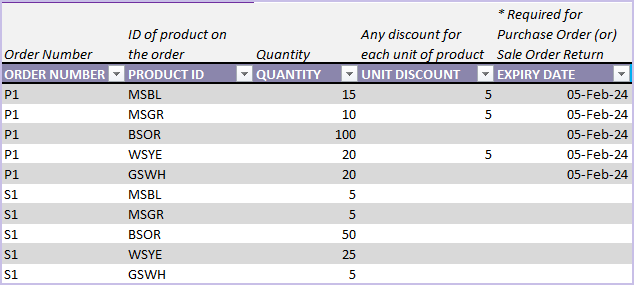
This order will now automatically reduce inventory for each of the products, effective as of Aug 13th (Expected date).
Handling Supplier Return
If we have a situation where we want to return products back to our supplier due to some reason (example: defective products or nearing expiry), we can do so easily.
We will enter a new Purchase order.
Tip: For easier identification of return orders, you can enter order number differently. For example, use a prefix of PR for purchase return orders.
In our example, after receiving the products on Aug 15th, we see some faulty products in them and wish to return to supplier.
The same can be captured as below:
In the Order Details sheet, we will enter the information on returning product and quantity.
Similarly for a Sale order return, make a new entry and in the Order Details sheet, ensure to include an expiry date for the same.
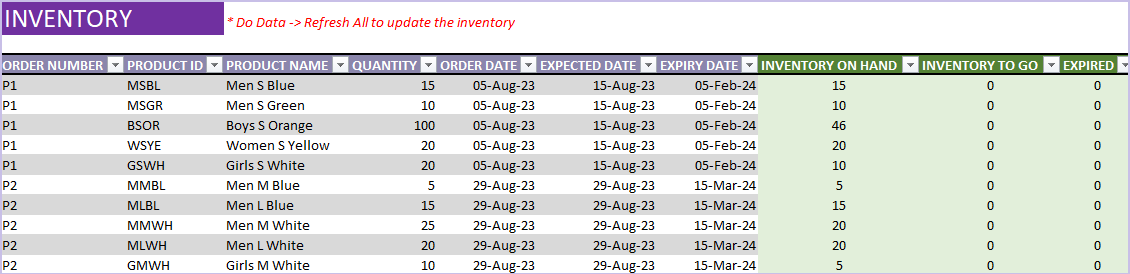
Inventory
This sheet, which gets automatically populated gives you a table of all the products (based on Orders) and their inventory details and expired quantity.
All you need to do is to refresh the Excel Sheet to get this populated, instantly.
Business Performance Reporting
The template has extensive automated and interactive reporting in the Report sheet.
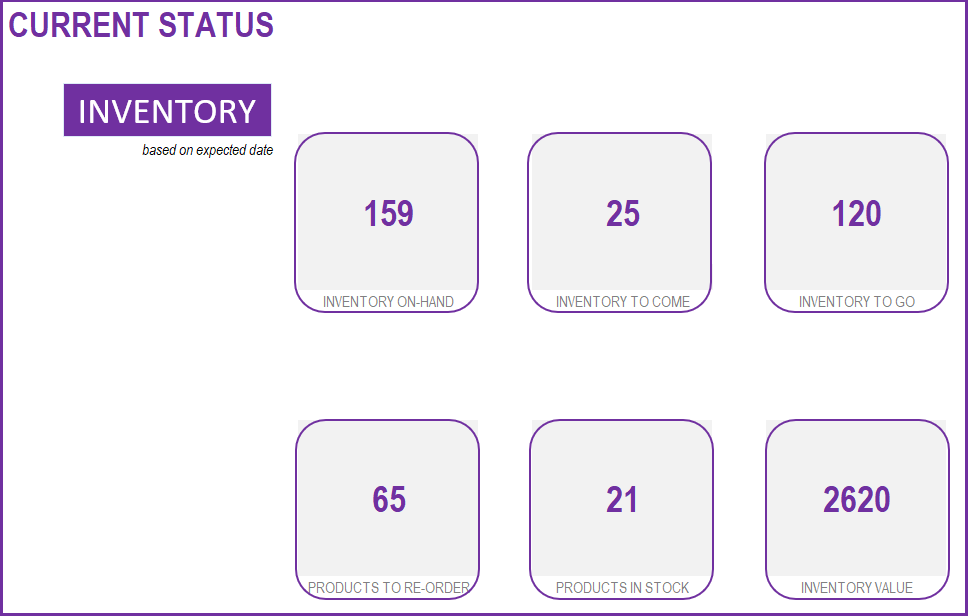
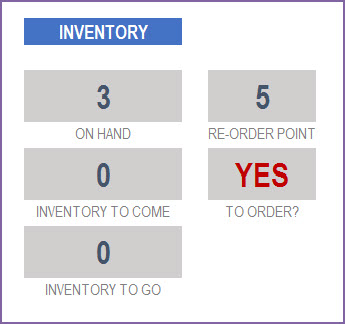
Current Status (Inventory level and Inventory value)
The following metrics are displayed to reflect the status as of today taking into consideration any expired inventories.
- Total inventory (quantity) on hand.
- Total inventory to Come (ordered from suppliers already and will reach our inventory in future)
- Total inventory to Go (ordered by customers already and will leave our inventory in future)
- Number of Products to re-order (products whose current inventory is at or below its Re-Order Point)
- Inventory Value (calculated based on current purchase price of the products on hand)
The above presents the overall summary of all products together. This is also available for each product in the product sheet.
Now, the rest of the Report sheet presents an interactive way of accessing business performance metrics.
We can customize the date range for the report by choosing any start and end dates.
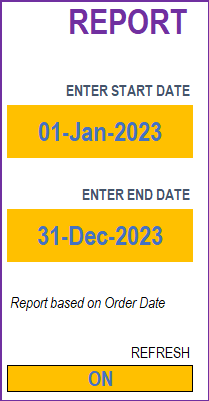
We leave the Refresh as ON. If you enter a lot of order data over time and if you notice the file is getting slower, you can turn this OFF. It will stop the report from refreshing constantly and that will improve performance.
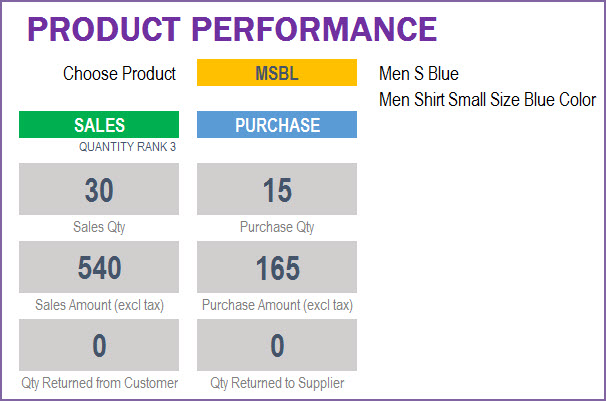
For the date range we entered, we can see the summary metrics.
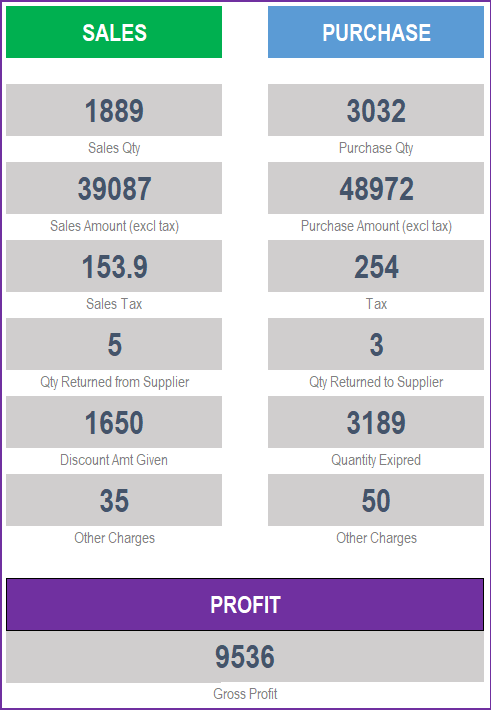
- SALES
- Sales Qty: Total of quantity on Sale orders. Considers returns as well.
- Sales Amount: Total Order amount on the Sale orders. Includes product level discounts. Does not include tax, order level charges and order level discounts.
- Sales Tax: Total tax amounts on Sale Orders
- Qty Returned from Customer: Quantity returned by customers
- Discount Amt Given: Total amount of discount given to customers
- Other Charges: Total of other charges on all Sale orders
- PURCHASE
- Purchase Qty: Total of quantity on Purchase Orders. Considers returns as well.
- Purchase Amount: Total Order amount on the purchase orders. Includes product level discounts. Does not include tax, order level charges and order level discounts.
- Tax: Total tax amounts on Purchase Orders
- Qty Returned to Supplier: Quantity returned to suppliers
- Qty Expired: The total products that were expired within the date range
- Other Charges: Total of other charges on all Purchase orders
- PROFIT
- Gross Profit: Sales Amount – Cost of Goods Sold
- Cost of Goods Sold is the sum of purchase price of products sold. Purchase price is the price of product as of Sale order date.
- Gross Profit: Sales Amount – Cost of Goods Sold
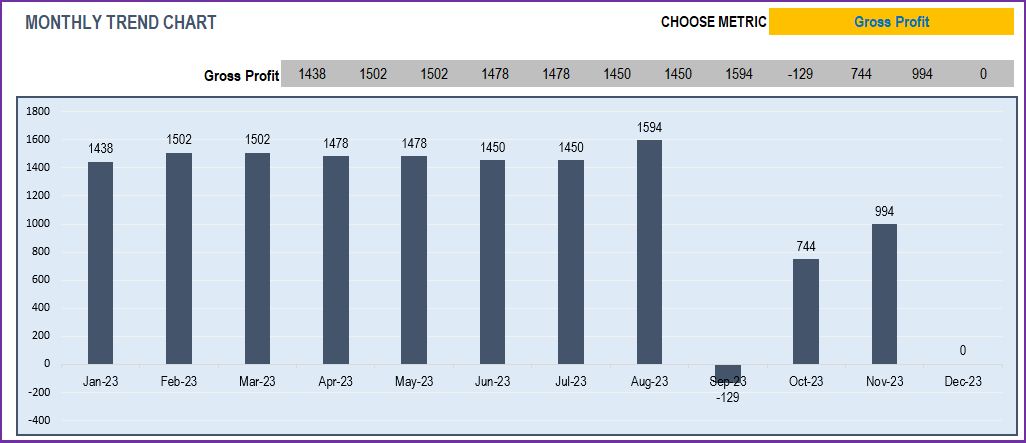
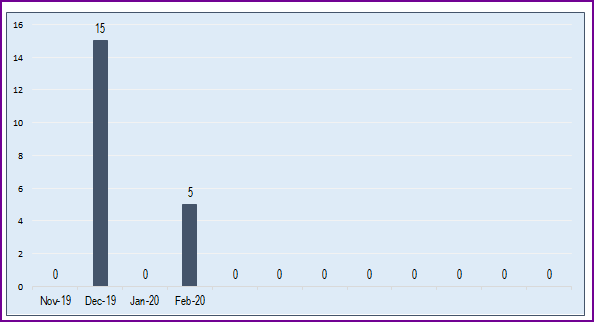
We can view these metrics by month, for 12 months at a time.
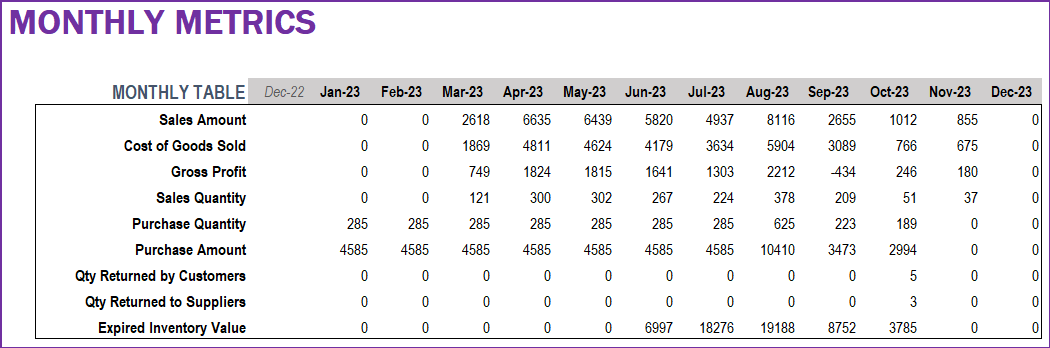
We can choose one of the metrics to display data on a chart showing trends over 12 months.
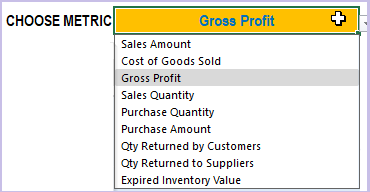
Top 10 and Bottom 10 Products
One of the important pieces of understanding business performance is knowing which products are selling the most and which ones are not. We have 3 ways of measuring sales – Quantity, Amount and Margin. This allows us to understand the true impact of the products to the business.
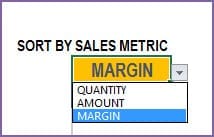
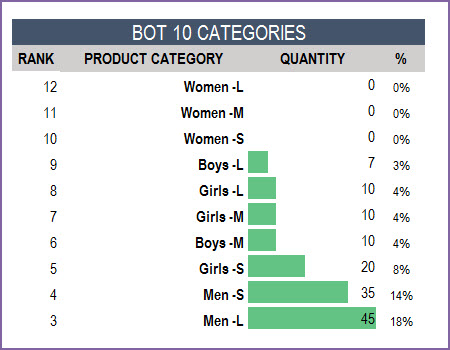
We will see top 10 and bottom 10 Product Categories by the selected Sales metric.
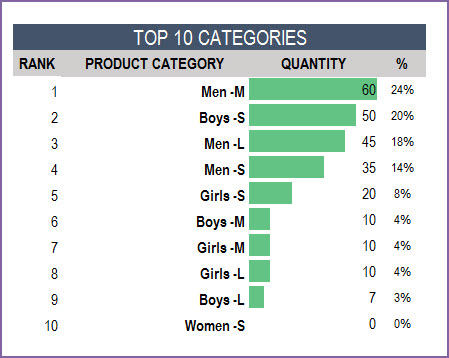
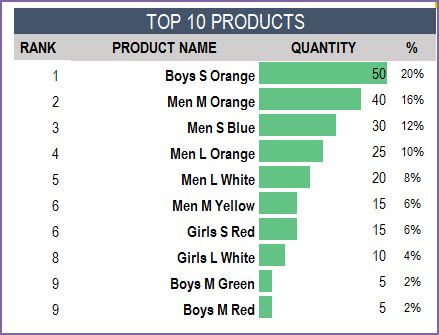
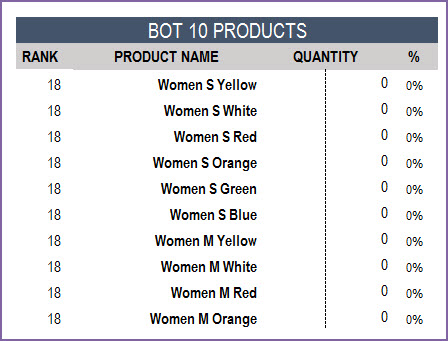
Similarly, the top 10 and bottom 10 Products by sales metric.
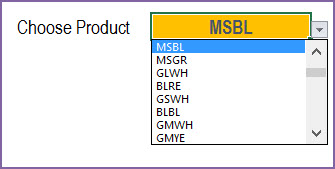
If we want to look for details of a specific product, we can choose the product ID from the drop down.
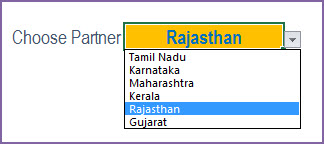
Partner Performance
Another important aspect is to understand best partners (customers and suppliers).
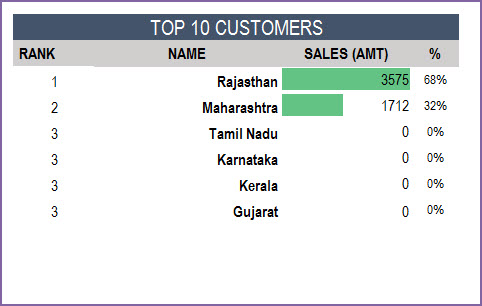
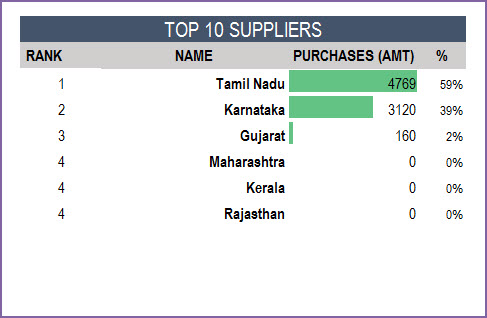
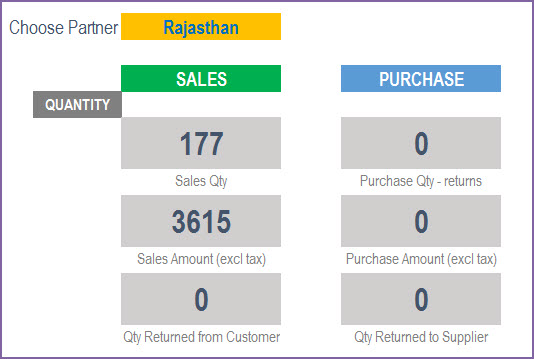
We can then see the details of one specific partner at a time.
Use this retail inventory template to handle all your inventory management requirements. If more details are required please visit customer support for this retail inventory management excel template.
Recommended Templates
For more features like
- Invoice Generation (Customizable design)
- Checks inventory availability in invoice
- Purchase Order Generation
- Accounting – Track payments made and payments due
-
 Manufacturing – Inventory and Sales Manager – Excel Template$59
 -
Retail Business Manager – Excel TemplateOriginal price was: $50.$40Current price is: $40.
-
Retail Business Manager (Pro) – Excel Template (Multiple Locations)$50
-
 Invoice Manager Pro Excel Template For Small Business$59
2 Comments
Hi,
I have a question. In the FIFO Inventory Tracker table, if I buy a product, it is not included in the “Inventory on hand” only if I have already sold it.
As long as I don’t sell any of the product it should not be in Inventory?
Thanks in advance for your reply!
Laci Csipler
Thank you for highlighting the issue. We regret the inconvenience caused.
We have fixed the issue and updated file. Following is the template download link for quick reference:
Click here to download
Best wishes.