
In this article, we will be discussing the Stock Portfolio Tracker Excel template that is used to track your stock portfolio’s performance.
The Stock portfolio tracker Excel template will allow entering all Stock transactions in one single table and immediately view the following in the Stock Portfolio Dashboard.
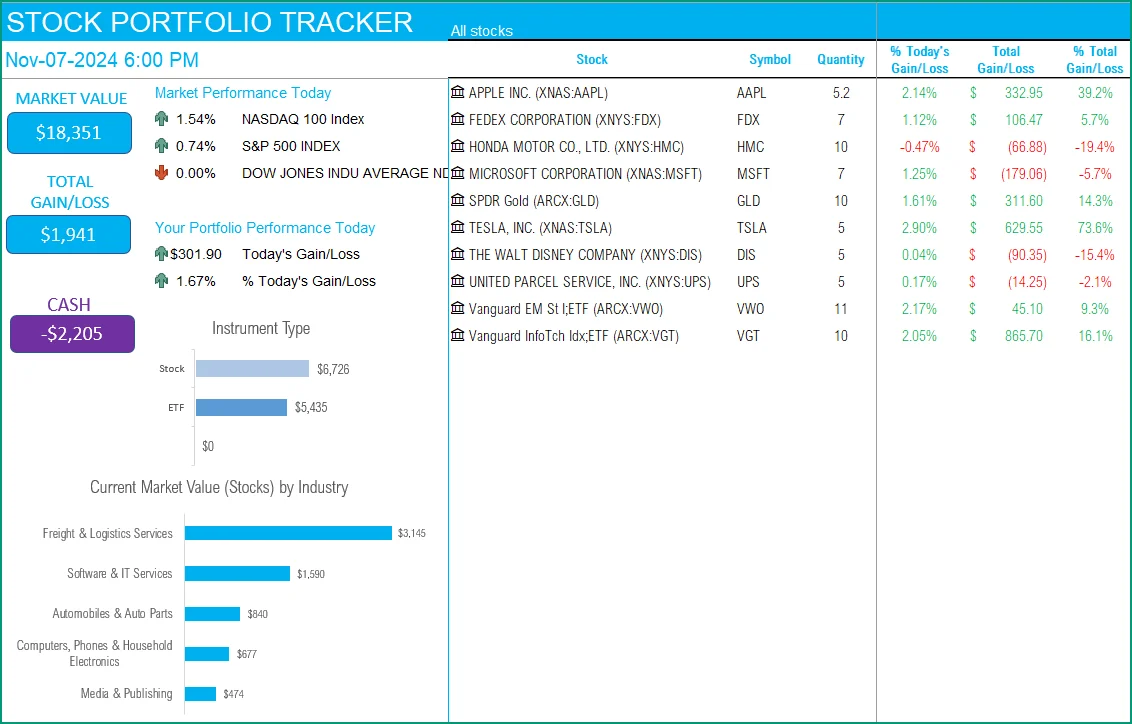
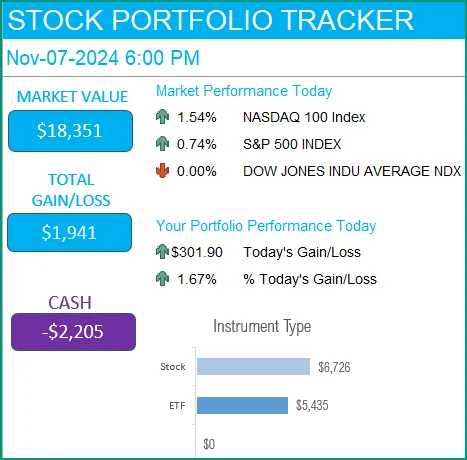
- Current market value of all your stocks and the Cash balance
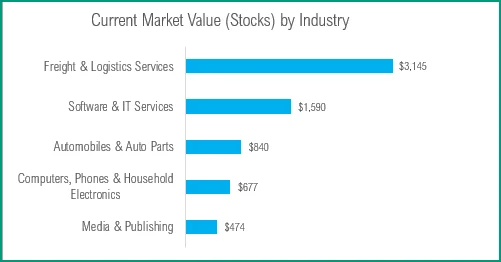
- Portfolio mix by instrument type and industry
- Today’s market performance and your portfolio performance
- List of all your stocks with performance data (Quantity, Gain/Loss, % Gain/Loss, etc.)
The template can handle 7 types of stock transactions (Buy, Sell, Cash Deposit, Cash Withdrawal, Dividend Payout, Dividend Reinvestment, Fees).
Download Now
Video Demo
How to track your Stock Portfolio in Excel
The template has two visible sheets
- Transactions – where you enter all the stock transactions
- Portfolio Dashboard – which is fully automated and displays the Portfolio dashboard
Transactions
In the transactions sheet, we begin by entering the Starting cash balance at the top.
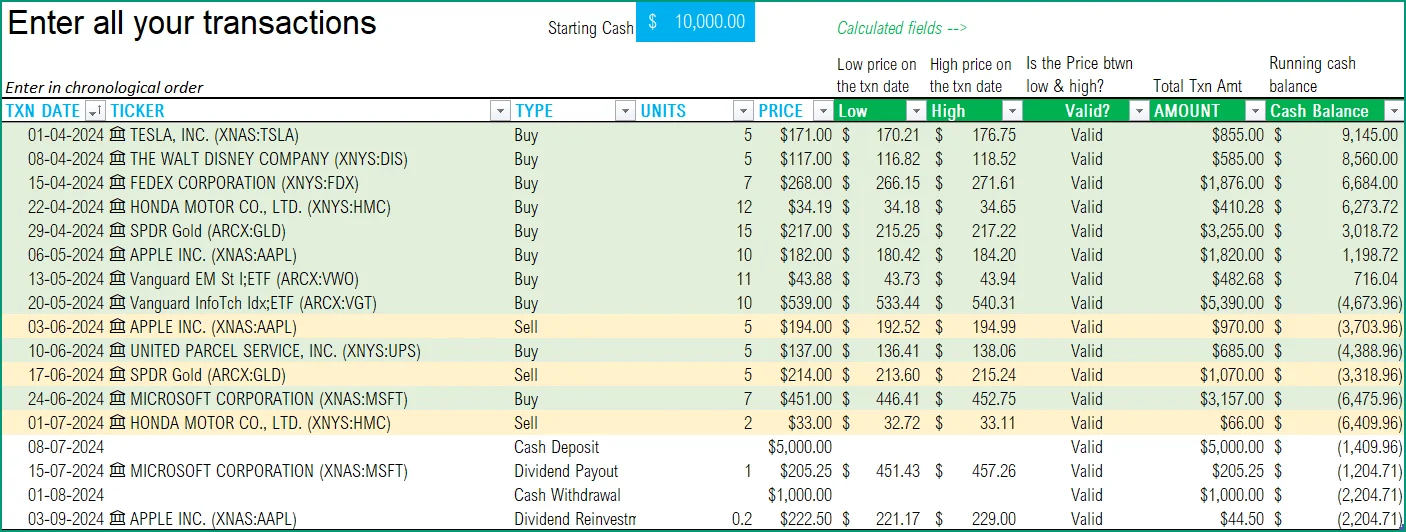
Then we can enter each transaction in the table. In the above screenshot, we have entered several transactions.
Enter Transaction date and Ticker symbol of the stock you traded.
If Excel does not recognize your stock symbol, it will pop up this data selector box.
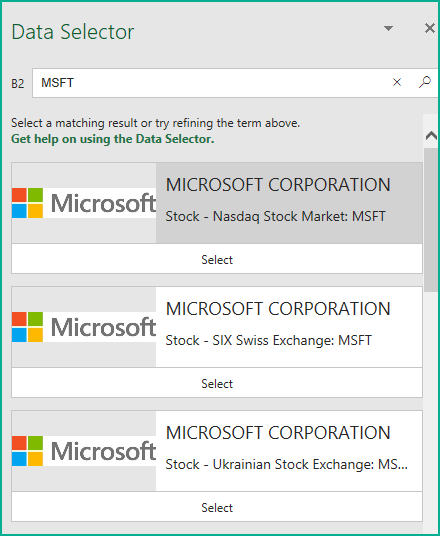
You can select the stock you are interested in.
Choose the Transaction Type.
There are 7 possible transaction types supported in the template.
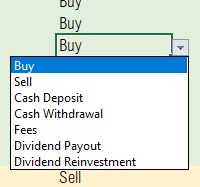
- Buy: When buying a stock – this will reduce the Cash balance and increase the stock quantity and thus your portfolio’s Market Value
- Sell: When selling a stock – – this will increase the Cash balance and decrease the stock quantity and thus your portfolio’s Market Value
- Cash Deposit: When adding Cash from external accounts (like your personal checking or savings account in bank) into your stock management platform which would then be available to buy stocks
- Cash Withdrawal: When you are taking Cash from the Stock Management platform to an external account (like your personal checking or savings account in bank)
- Fees: When any fees are applied which reduces money from your Cash balance
- Dividend Payout: When Dividend is issued that increases money in your Cash Balance
- Dividend Reinvestment: when Dividend is issued that increases stock quantity of the stock that issued Dividend. Cash balance is not impacted.
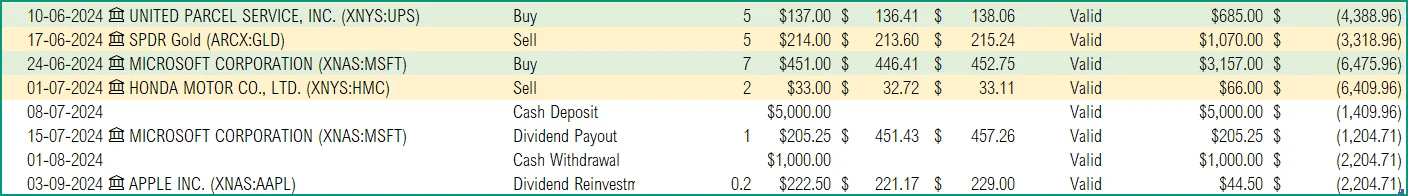
Type in the number of Units and Price of the Stock for the transaction.
Valid? column checks for whether the required information is entered.
For Buy, Sell and Dividend Reinvestment transactions, Ticker symbol and Units field are required.
For Cash Deposit, Cash Withdrawal, Dividend Payout and Fees, Units are not required. Price field is required.
The Valid? column also checks whether the Price of the stock is between the Low and the High for the day.
If you purchased the stock on a discount such as Employee discount, which brings it below the Low price for the day, you can ignore the Valid column.
Amount column calculates the total amount for the transaction.
Cash Balance reflects the running cash balance after each transaction.
For this to be accurate, please enter all transactions in chronological order.
Stock Sales, Cash Deposit and Dividend Payout increase the cash balance, while the Stock Buys, Cash Withdrawal and Fees reduce the cash balance. Dividend Reinvestment does not impact the cash balance.
Portfolio Dashboard
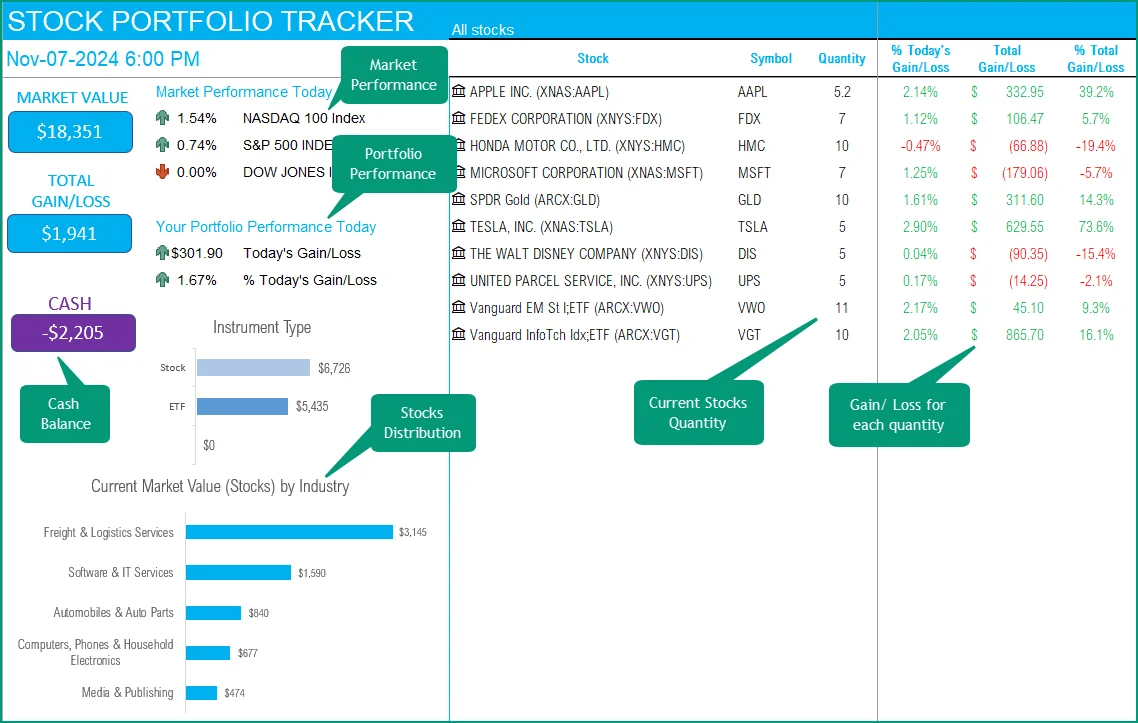
On the left side of the Dashboard, the overall summary is presented along with the Stock Portfolio mix by industry.
On the right side, we have the individual stocks and their performance.
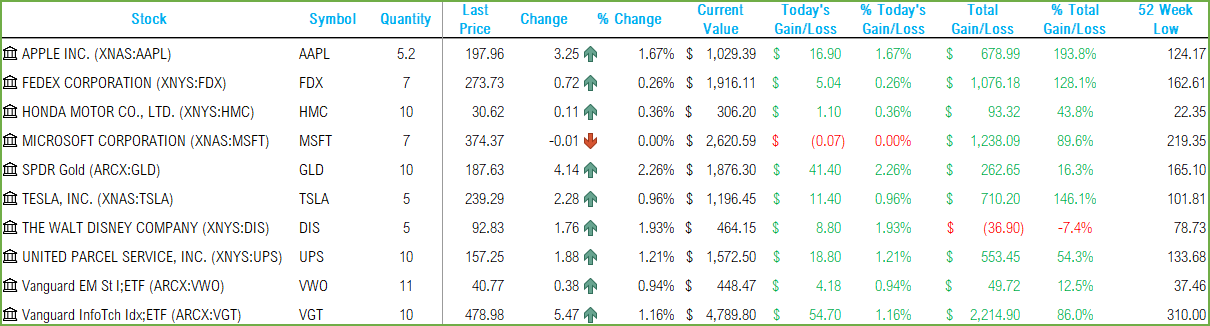
Calculations used
- Current Quantity = Quantity Bought – Quantity Sold + Quantity Dividend Reinvestment
- Current Value = Current Quantity * Last Price of Stock
- Today’s Gain/Loss = Current Value – (Previous Close * Current Quantity)
- % Today’s Gain/Loss = Today’s Gain/Loss / (Current Value – Today’s Gain/Loss)
- Total Gain/Loss = Current Value – Invested Amount
- Invested Amount = Total Amount used to buy the stock – Total Amount used to sell the stock
- % Total Gain/Loss = Total Gain/Loss / Invested Amount
- Cash Available = Starting Cash Balance – Total Amount used to Buy Stock – Cash Withdrawal – Fees + Total Amount of Selling stock + Cash Deposit + Dividend Payout
Requirements
To pull live Stock data from the services you would need Microsoft 365 Subscription Plans for PC and Web
Timezone
On the top left you can see the last trade time of the first stock in your list.
The default time that Microsoft provides is UTC. The offset is set to -7 hrs, to convert to pacific time zone.
You can modify this if you need the time in a different time zone in the hidden Help sheet.
Visit https://savvytime.com/converter/utc to view offset.
How to refresh data?

Feedback
Please share your feedback on this template in the Comments below. If you find this useful, please share with your friends who may benefit from this content.
-
 SMA Strategy Backtester Google Sheets Template$25
 -
SMA Strategy Backtester Excel Template$25
-
RSI Strategy Backtester Google Sheets Template$25
-
RSI Strategy Backtester Excel Template$25
-
MACD Strategy Backtester Google Sheets Template$25
-
MACD Strategy Backtester Excel Template$25
-
 Simple Moving Average Stock Screener Google Sheet Template$25
 -
Stock Screener Excel Template$97
-
Simple Moving Average Stock Screener Excel Template$25