Home » Data to Decision » Visualization
Category: Visualization
Use this simple excel template to enter your predictions for the U.S Presidential elections for 2024, and let the template
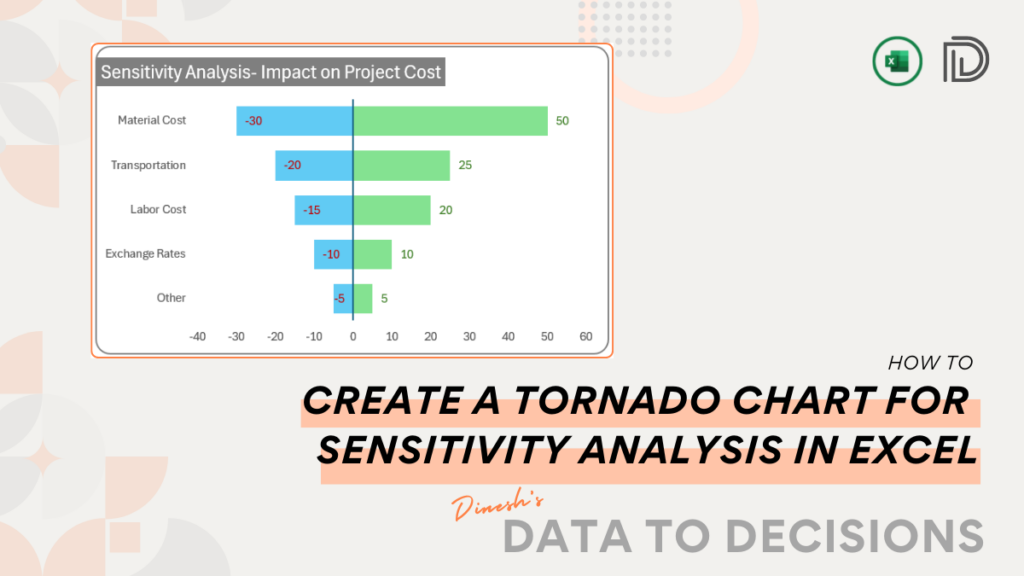
In this post, you'll learn the simple steps required to create a tornado chart for sensitivity analysis in Microsoft Excel.
Learn how to create a floating bar chart in Excel to visually compare ranges in data effortlessly. A truly unique
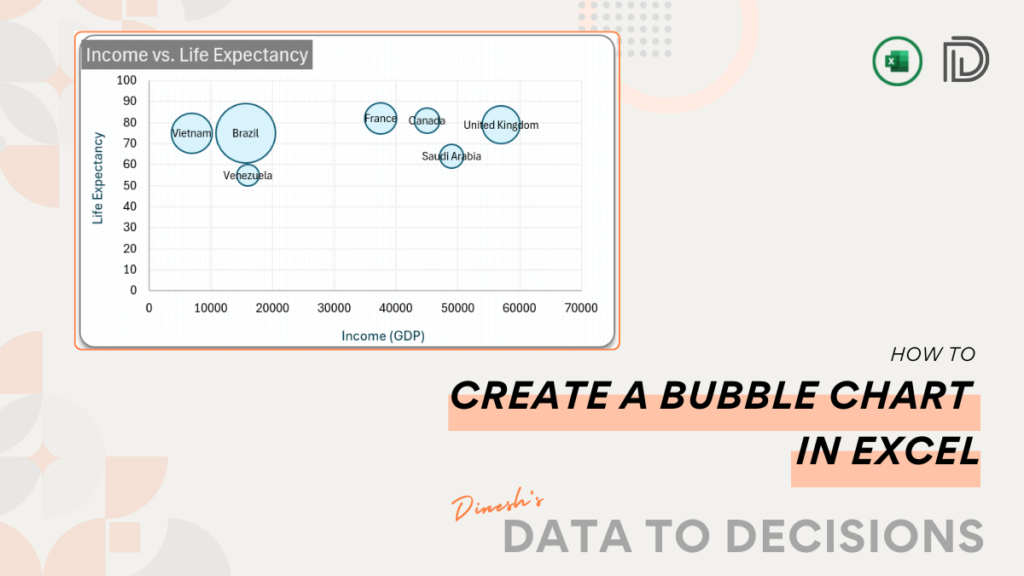
Learn how to create a bubble chart in Excel to visually compare three sets of data effortlessly. Perfect for data
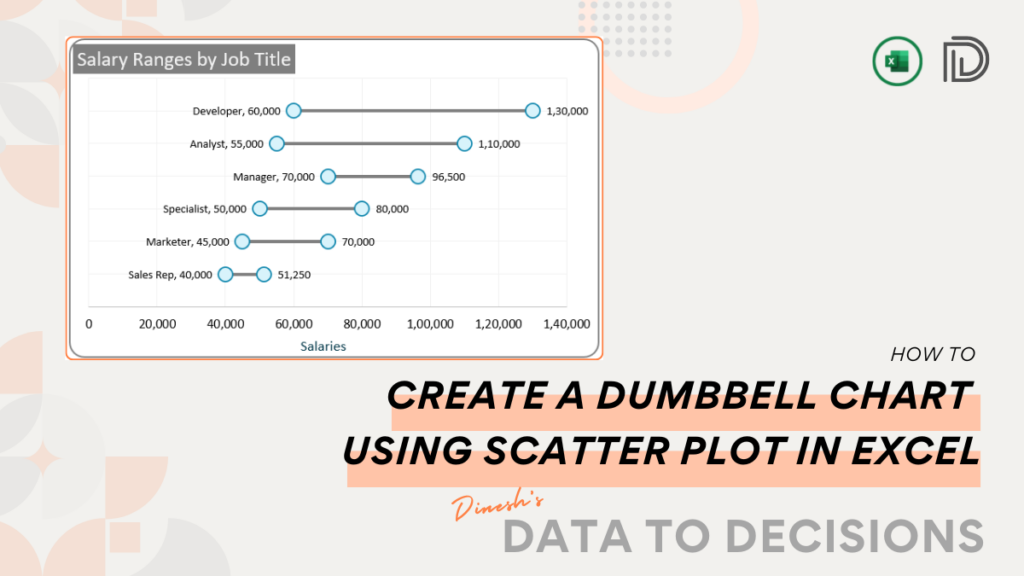
Learn step-by-step how to create a dynamic Dumbbell Chart using a Scatter Plot in Excel to elegantly display ranges in
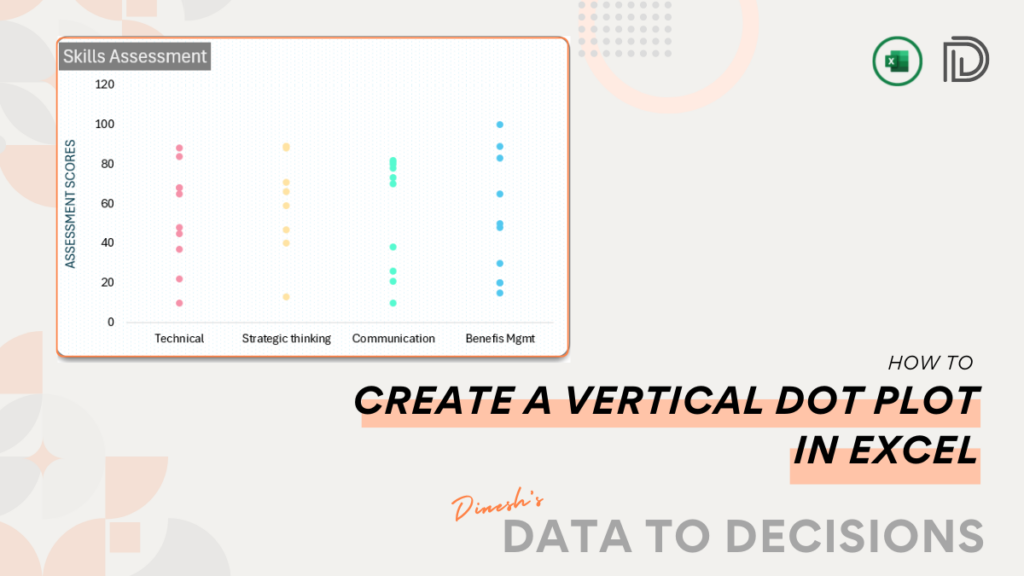
Learn how to create a vertical dot plot in Excel with this post. Create this chart and make your distribution
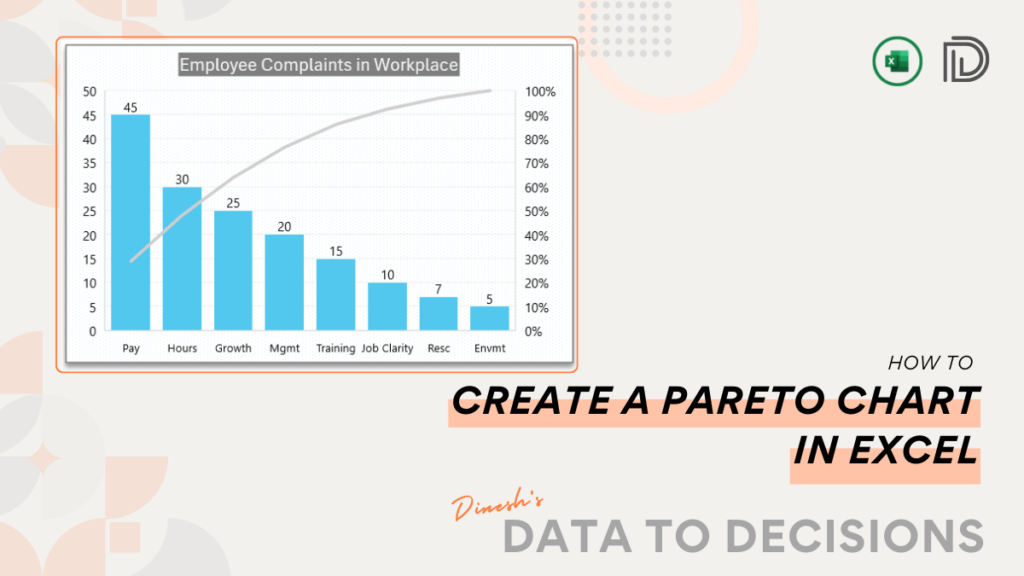
This blog is all you need to create a simple Pareto chart in Excel. Analyze the influencing factors of your
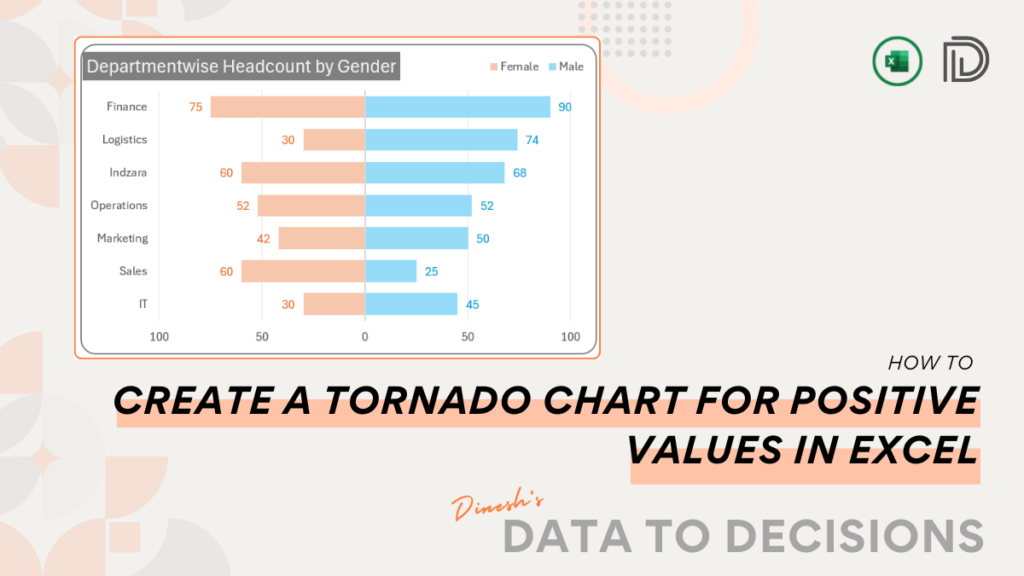
Learn how to create a tornado chart in Excel with our step-by-step post. Perfect for comparative analysis, create this chart
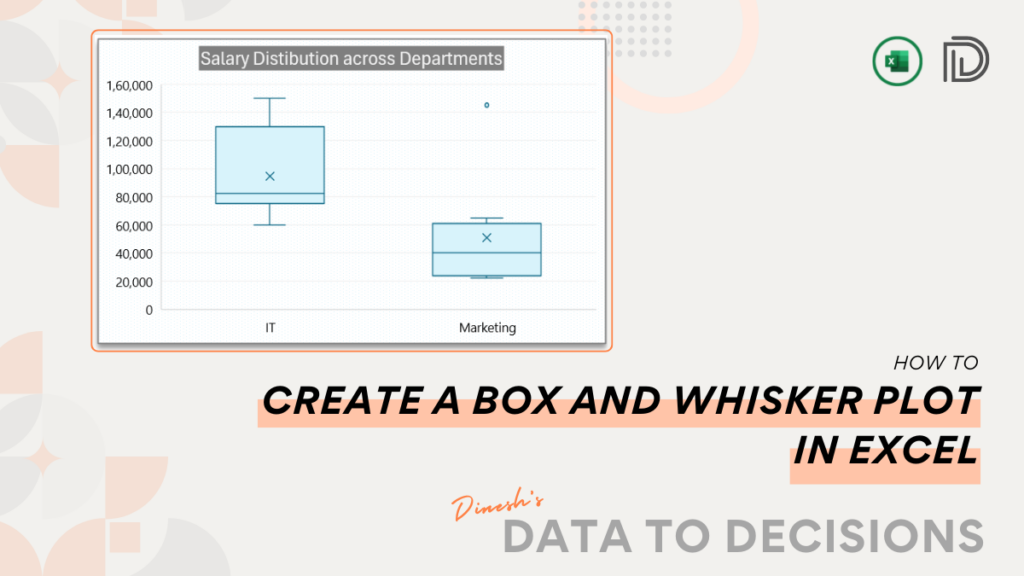
Learn step-by-step how to create a dynamic Box and Whisker Plot in Excel to visually identify the distribution of your
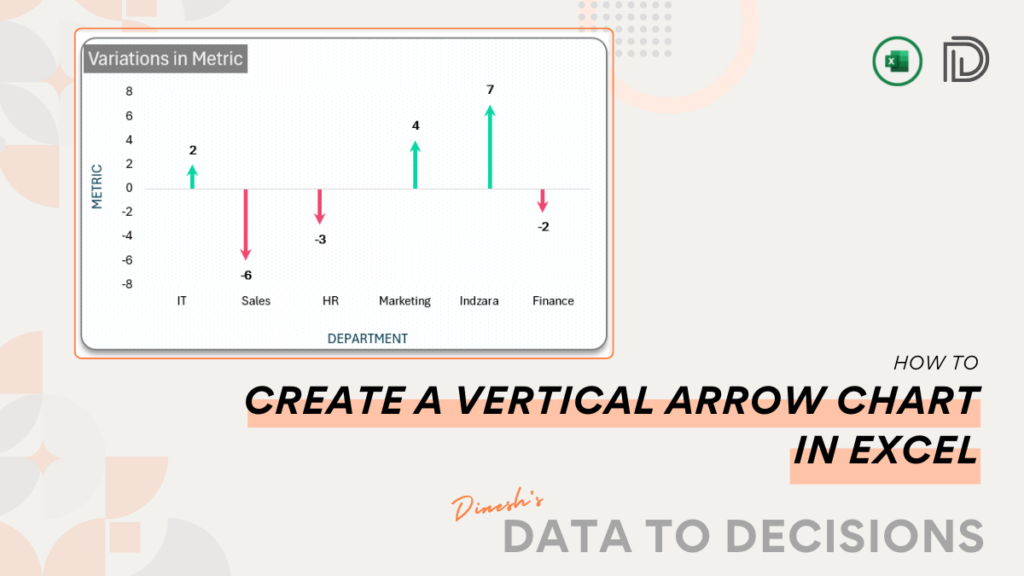
Discover how to create a vertical arrow chart in Excel with our comprehensive blog post, featuring clear step-by-step instructions.
Project Management Templates
Stock Market Templates
Data Visualization Templates
Calendar Templates
Other Templates
Join our weekly Newsletter
Sign up to transform your Excel skills.
Thank you!
Please check your email to confirm subscription.


