Description
A simple and effective solution to Sales Pipeline Management. CRM Sales software that provides visibility to your sales funnel and enables you to take smart decisions to improve conversion and increase sales.
BENEFITS OF SALES PIPELINE EXCEL TEMPLATE
- Understand the effectiveness and efficiency of your sales funnel or pipeline.
- Determine any weak areas in your sales funnel. Take actions to improve conversion rate.
- Identify any bottlenecks in the sales process. Take actions to shorten the sales cycle.
- Know exactly how rich the currently active pipeline is. Allows forecasting of future sales.
- Actionable insights on what type of deals are successful. Allows prioritization on those deals.
- Track all activities related to customer relationship management in one file.
HIGHLIGHTS
- Automated & Interactive Dashboard with Sales Funnel KPIs
- Actionable Insights on what type of deals are working
- View Active Pipeline with projected sales by month and expected deal value
- Simplified data management by tracking all your sales deals in one sheet
- Easy to customize. Customize (up to 12) Sales funnel stages. Customize attributes & Dashboard
- Data Validations in place to ensure good quality data
- Track all sales activities related to customer and prospect communications
- All In One File – 2000 deal limit (default) can be extended easily if needed
AUTOMATED & INTERACTIVE DASHBOARD
Sales Funnel KPIs
The Sales Pipeline Excel Template provides a fully automated and interactive dashboard with effective Sales Funnel KPIs.
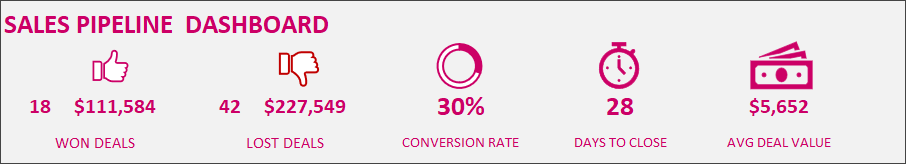
View the Key metrics Won Deals, Lost Deals, Conversion Rate, Avg Days to Close Deal & Avg Deal Value.
Sales Funnel performance
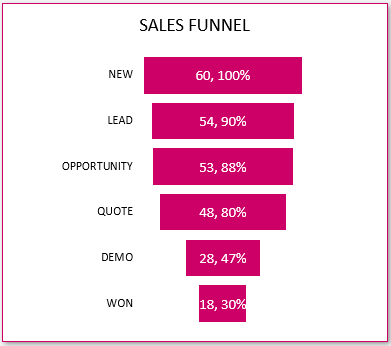
View number of deals that go through each stage of your pipeline process. Know which stage the deals are dropping off. Take actions accordingly to refine the deal selection process or improve the specific stage activity to increase conversion.
Time Taken to Close Deals (Sales Velocity)
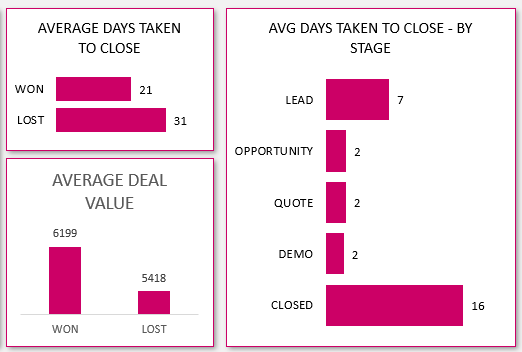
The Dashboard shows how many days in average it takes to close a deal. You can see how many days it took to close a deal won versus a lost deal. It also shows how long each stage of your sales funnel took. This allows you to identify any bottlenecks in your sales process and improve sales cycle efficiency.
Deals Lost – Lost Reason
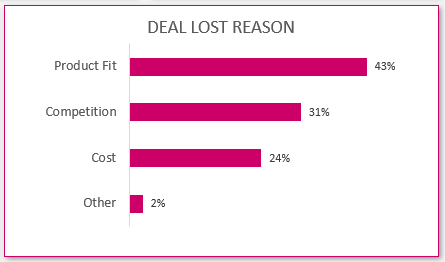
Every sales pipeline will have deals lost. It is important to understand why deals are lost. The Dashboard shows the top reasons why deals are lost. This will enable you to work on those prioritized reasons and thus improve the conversion rate.
You can filter the Dashboard by 5 different attributes and the Deal Created Month.
ACTIONABLE INSIGHTS
One part of the Dashboard focuses on generating insights about what type of deals are being successful. By using that, you can focus on doubling down on those type of deals and/or work on the weak areas to improve their conversion rates. The key here is the valuable information at your fingertips to make smart decisions to improve sales.
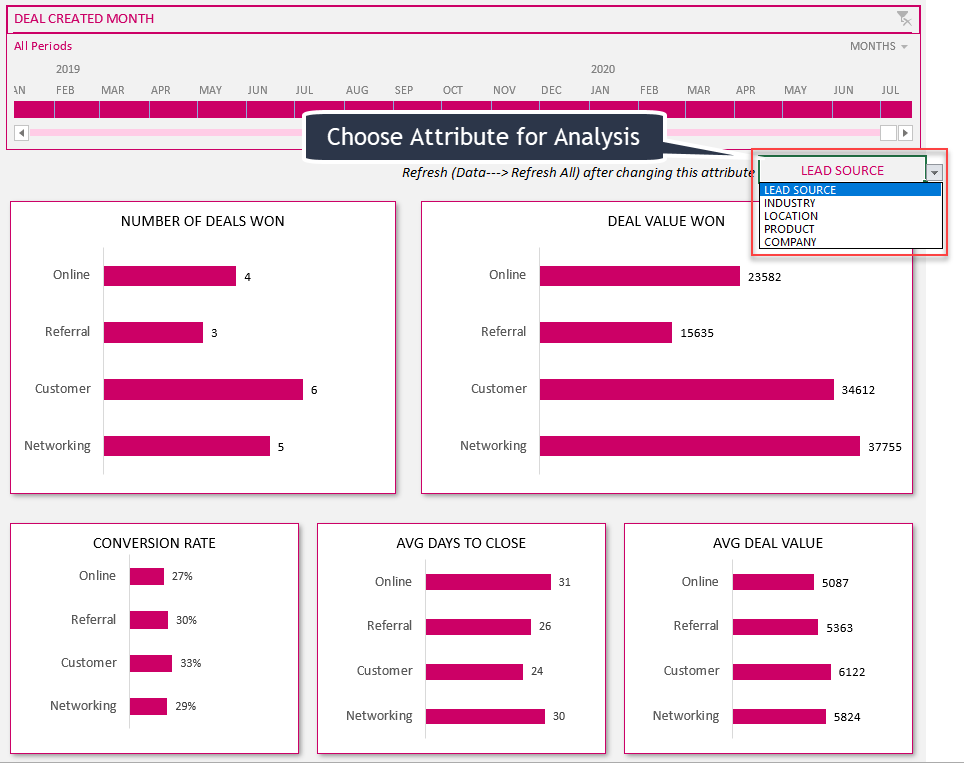
The Sales Pipeline Excel Template allows 5 customizable attributes that you can track for each deal. You can then choose one of those attributes and get valuable insights. For example, in the above screenshot, we are using Lead Source as the Attribute. We can see how many deals are won and lost from each lead source. Conversion rates are highest from referrals while lowest in online leads.
You could get similar insights on which industry and location you are successful, which product is more successful, etc. The amazing part of this is that you can choose what attributes are relevant to your sales process.
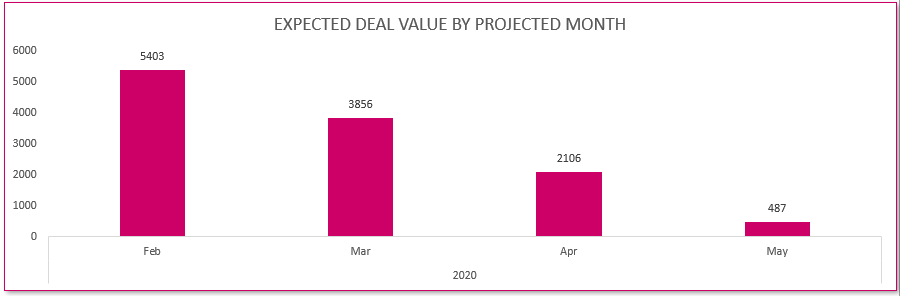
VIEW ACTIVE PIPELINE WITH PROJECTED SALES
The Sales Pipeline Excel Template provides visibility to active deals (deals that are still open without a decision being taken).
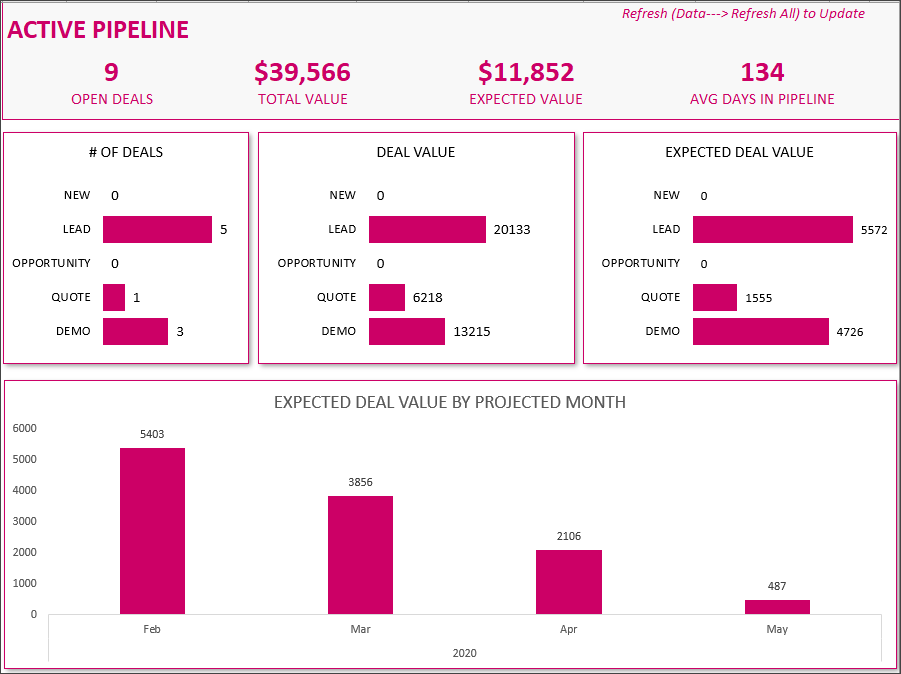
You can see the number of deals open, total deal value and also the expected value.
Expected Value is calculated based on deal value and Win % Expected. You can enter a Win % for each deal based on your estimation of success of that deal. The template will then use that to calculate expected deal value.
Forecasting: In addition, you can enter the projected closing date of open deals. This will be used to show the projected sales in future months.
SIMPLIFIED DATA ENTRY
All the insights you get out of the Sales Pipeline Excel Template do not require a lot of data entry in many different sheets. It’s actually in only one sheet where you enter your deal information.
One row for each deal – Enter the relevant information as outlined in the template. Add more columns to the right if you need.
CUSTOMIZE TO YOUR NEEDS
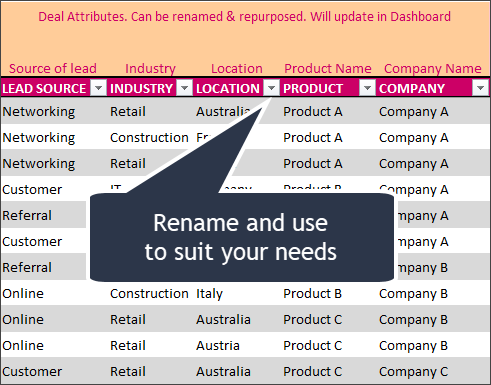
Attributes / Columns
In data entry, you can also customize most of the columns to your needs. Columns are highlighted with information on which ones can be renamed and repurposed.
For example, all 5 deal attributes can be customized.
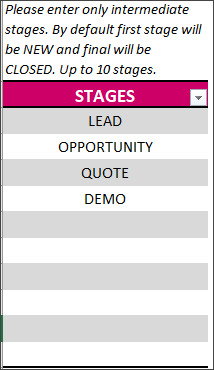
Stages
Stages can be renamed as you need. There can be up to 12 total stages. If you have fewer stages, enter only the names of those stages. The Sales Pipeline Excel Template is very flexible to accommodate your unique sales process.
Dashboard modifications
If you would like to change the size or location of each of the charts in the Dashboard, it is very easy. Just unlock using password ‘indzara’ and move the charts or resize.
DATA VALIDATIONS
Of course, the Dashboard and insights are useful only when it is accurate. So, there are several validations put in place to detect incorrect or invalid data entries.
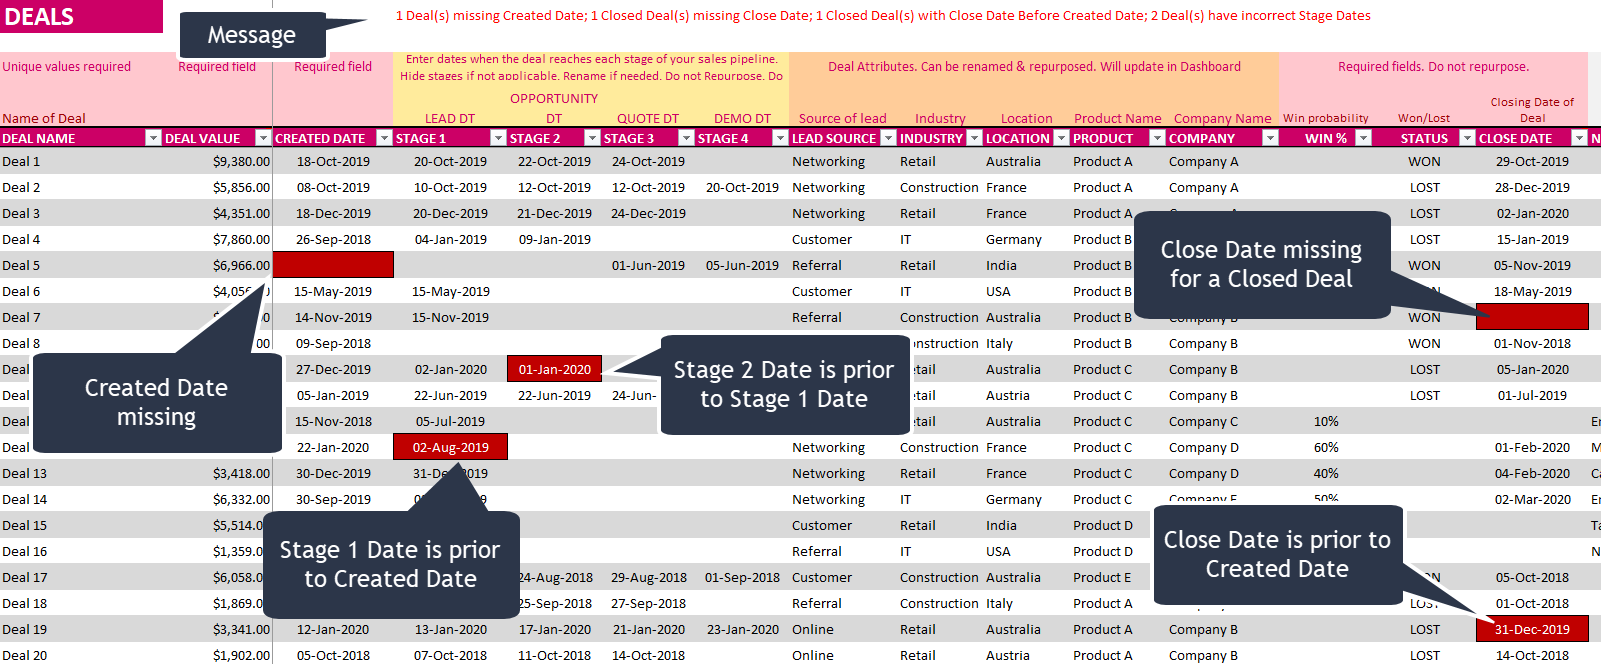
If there are any errors, a message will appear at the top of Deals sheet, clearly specifying the error. Also, red rectangles will appear on exactly the cells where there is an error. This allows you to quickly rectify the error. Error deals are not included in Dashboard to avoid incorrect results in Dashboard.
SALES ACTIVITIES TRACKER
The Sales Pipeline Excel Template has a small module for tracking all sales activities related to customer and prospect communications.
The Activities sheet allows you to enter the Activity Date, Deal name, Activity Type and Notes about the activity.
This simple sheet can be the one place repository for all your notes about your sales leads. With this, you can trace back your past interactions.
In addition, if you need to be reminded of any follow-up activity, just enter a future dated activity date and deal name. The template will show how many activities are due today and how many are past due.


I must say that the Sales Pipeline Manager has proven to be an invaluable tool for centralizing data in one place. The ability to access and analyze data has been incredibly helpful in preparing effective strategies. Being able to track closed deals on a monthly basis, assess product performance, and monitor various sales metrics has been a game-changer. Additionally, the feature that stands out the most is the ability to measure the time taken to close deals, providing crucial insights into our sales efficiency.
I wholeheartedly recommend this product to Sales Managers. It has proven to be a powerful strategy tool that empowers teams to make data-driven decisions and optimize their sales processes effectively. The Sales Pipeline Manager has undoubtedly contributed to our team’s success, and I believe it can do the same for others in the industry.
Really great template! it helps me a lot in my work to manage our deals. Keep it up! Indzara
A simple to use product that delivery very nice tables or visuals. Very happy with the product as it makes my management job so much easier.
Really no other way to describe it other than “Simple and effective”. Great user interface that just takes a spreadsheet to a higher level.
It’s very interacting xL spreadsheet , it’s really a useful tool those how are in direct and undetected sales
Thank you for sharing us your valuable feedback.
Best wishes.