Employee Net Promoter Score – Google Sheet Template
Attention HR Managers!! Are you looking for a seamless way to gauge employee loyalty and satisfaction without the hassle?
Dive into our Employee Net Promoter Score Google Sheets template, crafted to deliver actionable insights on employee satisfaction.
Transform your employee feedback into a visually clear, easy-to-understand dashboard and make data-driven decisions that truly resonate. Discover the power of informed HR decision making today!

Before we get on how to use the template and its features, let us first see in brief what is Employee Satisfaction, and why is it important.
What is Employee Satisfaction?
“Employee satisfaction gauges an individual’s contentment with their job and workplace environment.” Key elements include pay, leadership quality, teamwork, company culture, and work-life balance, to name a few. For Human Resources managers, monitoring these factors aids in pinpointing areas of enhancement within the organization.
How to measure it?
Since employee satisfaction is important, it is pertinent to measure the same. Various organizations have different approaches to measuring employee satisfaction, few of the widely used metrics are:
- Employee Net Promoter Score
- Employee Satisfaction Index
- Absenteeism Rate
- Employee Turnover Rate
Read more about these metrics here: https://www.aihr.com/blog/employee-satisfaction-metrics/
This dashboard encapsulates the Employee Net Promoter Score and the Satisfaction Index metrics.
ENPS (Employee Net Promoter Score):
The Employee Net Promoter Score (NPS) is a simple yet powerful metric used by organizations worldwide to gauge employee loyalty.
Employee NPS is based on a single, straightforward question: “How likely are you to recommend this organization as a workplace?”
Depending on the scores received, the NPS = % of Promoters – % of Detractors
ESI (Employee Satisfaction Index):
ESI, or the Employee Satisfaction Index, is a comprehensive metric that reflects the overall satisfaction levels of employees based on a specific questionnaire.
The ESI is calculated by summing all employee scores and dividing it by the maximum possible score, then multiplying the result by 100. This gives organizations a clearer understanding of their workforce’s contentment and areas of potential improvement.
Benefits of calculating Satisfaction Metrics:
- Simple & Direct: NPS offers a straightforward method to measure employee loyalty with just one question whereas ESI is used to measure satisfaction.
- Actionable Insights: Easily identify areas of improvement and act upon feedback to foster a more positive work environment.
- Benchmarks: Compare your organization’s scores with industry benchmarks to understand your organization’s standing.
- Promotes Open Communication: Encourage employees to voice their opinions, promoting a culture of openness and feedback.
Downloads
How to use the Employee Net Promoter Score Template
Once you download the file, you’ll receive an Google sheet template file and a sample file.
Take a copy of the template to your own Google Drive.
The overview of the steps to follow are:
- Step 1: Define the settings
- Step 2: Enter survey data
- Step 3: View the fully automated Dashboard
Now let’s take a detailed look at each step.
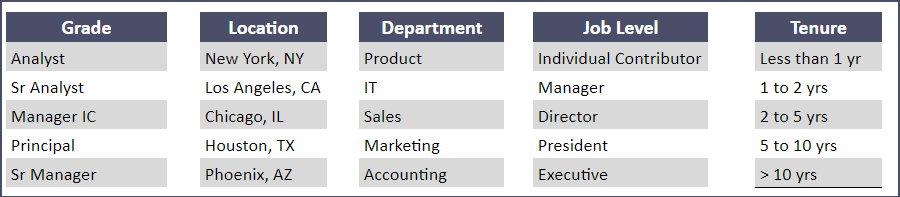
Step 1: Enter Settings
Start by populating the Settings sheet with relevant organizational-level details, this is a very straightforward step.
Step 2:Enter the Survey Data
This sheet contains the responses from the survey collected from all the employees.
Since most of these surveys are anonymous, the input requires you to enter just an identification or a survey number. Along with the organization details, enter the month of the survey and a general survey feedback.
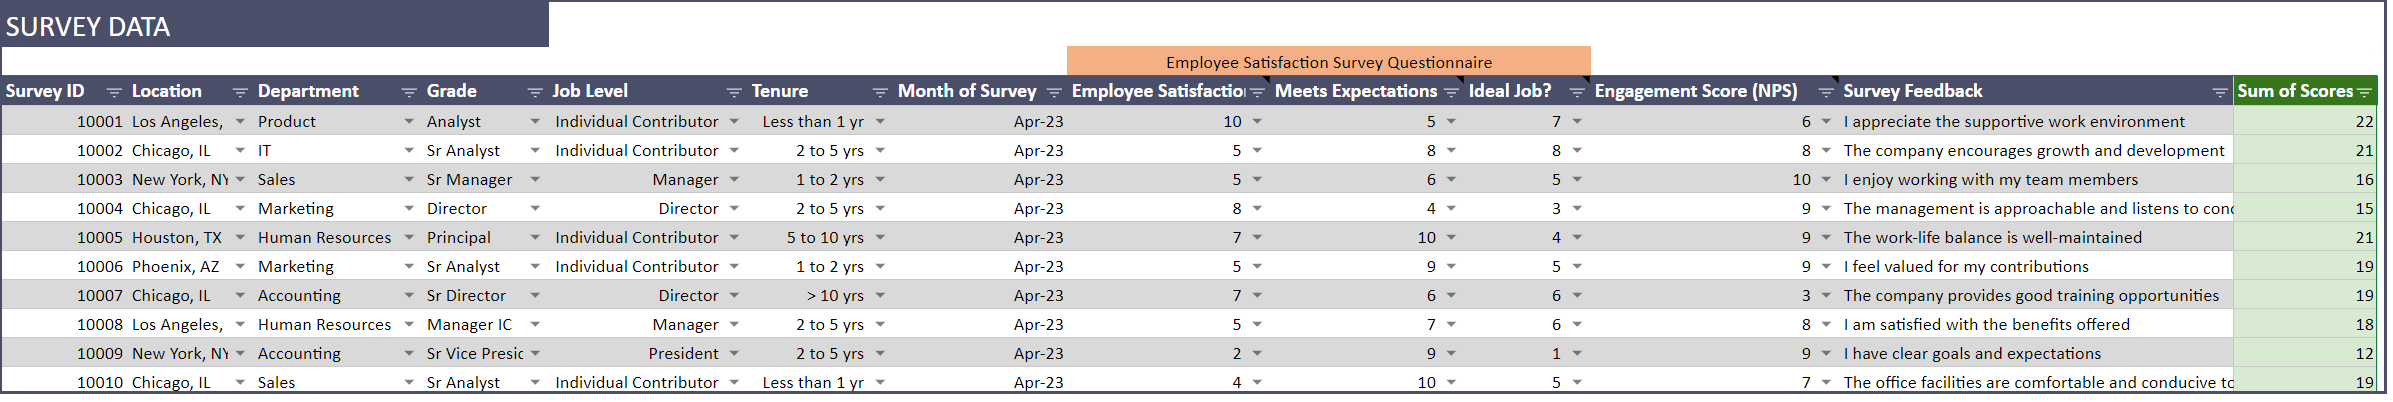
The promoter score is based on a single question: “How likely are you to recommend this organization as a workplace?”
The satisfaction index is generally calculated based on three primary questions:
- How satisfied are you with your workplace?
- How well does your workplace meet your expectations?
- How close is your workplace to your ideal job? and
The answers to these questions are received on a scale of 1-10, enter the same in the columns given.
Step 3: View the Automated Dashboard
Once the data is entered, the dashboard will automatically reflect the NPS and ESI metrics score along with a fully automated Dashboard.
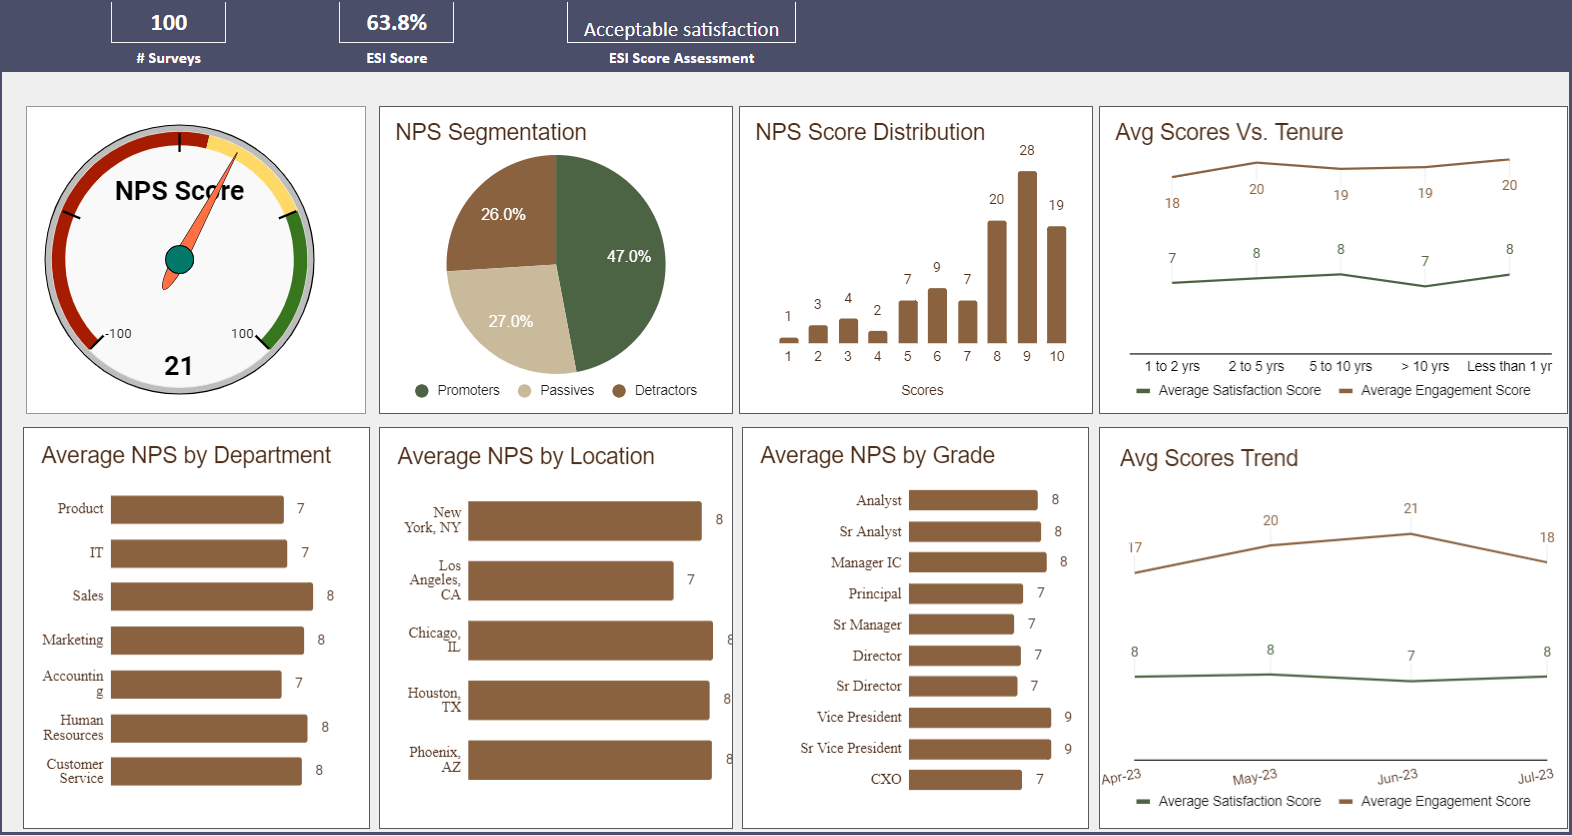
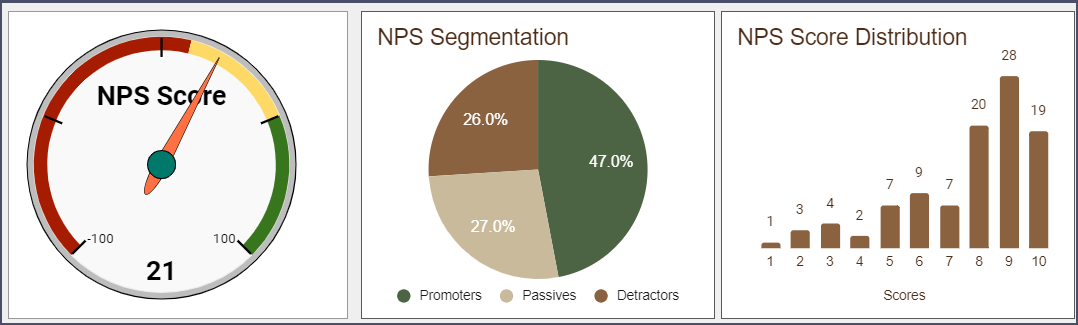
Generally an NPS score of more than 50 is considered excellent, the same is reflected in the gauge chart. Similarly, for ESI, a % between 80 to 100 is considered as “very high satisfaction”.
Read more about the ESI and its calculations here: https://www.linkedin.com/pulse/what-employee-satisfaction-index-get-ahead-by-linkedin-news/
Along with these, the dashboard also gives:
NPS Segmentation: This pie chart breaks down the percentage of Promoters, Passives, and Detractors in your organization. NPS Score Distribution: A column chart providing a detailed breakdown of how many employees gave specific scores.
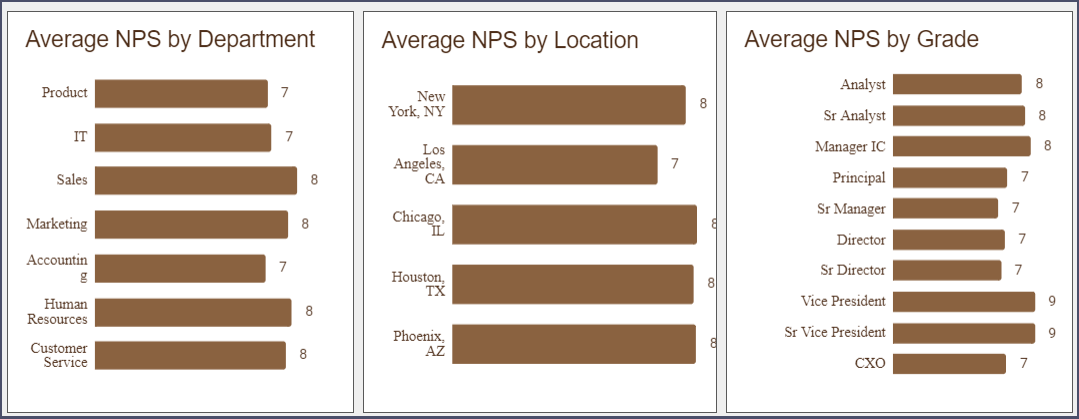
Average NPS by Department, Location & Grade: Understand which departments, locations, and grades are most loyal, aiding in pinpointing areas that may require attention.
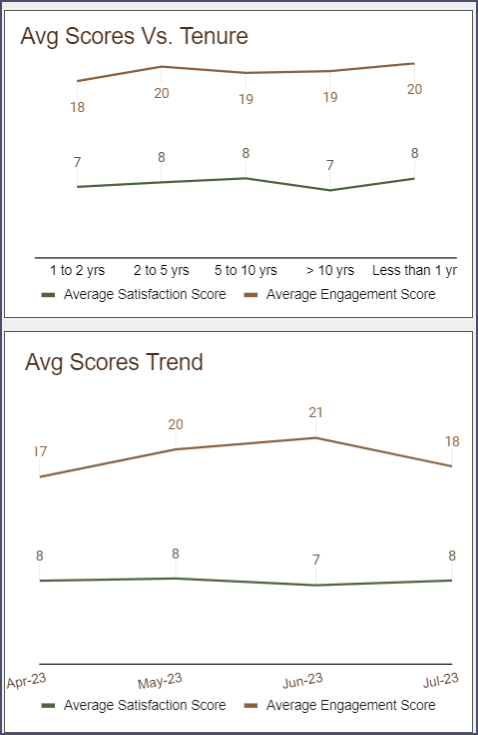
With the trends: Track how employee satisfaction and engagement evolve based on their tenure at the company. And see the trend of average satisfaction and engagement scores over time.
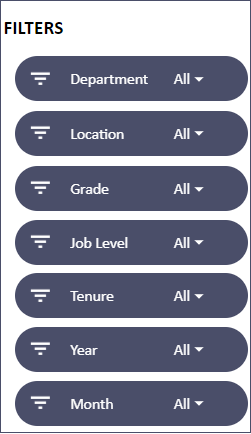
Utilize the filters on the dashboard to drill down the data for further enhanced analysis.
Download our free Google Sheets template today and embark on a journey towards a more satisfied, engaged, and loyal workforce!
Leave a Reply