Timeline Chart – Excel Template
Introducing Indzara’s Timeline Chart Template!!
When planning and executing any project, visual representation plays a pivotal role in ensuring clarity, alignment, and timely execution.
Our Excel Timeline Chart Template is designed to be an essential tool for project managers, team leads, and anyone responsible for tracking project progress. It’s simple, user-friendly, and most importantly, effective.
Get a fully automated timeline chart with simple user input almost instantly!

Downloads
Why Visualize Your Project’s Timeline?
- Clarity and Focus: Visual representations ensure that everyone on the team understands the project’s phases, milestones, and deadlines. It removes ambiguity and promotes a focused approach.
- Enhanced Communication: With our template, communication is streamlined. Quickly grasp the timelines of each phase/activity to plan better, and plan ahead!
- Efficiency and Productivity: Visual timelines empower teams to identify bottlenecks, optimize resource allocation, and anticipate potential challenges well in advance.
Be it the project you are leading, your personal projects, or any task that requires a timely deadline, this is the template for you to visualize your progress!
Features of the Timeline Chart Excel Template
The following are the highlights of the template.
- Simple to Use: All that you need is a single Excel sheet to have all your input data and to visualize your project’ progress.
- Automated Dashboard: Get the fully automated timeline chart, instantly! No more running through tutorial blogs or videos, just enter your data and view the timeline chart!!
How to use this Template?
Once you download the file, you’ll receive an Excel template file and a sample file.
The overview of the steps are:
- Step 1: Define the settings
- Step 2: Enter project data
- Step 3: View the fully automated timeline chart!
Now let’s take a detailed look at each step.
Step 1: Enter Settings
Start by defining your project’s unique attributes. This includes listing out the various activities, resources who’ll be working on the project, deciding on priority levels, and determining status labels such as “completed”, “in progress”, and “yet to start”.
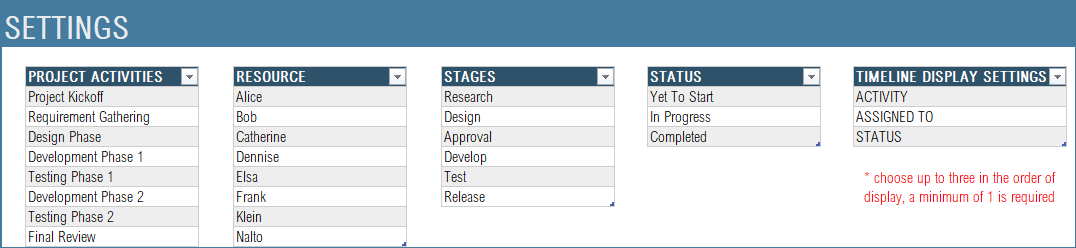
The template also provides you with an option to choose what gets to be displayed in the Timeline chart. Enter the same in the Timeline Display Settings as shown above.
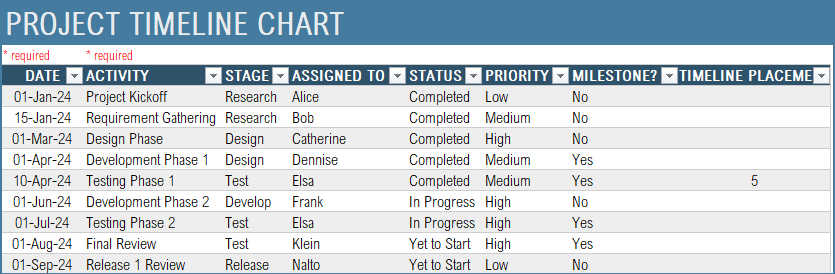
Step 2: Populate the Data Sheet
Here, you will key in your project data. This includes activity dates, list of activities, its stage, assigned personnel, priority – every detail finds its place here.
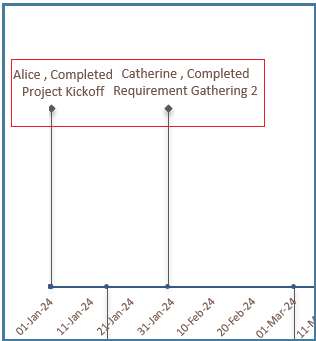
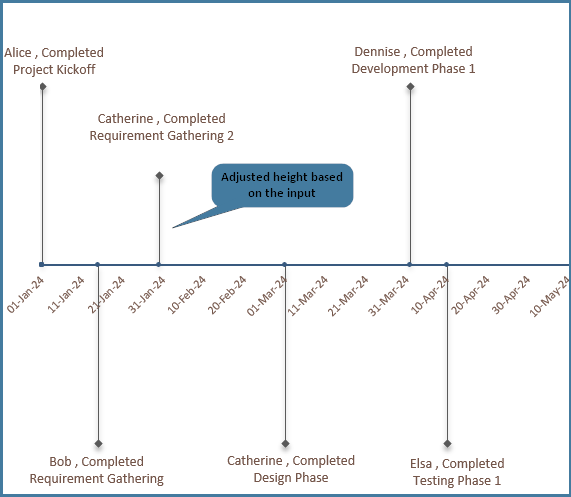
By default the template is designed to show project activities at a fixed placement from the date axis. This can be customized as well. In the given example below, the there are two phases of requirement gathering, that seems to overlap in the timeline chart.
To resolve this and make the chart look easily readable, you can adjust the default placement settings using the Timeline Placement Column as shown:
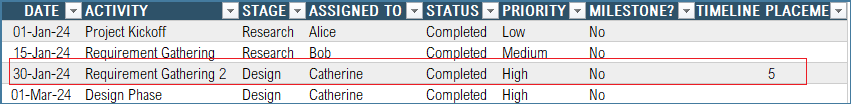
This will adjust the visual accordingly. Ensure to adjust the timeline details based on the height.
Step 3: Visualize the Timeline Chart
Once your data is in, you can immediately view the Timeline Chart in the same sheet. Your project’s timeline will be presented as a visually appealing chart that gets populated with your inputs.
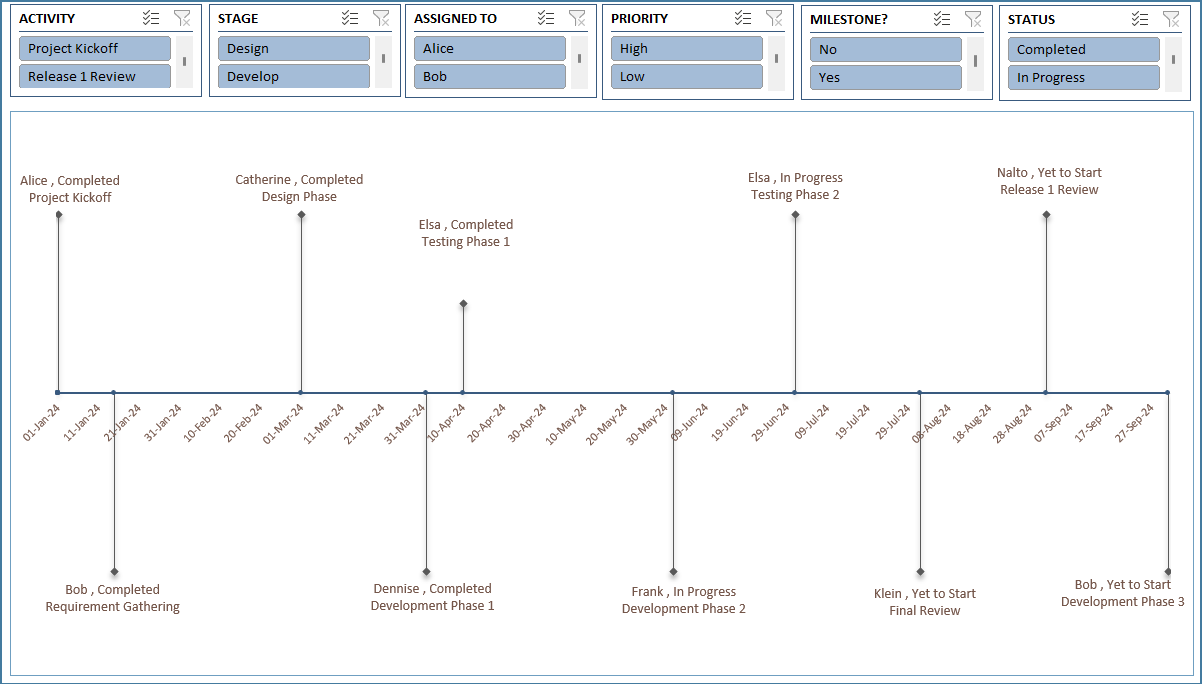
Use the slicers to view milestone project activities, its priority, or any other project detail.

Bring clarity, efficiency, and precision to your project management process with our Excel Timeline Chart Template. It’s more than just a tool; it’s a game-changer for visualizing project timelines.
Download now!
Recommended Template
-
 Gantt Chart Maker Excel TemplateOriginal price was: $25.$20Current price is: $20.
 -
Task Manager (Advanced) – Excel Template$45
Leave a Reply