
Description
Are you looking for a simple and effective way to do technical chart analysis of stocks in a spreadsheet?
Do you want to type in any stock ticker symbol and get technical indicators automatically calculated?
Would you like to be able to look at multiple indicators at the same time?
Are you interested in trading smartly using sound data analysis?
Do you prefer to have the flexibility of an Excel spreadsheet to customize and extend your analysis?
Look no further. We present to you our ‘Technical Analysis Pro Excel Template’ – Stock technical analysis Excel Sheet.
Simple & Effective Technical Analysis Tool
Enter a stock ticker symbol and immediately see live market data and technical indicators. That is it. As simple as it gets.
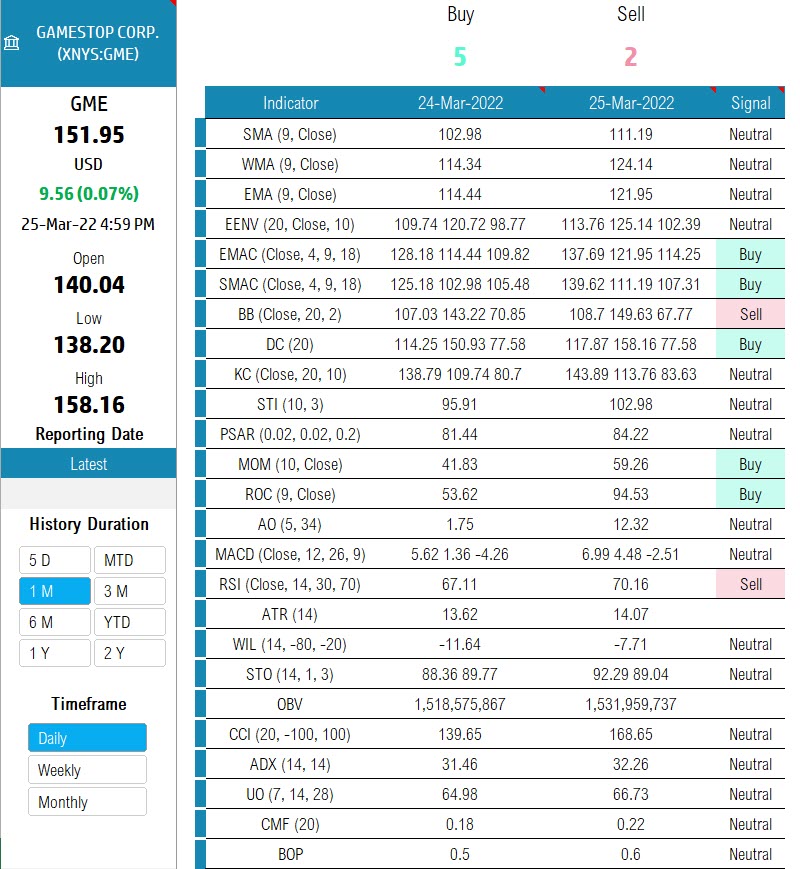
You can see the indicator values as well as trading signals.
5 Charts – You can view up to 5 indicators at a time
Candlestick Chart: View candles for any specific date range for your favorite stock.

Signal Chart: Choose a technical indicator and see the trading signals (Buy/Sell/Neutral).
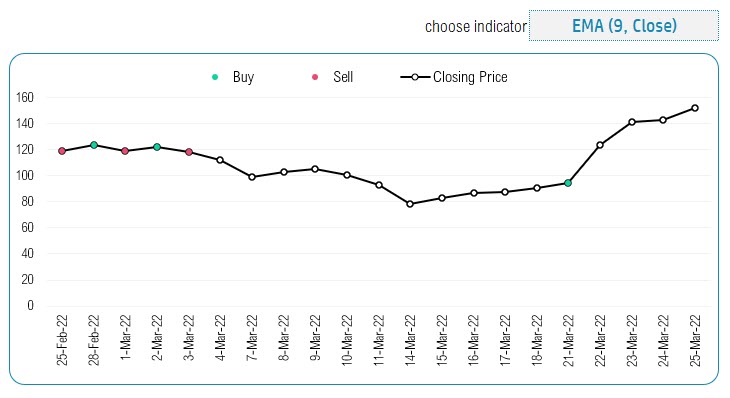
DISCLAIMER: We do not provide any trading or financial advice. The template uses Excel formulas calculate mathematically the technical indicator values and applies specific rules or conditions to determine Buy/Sell signal. They are documented in our support portal.
Multiple Indicators Chart: Choose two different indicators to view along with price line.
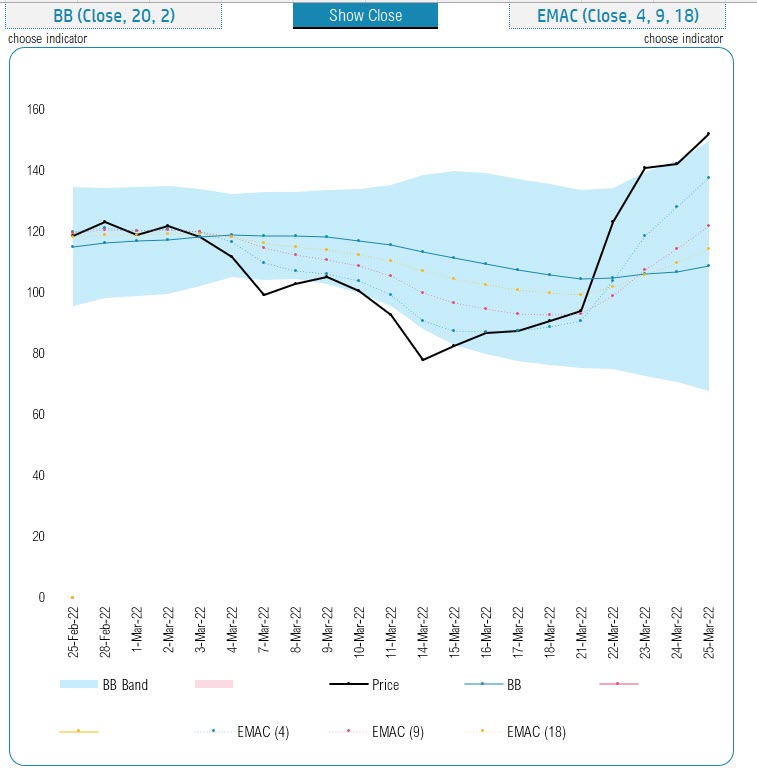
In the screenshot above, we are looking at Bollinger Bands as well as EMA Crossover indicators.
More Charts: You can also view 2 charts with one indicator each.
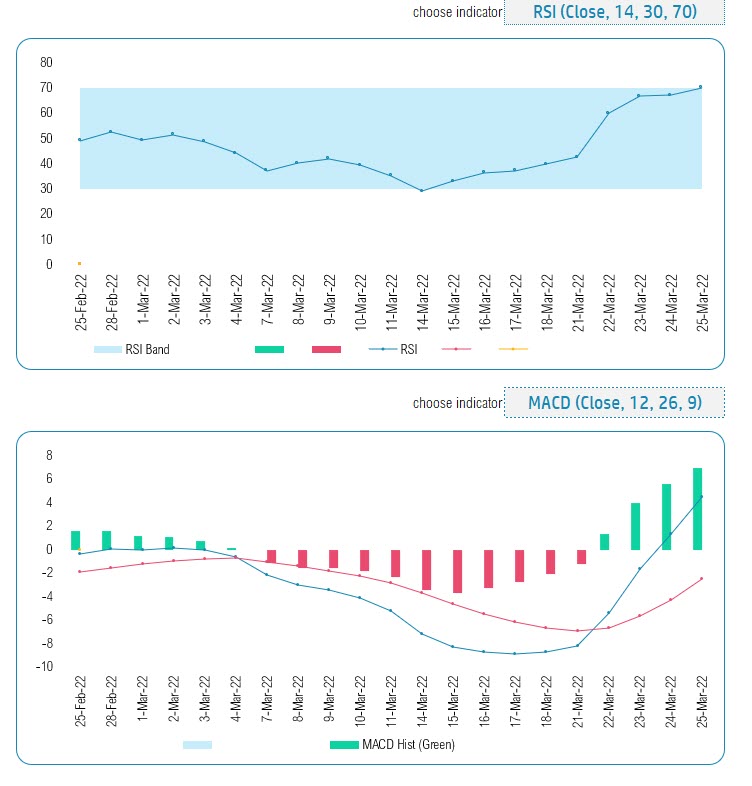
In the above screenshot, we are viewing RSI and MACD.
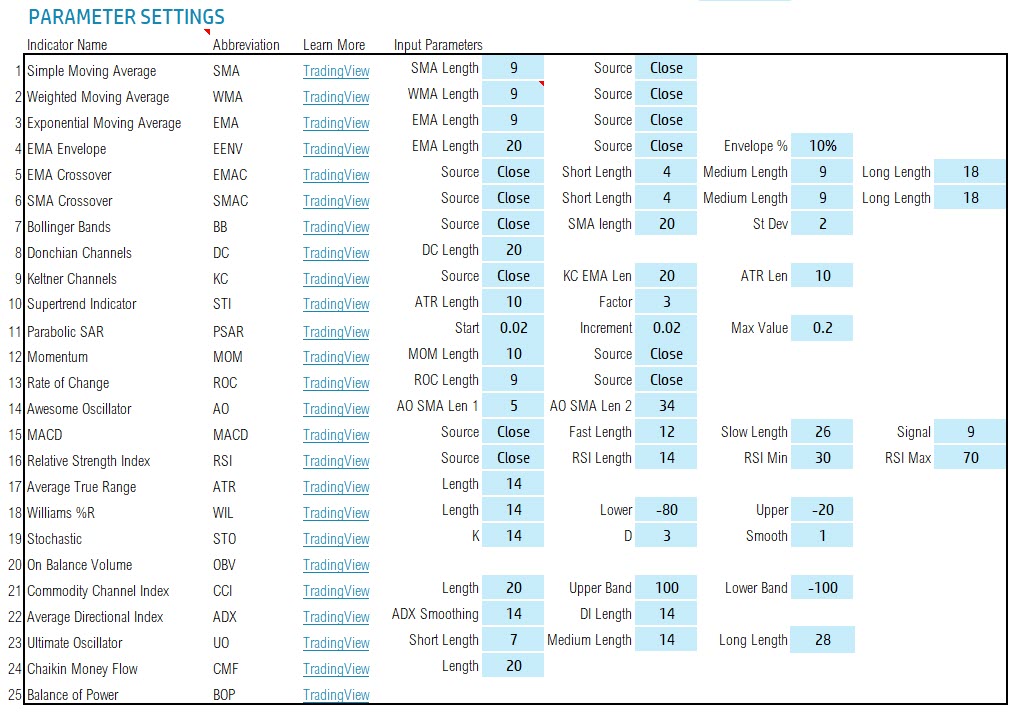
25 Technical Indicators
The following technical indicators are included in the Stock technical analysis Excel Sheet template.
- Simple Moving Average
- Weighted Moving Average
- Exponential Moving Average
- EMA Envelope
- EMA Crossover
- SMA Crossover
- Bollinger Bands
- Donchian Channels
- Keltner Channels
- Supertrend Indicator
- Parabolic SAR
- Momentum
- Rate of Change
- Awesome Oscillator
- MACD
- Relative Strength Index
- Average True Range
- Williams %R
- Stochastic
- On Balance Volume
- Commodity Channel Index
- Average Directional Index
- Ultimate Oscillator
- Chaikin Money Flow
- Balance of Power
If you need to replace any with indicators of your choice, please email support@indzara.com with your requirements. We take on development projects for a fee and we can provide an estimate to based on your requirements.
Accurate Calculations of Technical Indicators
We have tested each technical indicator’s results with TradingView.com and ensured that the calculations are 100% accurate.
Customize the Technical Indicators by controlling the Parameters
You can modify the parameters of the indicators anytime. By this way, you can do the analysis as YOU prefer.
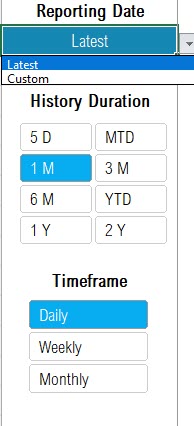
Control the Stock History Data and Timeframe
You can choose to look at latest data or data in the past.
You can also toggle between daily, weekly and monthly timeframes.
Hear what our clients have to say about the template!
Easy to Extend
If you need to add any sheets to the Stock technical analysis Excel Sheet template , feel free to. It’s a simple Excel spreadsheet where you can add sheets and do your additional analysis. No Macros are used.
Requirements
You can download the Stock technical analysis Excel Sheet, and open using Microsoft Excel in your computer (PC or Mac). It will also work in browser (Excel for Web).
The template performs all the calculations of the technical indicators, however the stock market history data comes from Microsoft’s service. You will need a Microsoft 365 subscription to get live market data into the template.
Please find the list of Stock Exchanges that are supported using this template by clicking here.
Microsoft 365 subscription is the most popular suite of Office apps including Word, Excel, PowerPoint, Teams, Outlook, OneDrive & more. It also includes cloud storage of 1TB.
If you already have a subscription then you don’t need to purchase anything new. Stock market history data is already included in your Microsoft 365 subscription.


I’ve tried multiple trading analysis, but this one stands out “Technical Analysis Pro Excel Template (25 Technical Indicators)” is a game-changer! It has helped me to identify current trend how the scrips are performing.
Hi Friends I’m using Technical Analysis Pro Excel Template (25 Technical Indicators) from last one year. Really its very use full and awesome.
It is very simple to use and we can analyze stock easily.
I one word we have to say means its worth for money .
One word …… Spectacular!!! To say the least!
Simple and easy to use!
I like the products.
Very usefully & help sheet is this.