2023 Employee Annual Bonus Planner Power BI Template
Employee annual bonus calculations made easy with a simple Power BI template. Enter data in a single excel sheet and establish a one time connection with Power BI to get a fully automated Dashboard and all employees’ bonus details.
With minimal time spent on data entry get the most out of this bonus planner with an interactive dashboard to aid in informed decision making.
This template supports the most commonly used method of calculating the employee bonus: based on the employee, department and organization’s performance.
This template is designed for Microsoft Power BI, but if you are looking for an Excel template, please visit Employee Annual Bonus Planner in Excel or if it’s a Google Sheet template, please click visit Employee Annual Bonus Planner in Google Sheets.
The input for the bonus planner Power BI is made into an excel file. This requires you to enter primary employee settings details and the performance setting which are the bonus weightage per grade defined as per your organization’s requirements.
Once these data are given and a connection with Power BI made (which is discussed later in this post), get amazing dashboards and a detailed Bonus details, all within a few minutes!
Also, get instant access to key performers based on Grades, Departments and overall performers based on individual target achievements.
The Bonus details report contains the detailed split up of an employee’s bonus based on individual performance, department and organization based performances as well.
Features of Employee Bonus Plan Template
This simple yet effective Power BI template comes with a whole lot of amazing features:
- Simple data entry process
- Single Microsoft Excel file for all employee data entries for one review period.
- One time connection to Power BI.
- Customize settings based on organizational standards
- Customize the bonus payouts based on employee grades.
- Customize the weightages for each grades by individual performance and of the department and organizations’ performance.
- Practical Features
- All the components of the bonuses along with the overall bonus payout per employee, are automatically calculated.
- Dashboard view with bonus details based on Grades, performance for reporting.
- Ease of Use
- One time settings for employee and performance settings.
- All employee data in a single excel sheet file for one review period.
- Re-use a copy of the same files (both Excel and Power BI) for different review periods.
- Automated Calculations
- Fully automated bonus calculations and interactive dashboard in the powerful Power BI template.
Downloads
How to use the Employee Bonus Planner Power BI Template
Here is the overview of the steps on how to use the template.
Once you download the template, you’ll receive a Power BI file (.pbix), two excel files (template and a sample file)
Here is the overview of steps to use the template.
- Enter all the employee and job-related attributes in the Settings sheet.
- In the Performance settings sheet, enter the bonus targets allowed along with their weightage based on department and organization.
- Enter the achieved targets for each department and the overall organizations’ in the Achieved sheet.
- In the Employees sheet enter the relevant employee details for the particular performance review, whose bonuses are to be calculated.
- Establish a connection with the Power BI file using the steps mentioned here.
- Once a successful connection is established, view the fully automated dashboards in the Power BI report, instantly.
- Once these details are entered, view the bonus % and achieved values calculated based on the given inputs and the interactive dashboard fully automated.
- For any changes made in the excel, please close the excel file after the changes and refresh the Power BI file to get the updated dashboard.
Step 1: Enter Settings
Enter all the employee related details in the Settings sheet as shown here:

Step 2:Enter Performance Settings
In this sheet, based on your organization’ policies, enter the relevant weightage for performance against each grade split into organizational, department and individual.
That is, enter the target bonus for each grade; the maximum payout % decided up on. Along with these enter the split i.e., the weightage for each grade, a sample of which is shown below.
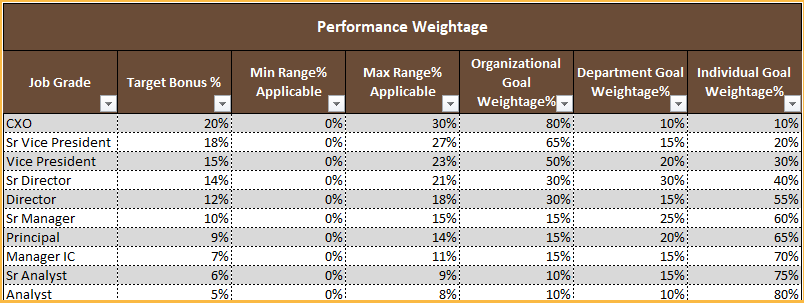
In the above scenario, for the CXO job grade, each employee belonging to that grade is entitled to a maximum of 20% bonus from their salary. Which, further is compartmented into weightages for the individual performance(10%), the department’s (10%) and the overall organizational performance (80%) for the given review period.
It can be observed here in this example, as the grades move up in the organizational hierarchy more weightage is given to the organizational achievements than the departments’ or individual performances.
This may vary based on your company’s bonus payout policies.
Another input here is the maximum % of target bonus that can be made available is also entered.
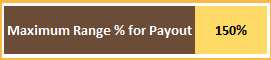
The maximum range applicable is the percentage above the set target bonus, which can be allowed for employees whose performance exceeds expectations.
In the example, the maximum payout range is input as 150% meaning, for the grade CXO, the maximum bonus payout can be 150% of 20% i.e. 24% of the total salary.
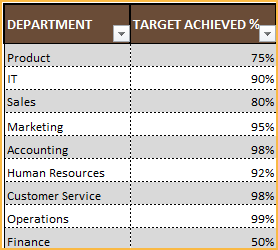
Step 3: Enter Organizational and Department achieved
Now, for this data entry section, we move to the Dept-Org Achieved sheet.
This is also straight forward: enter each department’s target achieved as a % value.
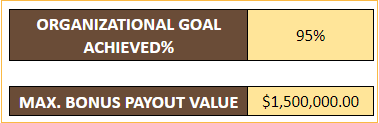
Also, in the same sheet enter the overall organizational achievement % and the maximum payout bonus value.
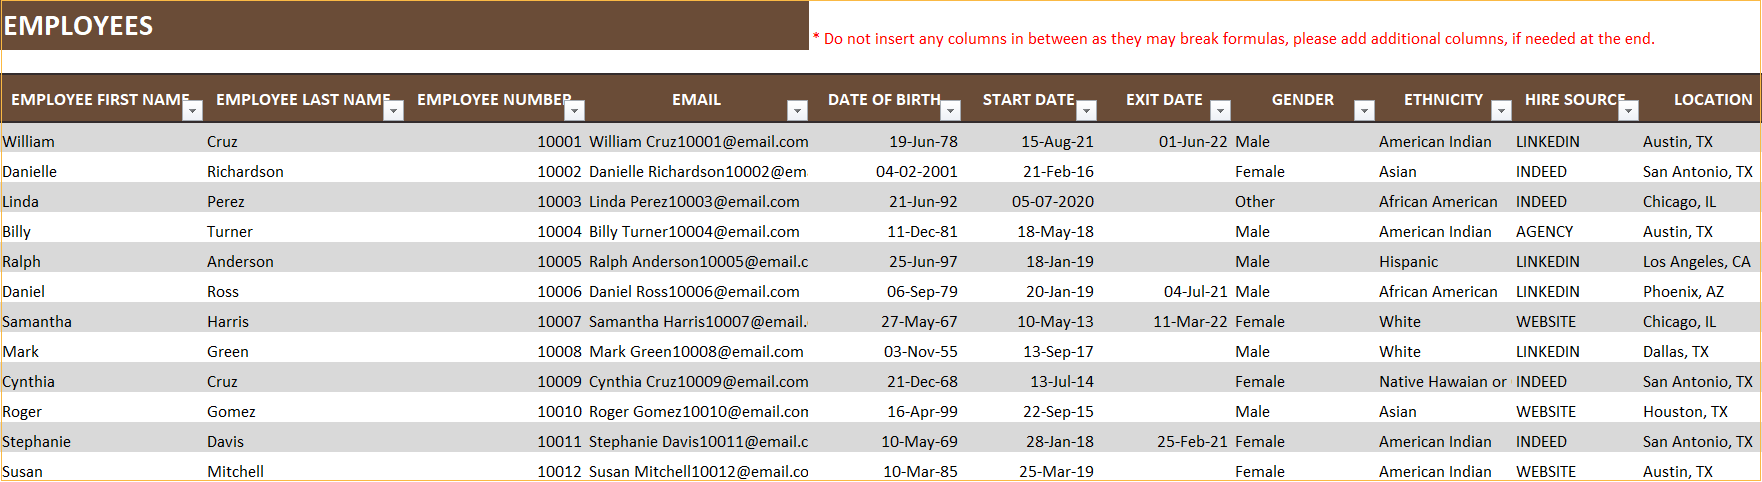
Step 4: Enter Employee Data
In this sheet, enter all the relevant employee details as per the given column header. Also, enter the individual target achieved % for each employee for that performance review period.
Step 5: View Dashboard and Bonus Details
Once the data entry in excel is complete, save the file and copy the link.
Establish a connection with the Power BI file by following these steps. Once a successful connection is established, you can view the fully automated dashboard and the Bonus detail sheet.
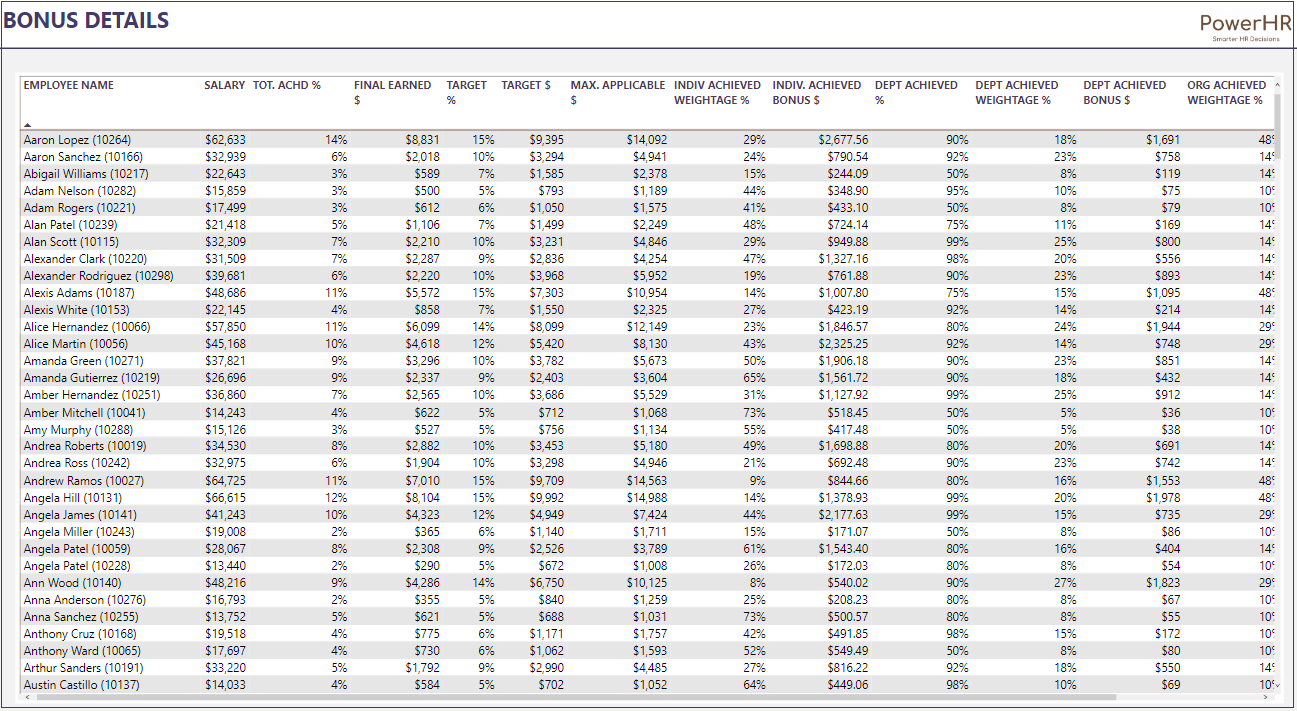
The Bonus detail-sheet shows the detailed view of an employee’s bonus achieved value against their salary.

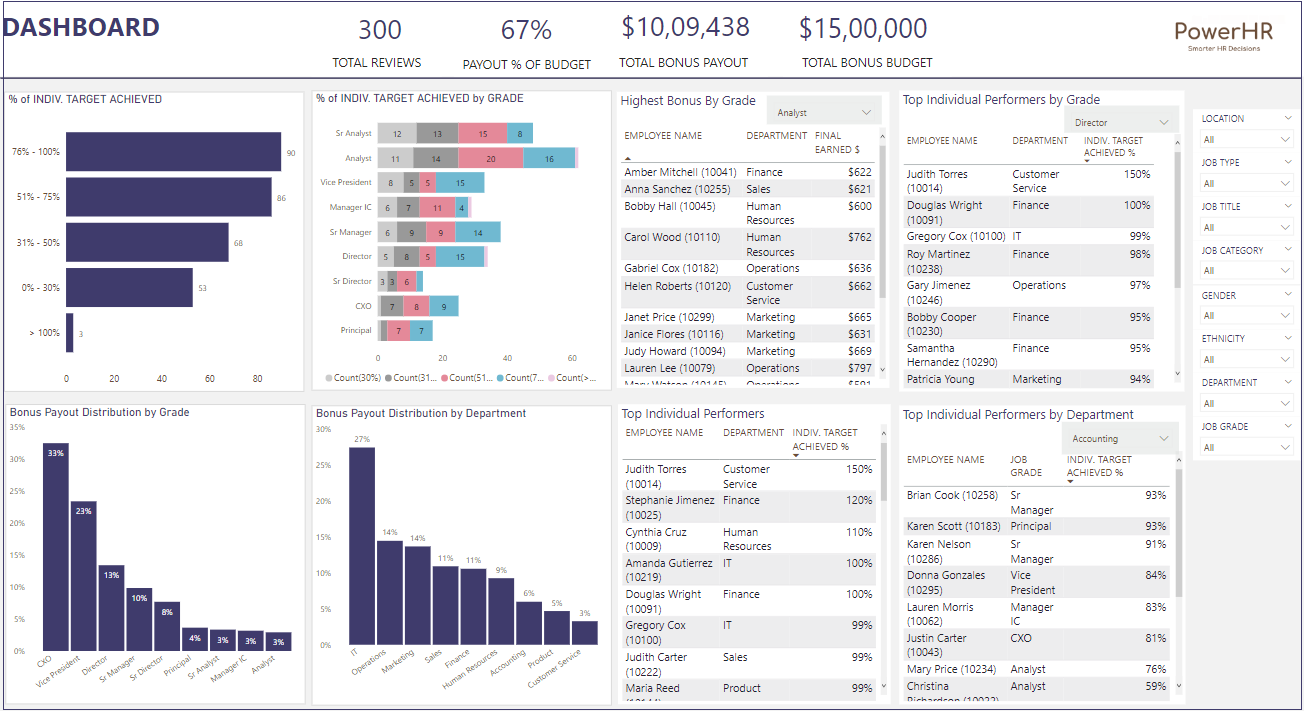
The Dashboard report in Power BI can be used for performance analysis of the bonuses achieved by employees based on grades and department. Along with top perform details, all of which can be used for informed decision making.

The Dashboard shows the overall distribution of individual target % achieved, segregated into different brackets. That is, of the 300 reviews made, 90 employees have an achieved individual target within the range of 76% to 100% (as shown in the chart). The same detail can be viewed based on employee grades.
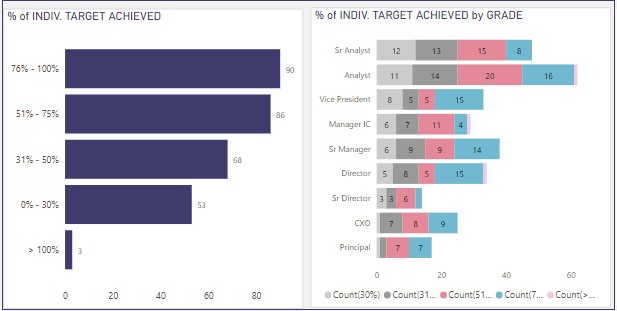
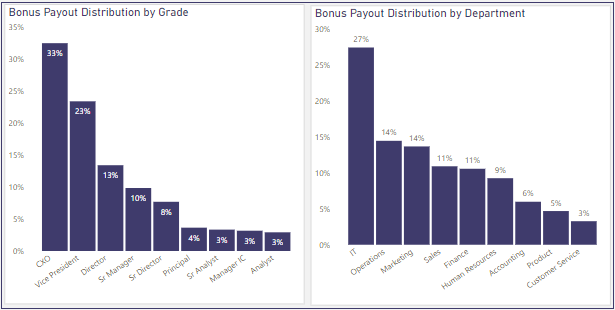
As shown in the below screenshot, the dashboard also gives the total bonus payout value as percentages per department and grades. For example, the grade Vice-president has received 23% of the total bonus payout value of $1,009,479.
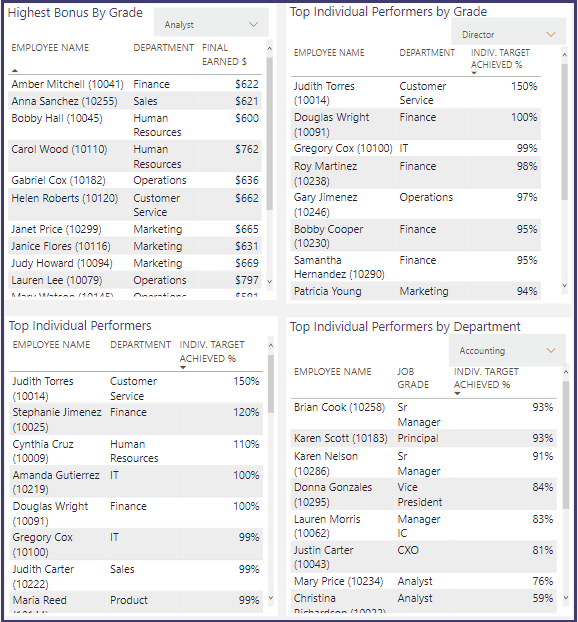
The Top performers report page presents the list employees with top bonus value based on Grade. Along with this, get top individual performers, also based on grades and performance for further analysis.
Please note that the template supports up to 1000 employees and 20 grades and 20 departments, by default which can be easily extended. Please write to us at support@indzara.com for any customizations / support.
Recommended Template
Performance Dashboard Power BI Template
- Improve Employee Performance Management in your organization with the power of Microsoft Power BI Template.
- Get key performance metrics and reports and take infinite, smart HR decisions.
Training Dashboard Power BI Template
- Improve training programs, identify best practices and implement them across your organization.
- Get fully automated reports and crucial training metrics with our Training Dashboard Power BI template.

I hope this template is useful. If you like it, please share it with your friends. If you have any suggestions or questions , please leave them in the comments section. I will continue to enhance this template based on feedback.
Leave a Reply