
Description
Get an in-depth analysis of stocks in a simple Excel spreadsheet Stock Screener Excel Template.
View multiple technical indicators of stocks, calculated automatically within a few minutes with the Stock Screener Excel Template.
Screen the stock signals, and filter stock indicators for a particular stock, based on required values. All with the ease of using a single excel file Stock Screener Excel Template.
Make analysis-based smart trading decisions quickly.
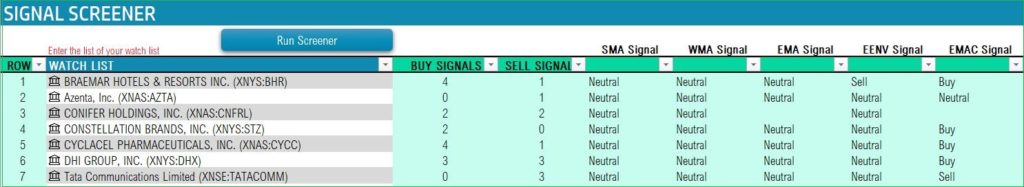
Simple Process
Enter the ticker symbols of different stocks in the signal screener sheet, to run the screener.
Immediately view: Sell or Buy or Neutral signals based on live market data for different indicators.
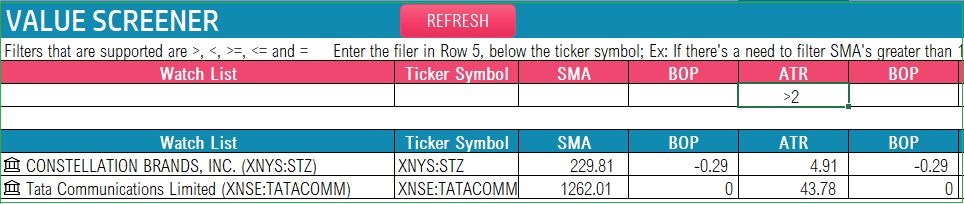
Screen the stocks based on values of the indicators, that can be filtered in the Value screener sheet.
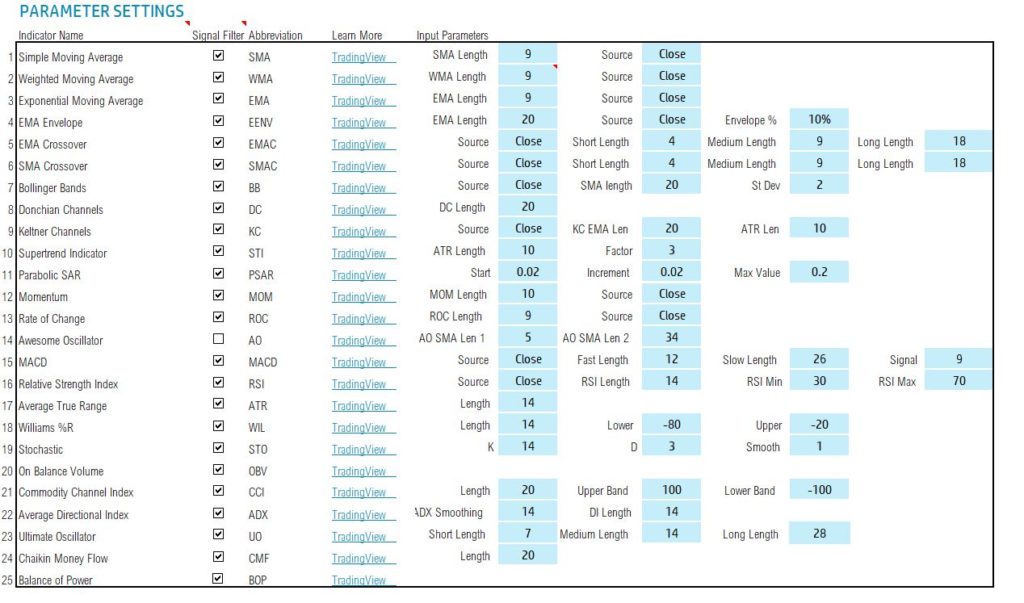
Customize Technical Indicators
You can modify the parameters of the indicators anytime. By this way, you can do the analysis as you prefer in the settings sheet.
Enter a stock ticker symbol and get live market data with all the technical indicators used in the template in an instant.
5 Charts
You can view up to 5 indicators at a time.
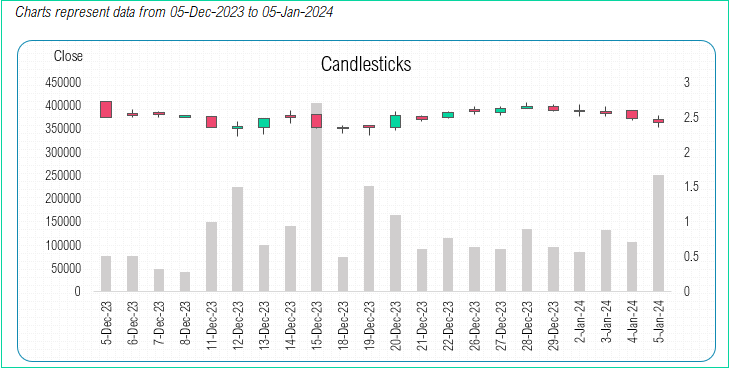
Candlestick Chart
View candles for any specific date range for your favorite stock.
Chart represents data from 05-Dec-2023 to 05-Jan-2024
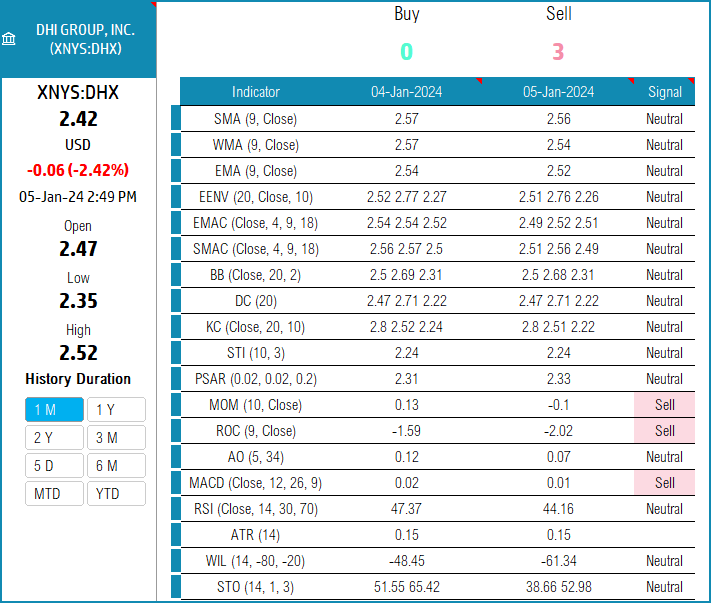
Signal Chart
Choose a technical indicator and see the trading signals (Buy/Sell/Neutral).
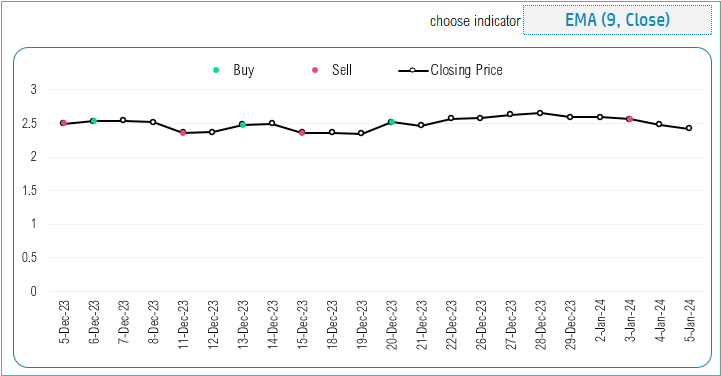
DISCLAIMER:
We do not provide any trading or financial advice. The template uses Excel formulas calculate mathematically the technical indicator values and applies specific rules or conditions to determine Buy/Sell signal.
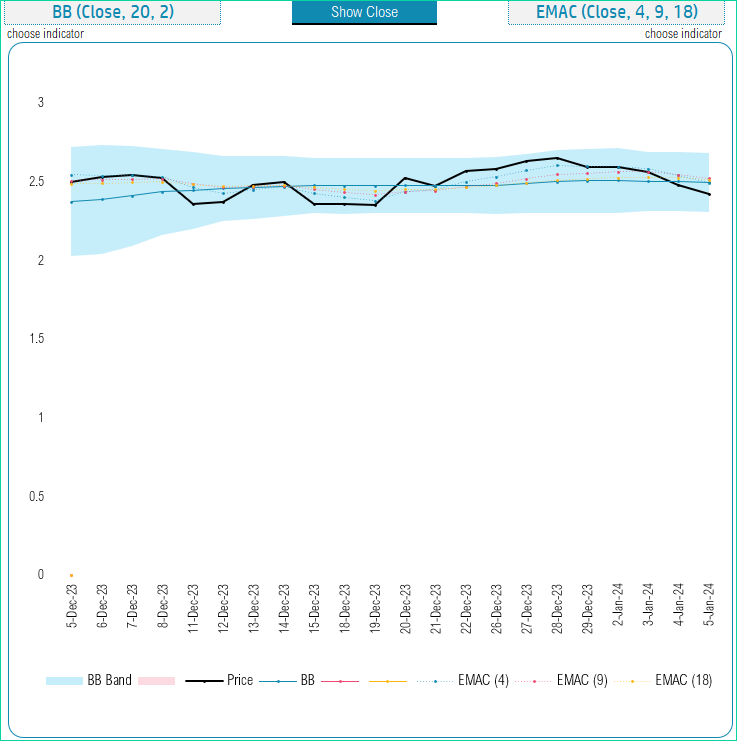
Multiple Indicators Chart
Choose two different indicators to view along with price line.
In the screenshot below, we are looking at Bollinger Bands as well as EMA Crossover indicators.
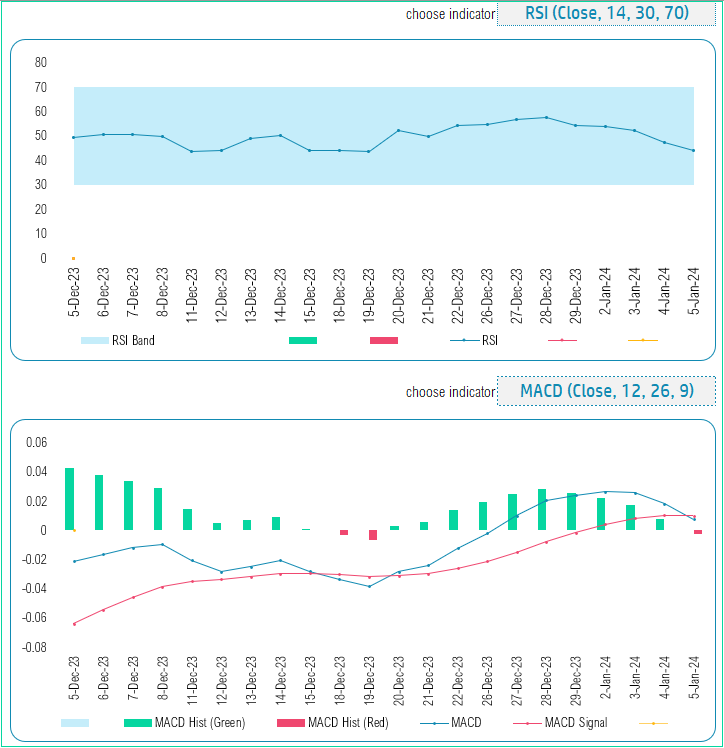
More Charts
You can also view 2 charts with one indicator each.
In the below screenshot, we are viewing RSI and MACD.
25 Technical Indicators
The following technical indicators are included in the template.
- Simple Moving Average
- Weighted Moving Average
- Exponential Moving Average
- EMA Envelope
- EMA Crossover
- SMA Crossover
- Bollinger Bands
- Donchian Channels
- Keltner Channels
- Supertrend Indicator
- Parabolic SAR
- Momentum
- Rate of Change
- Awesome Oscillator
- MACD
- Relative Strength Index
- Average True Range
- Williams %R
- Stochastic
- On Balance Volume
- Commodity Channel Index
- Average Directional Index
- Ultimate Oscillator
- Chaikin Money Flow
- Balance of Power
If you need to replace any with indicators of your choice, please email support@indzara.com with your requirements. We take on development projects for a fee and we can provide an estimate to based on your requirements.
Accurate Calculations of Technical Indicators
We have tested each technical indicator’s results with TradingView.com and ensured that the calculations are 100% accurate.
Please Note: This template supports up to 200 stock ticker symbols
Requirements
You can download the Stock Screener Excel template, and open using Microsoft Excel in your computer (PC or Mac). Also works in browser (Excel for Web).
The template performs all the calculations of the indicators; however the stock market history data comes from Microsoft’s service. You will need a Microsoft 365 subscription to get live market data into the template.
Please find the list of Stock Exchanges that are supported using this template by clicking here.
Microsoft 365 subscription is the most popular suite of Office apps including Word, Excel, PowerPoint, Teams, Outlook, OneDrive & Cloud storage of 1TB and more.
If you already have a subscription then you don’t need to purchase anything new. Stock market history data is already included in your Microsoft 365 subscription.


Nice for comparasion and detail analysis, need to work on some fixes
Produit très simple d’utilisation et très utile.
Le service après vente est très réactif et efficace (petite mise à jour pour ma version d’excel)
I have downloaded stock screener template recently it is very useful to me.
Very amazing options and filters are available in this template.
I bought the premium stock screener template. Which is useful to make the decision on stock picking for day trade or short term investments.