
Description
Are you looking for a simple yet intuitive tool to manage Sales Pipelines? Are you burdened by the thought of the heavy manual data entry work for your team’s sales data?
We have a solution, just for you! Get ready to revolutionize the way you manage your sales pipeline!
Our Sales Pipeline Manager (CRM) Power BI template is your ultimate solution for efficient sales data analysis and visualization. Say goodbye to manual data handling and hello to automated insights that drive better decision-making.
This CRM Sales software provides visibility to your sales funnel and enables you to take smart decisions to improve conversion and increase sales.
BENEFITS OF SALES PIPELINE POWER BI TEMPLATE
- Gain insights into your sales funnel’s efficiency and effectiveness, enabling strategic refinements.
- Identify and address sales funnel areas that hinder conversion rates for improved performance.
- Detect bottlenecks, act swiftly to make changes to the sales cycle, and boost overall efficiency.
- Explore your sales pipeline across dimensions like Lead Source, Industry, Location, Sales Executive, and Product for comprehensive insights.
- Evaluate the richness of your active pipeline, paving the way for accurate future sales predictions.
- Extract actionable insights into successful deal patterns, enabling focused prioritization.
- Transform analyses into actionable strategies, propelling your sales endeavors to unprecedented heights.
HIGHLIGHTS
- Fully automated Dashboard
- Automated & Interactive dashboard with Sales Funnel KPIs and other key metrics
- View Active Pipeline with projected sales by month and expected deal value
- Drill-down further in your analysis with the various dimensional analysis
- Simplified Data Entry
- Capacity to handle multiple Sales person’s Excel Data files in SharePoint
- Customizable and unified Settings Excel sheet for all the sales attributes
- Data Validations in place to ensure error free and good quality data
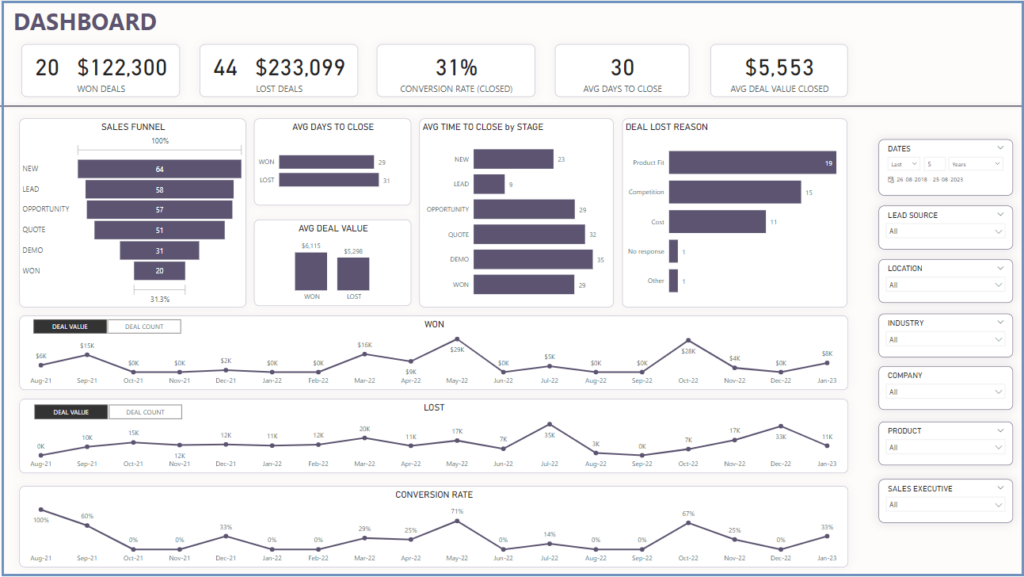
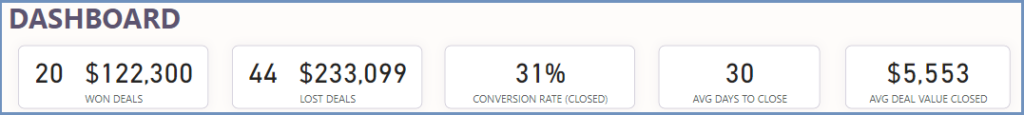
AUTOMATED & INTERACTIVE DASHBOARD
The Sales Pipeline Power BI Template provides a fully automated and interactive dashboard with effective Sales Funnel KPIs.
View the Key metrics Won Deals, Lost Deals, Conversion Rate, Avg Days to Close Deal & Avg Deal Value.
Get useful insights from the visuals in the dashboard:
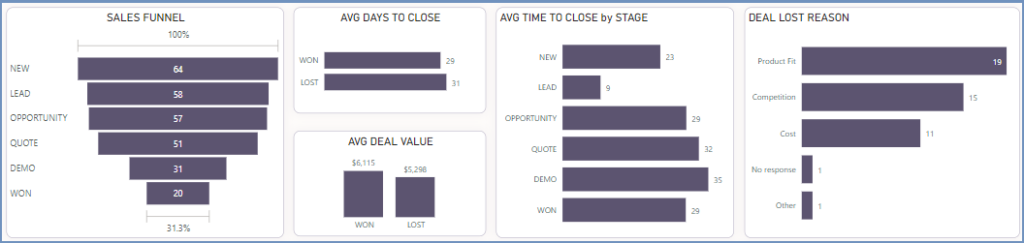
Sales Funnel performance: View number of deals that go through each stage of your pipeline process. Know which stage the deals are dropping off. Take actions accordingly to refine the deal selection process or improve the specific stage activity to increase conversion.
Time Taken to Close Deals (Sales Velocity): The Dashboard displays the average time for deal closure. Compare the time taken to close won and lost deals. It also reveals the duration of each sales funnel stage, helping you find process bottlenecks for better sales cycle efficiency.
The Dashboard shows how many days in average it takes to close a deal. You can see how many days it took to close a deal won versus a lost deal. It also shows how long each stage of your sales funnel took. This allows you to identify any bottlenecks in your sales process and improve sales cycle efficiency.
Deals Lost – Lost Reason: In any sales pipeline, some deals are lost. It’s crucial to know why. The Dashboard highlights the main reasons for lost deals, allowing you to focus on these areas and enhance the conversion rate.
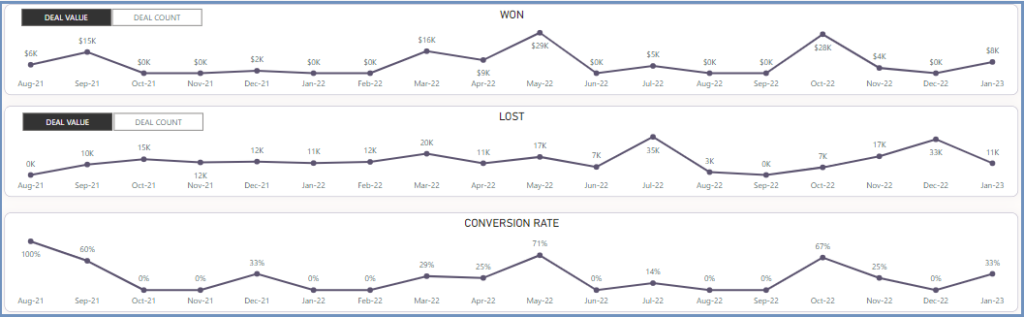
Get the Won/Lost deals, the conversion rate as trends for over a period to identify patters in sales for a more targeted approach.
You can filter the Dashboard by with the various slicers provided for an in-depth data analysis.
ANALYSIS
With the Analysis report, delve deep into essential metrics, such as the average value of deals and the time required for closure based on various analysis dimensions.
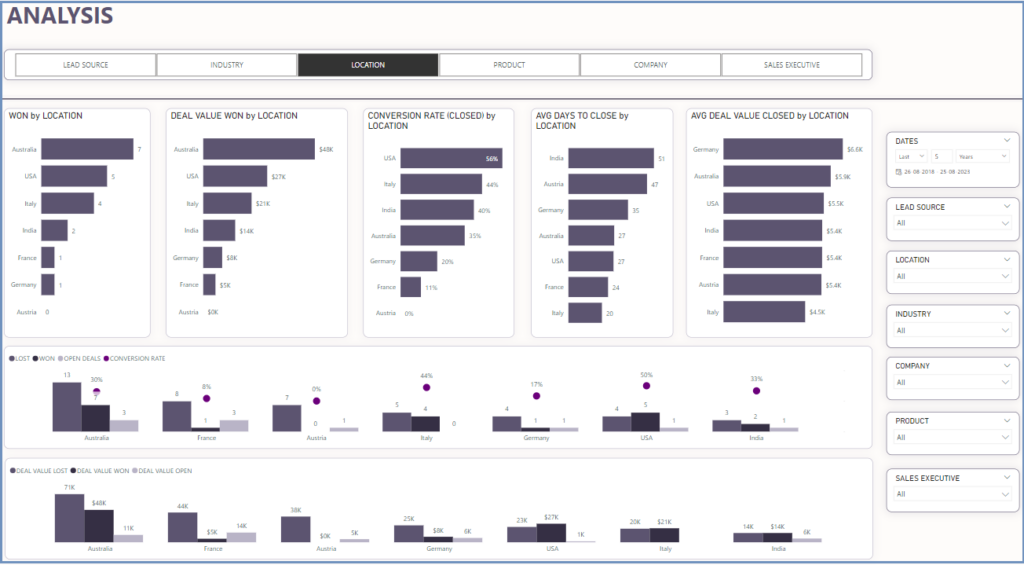
These visuals provide better clarity, giving you valuable insights. This empowers you to recognize patterns, refine your approach, and optimize your sales strategies for maximum effectiveness.
VIEW ACTIVE PIPELINE WITH PROJECTED SALES
This report provides visibility to active deals (deals that are still open without a decision being taken).
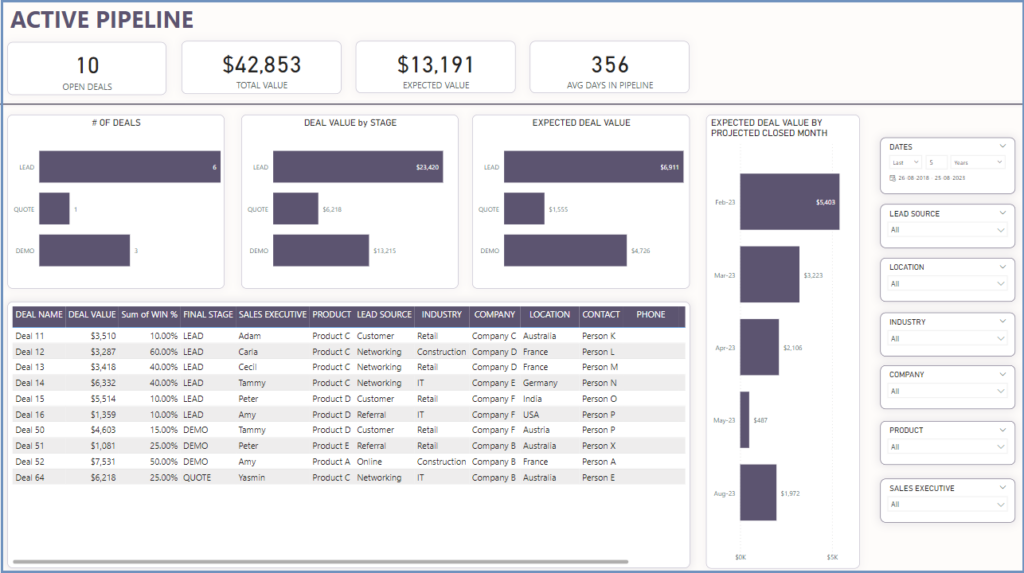
You can see the number of deals open, total deal value and also the expected value. This can be used in facilitating a proactive approach to deal management and resource allocation.
SALES PIPELINE MANAGER TEMPLATE DEMO
We have a dedicated support portal to guide you in detail on how to use the template.


Reviews
There are no reviews yet