Investing in the stock market can be a challenging task due to the vast number of stocks available, and keeping track of them can be overwhelming, considering the market’s frequent fluctuations.
However, you can simplify the process by utilizing our Microsoft Excel templates.
How Microsoft Excel can improve your Investing Strategy?
Efficiently track Stock prices with Excel’s Stock Lookup
Utilize Stock Price history analysis to inform your investment strategy
Track Foreign Exchange rates in addition to stock prices.
Creating and organize your personalized stock watchlist in Excel
Use our templates to track Stock Market indices
Use Technical Indicators to do smarter Stock trading
Perform customized Market analysis on your favorite stocks
Screen stocks and find ones that meet specific criteria of your choice
Easily compare stocks to make a decision on your investment
Always keep a close eye on your investments with real-time stock portfolio tracker
Disclaimer: indzara.com will not be responsible for any stock trading decisions taken by using our templates.
Use Technical Analysis to make informed stock market decisions
Technical Analysis is the study of market action, primarily through the use of charts, for the purpose of forecasting future price trends. ‘Market action’ includes the three principal sources of information available to the technician – Price, Volume and open Interest.
Technical Analysis of the Financial Markets – John J. Murphy
Technical indicators are calculations that are performed on the history of the stock, primarily the price and trading volume of the stock, in order to determine when to buy or sell.
There are many types of technical indicators commonly used by traders -Trend Indicators, Momentum Indicators, Volatility Indicators, Volume based indicators and more. There is also no limit to what calculation you use to identify trading signals – when to buy, when to sell, when not to buy or sell.
We provide several templates for you to calculate technical indicators instantly in Excel.
Ready to take your SMA (Simple Moving Average) trading strategy to the next level? Our powerful Excel template lets you backtest your strategy effortlessly! No coding, no complex software, just instant results right within Microsoft Excel. Start making data-driven decisions with confidence!
FEATURES
Instant calculation of trading metrics and performance indicators
Trading timeline view
Equity curve
Cumulative profit/loss chart
SMA technical indicator charts
Candlestick price charts with volume
Detailed trade-by-trade analysis
Support for both long and short trading strategies
Latest signal detection for current market conditions
Customizable SMA settings
Multiple signal event handling options
RSI Strategy Backtester Excel Template
If you are looking for a simple tool to backtest your RSI trading strategy, try our RSI Strategy Backtester Excel template that allows you to backtest your trading strategy, all within Microsoft Excel instantly.
FEATURES
Instant calculation of trading metrics and performance indicators
Trading timeline view
Equity curve
Cumulative profit/loss chart
RSI technical indicator charts
Candlestick price charts with volume
Detailed trade-by-trade analysis
Support for both long and short trading strategies
Latest signal detection for current market conditions
If you are looking for a simple tool to backtest your MACD trading strategy, try our MACD Strategy Backtester Excel template that allows you to backtest your trading strategy, all within Microsoft Excel instantly.
FEATURES
Instant calculation of trading metrics and performance indicators
Trading timeline view
Equity curve
Cumulative profit/loss chart
MACD technical indicator charts
Candlestick price charts with volume
Detailed trade-by-trade analysis
Support for both long and short trading strategies
Latest signal detection for current market conditions
Customizable MACD settings
Multiple signal event handling options
Calculate 25 Technical Indicators for any Stock
If you are looking for a simple way to analyze multiple technical indicators for a single stock, then use our Technical Analysis template.
Enter any stock symbol
Customize settings for each technical indicator
Analyze 25 technical indicators including popular RSI, MACD, Moving Averages, Bollinger Bands and more.
Screen the stock signals, and filter stock indicators for a particular stock, based on required values. All with the ease of using a single excel file Stock Screener Excel Template.
Make analysis-based smart trading decisions quickly using our simple process.
Enter the ticker symbols of different stocks in the signal screener sheet, to run the screener.
Immediately view: Sell or Buy or Neutral signals based on live market data for different indicators.
Screen the stocks based on values of the indicators.
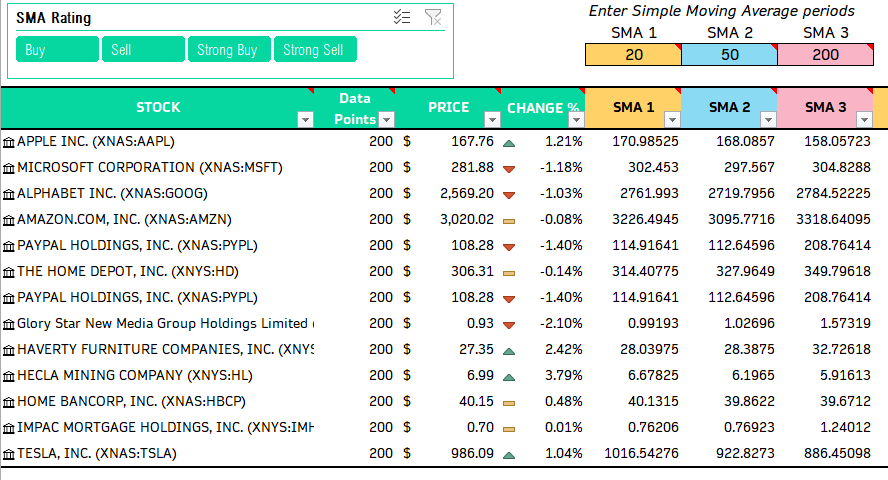
Screen Stocks using Simple Moving Average Indicators
If you rely on simple moving average indicators to screen stocks, then your ideal solution is our Moving Average Screener template.
Enter 3 different Simple Moving Average periods to calculate an aggregate SMA rating (Strong Buy, Buy, Sell, Strong Sell)
Enter up to 500 stocks in this watch list in the Simple Moving Average Stock Screener Excel Template.
Use slicer to quickly see stocks to buy or sell.
Free Technical Indicator templates
We also have numerous templates which are designed to calculate one technical indicator at a time. We explain the definition and concept behind the technical indicator in the video demo.
Download these templates, enter any stock symbol and instantly view the technical indicator calculated automatically for you.
Investors can benefit from Excel’s ability to quickly look up stock prices and more information for specific symbols. Enter your favorite stock symbols such as AAPL, MSFT, and TSLA to retrieve current stock prices and view other important information such as market capitalization, and price-to-earnings ratio.
Analyze Stock Price History and make smarter trading decisions
Analyzing a stock’s price history is a crucial aspect of understanding its performance and identifying trends. With our free templates for stock price charts and candlestick charts, this process becomes effortless.
The templates provide up to five years of price history by simply entering the stock ticker symbol. The candlestick chart template displays the price in the form of candlestick shapes, offering a visual representation of the stock’s performance.
Excel’s support for foreign exchanges goes beyond just stock analysis. View currency exchange rates with ease using our free Forex Rate Chart template. This allows investors to analyze and monitor the performance of currency pairs over time. With the ability to enter a currency pair symbol, you can access up to 5 years of price history.
Create your personalized Stock Watchlist in Excel
Managing a watch list of stocks is crucial for any investor to stay updated on the specific stocks that one is interested in following. Stocks Watch List template makes it easy to create and manage your own list of stocks. Simply add a stock symbol to the table and instantly view performance data along with customizable columns to display data of your choice.
Market trackers are essential tools for investors to monitor the performance of specific stock markets.
The US Stock Market Tracker template provides an overview of the U.S. stock market, displaying the performance of the three major indices DOW, S&P500, and NASDAQ 100. This template tracks the performance of 529 stocks that make up the indices.
These templates facilitate the easy addition of new stocks and enable investors to access valuable information such as top gainers, top decliners, most actives, and detailed stock data.
This makes it convenient for investors to stay up-to-date with the latest market trends and make informed investment decisions.
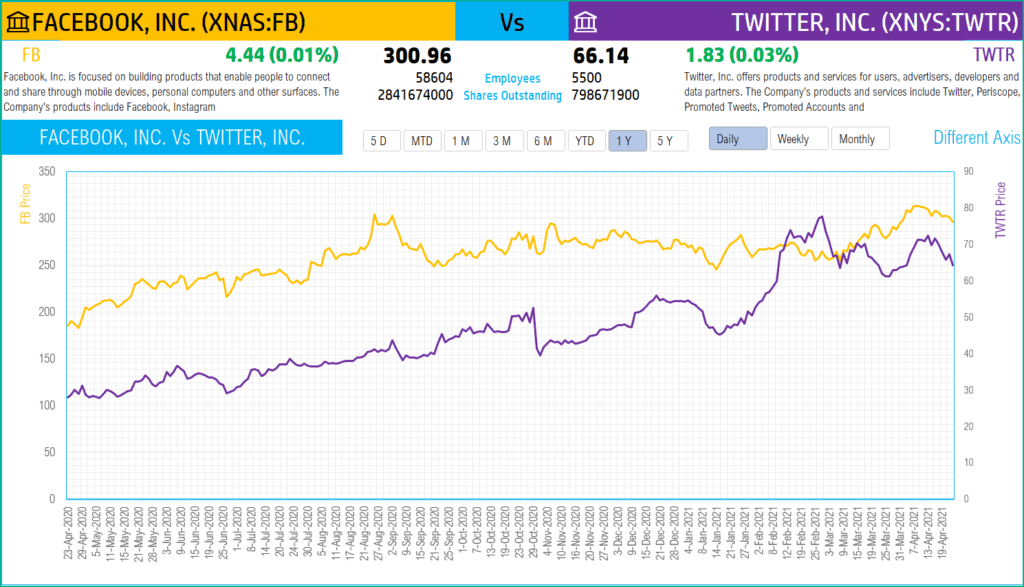
Market analysis is an essential tool for investors to make informed investment decisions. Excel templates such as the US stock market industry stocks analyzer and the India stock market industry stocks analyzer can assist in the analysis of industry-specific stocks. These templates allow the analysis of stocks across any two measures using scatter plots, analysis of stocks in specific industries, and comparison of two or more stocks across various measures.
Such templates can provide investors with valuable insights and help them make better investment decisions.
Use our Excel Templates for efficient Stock Screening
Stock screeners are powerful tools that can help investors narrow down their search for potential investment opportunities.
The US Stock Market Free Live Stock Screener – Excel Template is a comprehensive tool that allows filtering by various criteria such as market cap, PE ratio, and more, with 7000+ stocks and ETFs in the screener.
The premium Stock Screener Excel Template, on the other hand, focuses on technical indicators, allowing for a quick and easy way to analyze and filter stocks based on required values. These templates can help investors make data-driven investment decisions and save time in their research process.
Track your personal stock portfolio with real-time market data
Download Stock Portfolio Tracker Templates
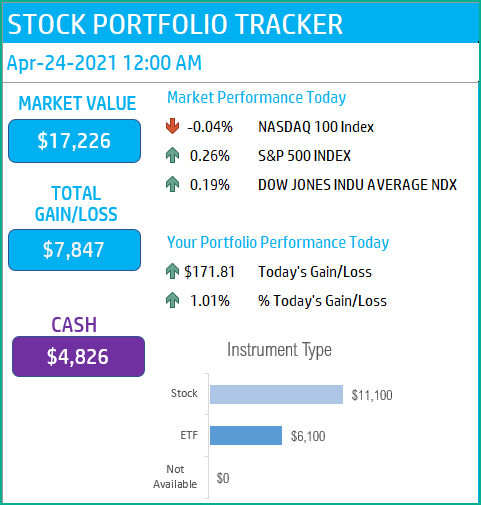
You can now track your stock market investments with ease using the Stock Portfolio Tracker 2023 Excel Template. This template provides a one-stop solution for entering all stock transactions in a single table and viewing the current market value of all stocks and cash balances. With the portfolio mix categorized by instrument type and industry, you can easily keep track of their portfolio performance.
Additionally, the dashboard also provides performance data for individual stocks, such as quantity, gain/loss, and percentage gain/loss.
Instantly see real-time updates from Stock Market.