In this blog post, we will cover the following topics: About Statistical Process Control Charts A Control Chart or Statistical Process Control chart or SPC Chart is an effective business process monitoring tool to measure whether your process is within control. Control charts can be used to monitor a wide variety of processes. A process […]
Category: Data Visualization
Excel templates designed for presenting data visually in an easy to understand form. You will find templates on creating geographic heat maps using your own data.
How to Create a Column Chart with Actual, Target, and Variance in Excel?
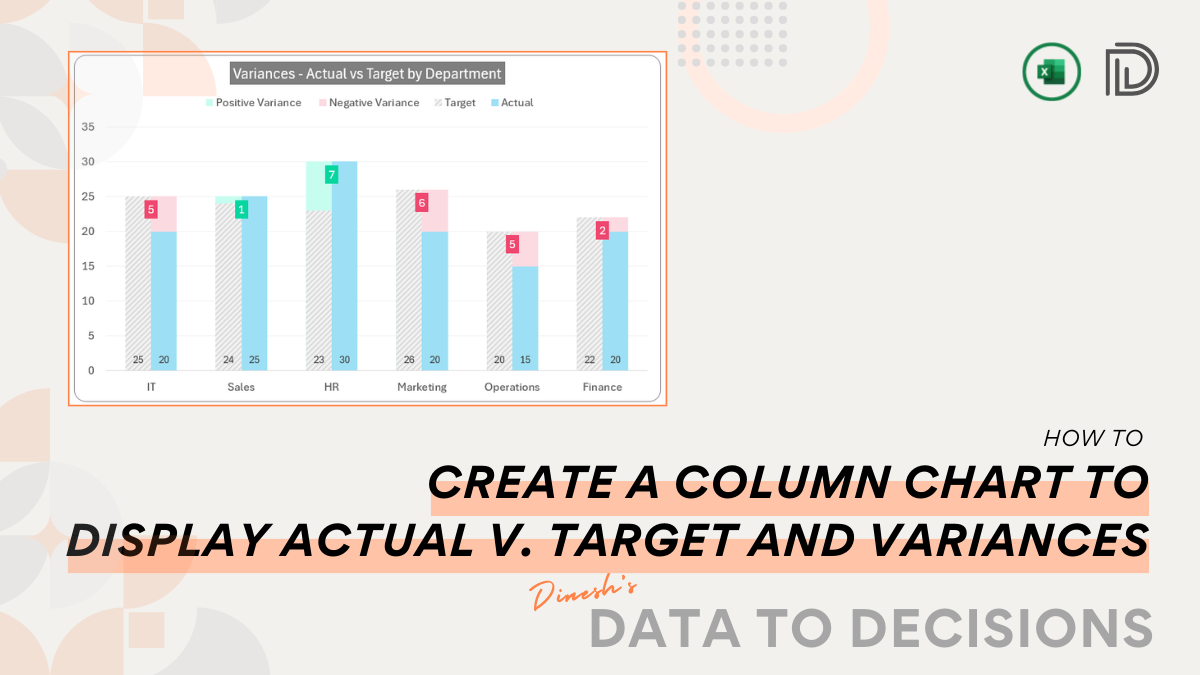
Elevate your Excel dashboards with our blog post on constructing a Column Chart that neatly displays the actuals, targets, and variances of a measure.
Timeline Chart – Excel Template
Visualize your project’s timelines with a simple Excel Template.
Motion Bubble Chart & Scatter Plot – Free Excel Template
Data analysts use data to discover answers to questions and then communicate the findings to the audience effectively so that the message reaches the audience clearly, correctly and quickly, leading to actions that improve outcomes. Motion Charts or Animated Charts allow us to express the data in ways that a static chart does not. A […]
Combinations Generator Excel Template 2023 – Free
Download this free Excel template to create all combinations of 6 lists of values instantly. Enter your own lists of values and instantly view all combinations. This template can be used for up to 500 combinations. This sheet can be expanded.
2014 Indian Lok Sabha Elections Results in Excel
Download this free Excel template that allows us to view 2009 and 2014 Election results, and gain insights through simple data visualization techniques. Also, find techniques that can be applied on other topics or datasets.
World Heat Map by Continent – Free Excel Template for Data Visualisation
Download this free Excel template to create heat maps of the world instantly. Enter your own data in the template, customize the features and options and print.
More uses of Geographic Heat Map Excel Templates
We have already published some Geographic Excel heat map templates on indzara.com. The primary purpose of the templates is to visualize data by geographical region. For example, we have country templates (India, United States, Canada, Australia) which allow visualizing data by state in that country. We have state templates (Tamil Nadu) which allow visualizing data […]
Tamil Nadu Heat Map by District – Free Excel Template
Download this free Excel template to create heat maps instantly. Data on each district can be entered in any order and color values can be customized. The generated heat maps are printable.
2016 U.S. Presidential Election Tracker – Excel Template
Download this free Excel template to view the results of the 2016 U.S presidential election. Simply enter data and view the results on the map. The data can be used for analyses of the election performances.