Home » Free Stock Market Template
Tag: Free Stock Market Template


Download Stocks Watch List template in Google Sheets to build your own watch list of stocks. See the price changes
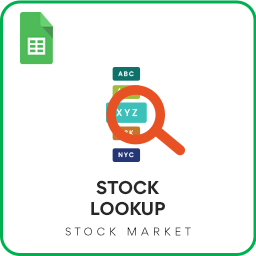
Look up the price and other information about stocks using this Google Sheets template.
Download Excel template to view your Stock Portfolio Dashboard. Enter stock transactions and instantly view your stock portfolio performance. Refresh
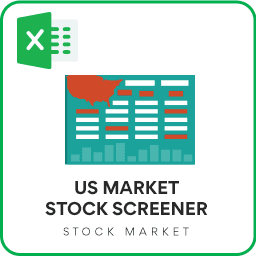
Download this Excel template to screen from 7000+ stocks in the US Market. Filter by Exchange, Industry, Market Cap, ETF
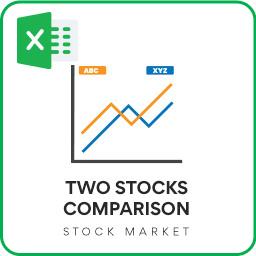
Compare any two stocks instantly in Excel across multiple attributes. View Price trends of both stocks over customizable time period

Download Excel template to analyze stocks in Indian Stock Market, on two different measures out of 16 measures. Choose an

Download Excel template to analyze stocks in US Stock Market, on two different measures out of 16 measures. Choose an

Download Keltner Channels Technical Indicator Excel template to create indicator for any stock. Just type in a ticker symbol and
Project Management Templates
Stock Market Templates
Data Visualization Templates
Calendar Templates
Other Templates
Join our weekly Newsletter
Sign up to transform your Excel skills.
Thank you!
Please check your email to confirm subscription.