Description
If you are in HR you need an effective tool to measure and present the performance indicators that reflect the state of HR in your company. This is key for the HR leadership and the company leadership to understand the current state and measure the progress against the company’s targets. In addition, you can identify areas of opportunities that need more attention.
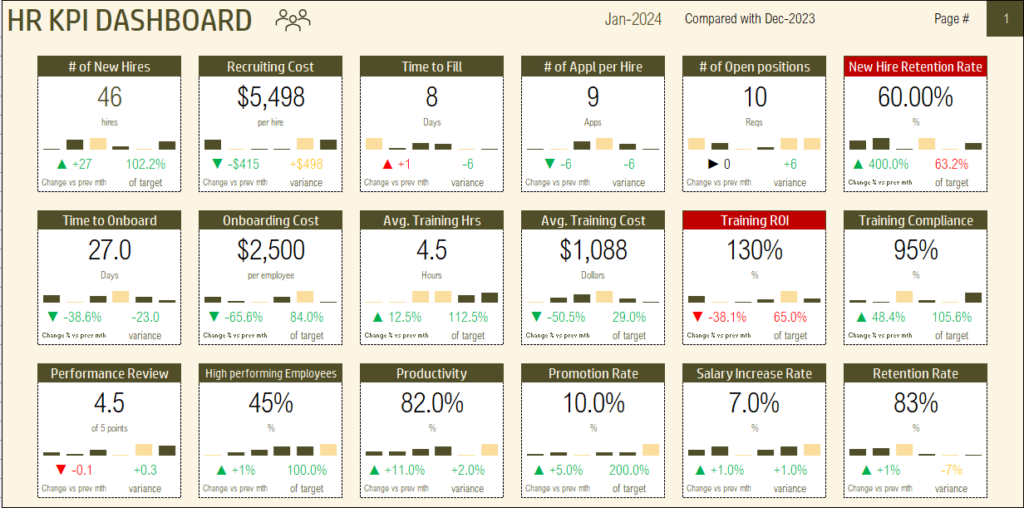
With our HR KPI Scorecard Excel template, you can have an effective and elegant Scorecard and Dashboard completely customized for your organization, within a few minutes.
BENEFITS OF KPI SCORECARD TEMPLATE
- Take effective informed business decisions in a timely manner
- Save weeks of development effort to create such a KPI scorecard
- Impress your company leadership with an elegant scorecard within minutes
HIGHLIGHTS
- Immediately useful – Automated HR KPI Scorecard and Dashboard; Sample file with 30 HR KPIs
- Practical functionality to address common business scenarios
- Highly customizable – Customize to your business needs
- Action-oriented design to enable effective and quick business decisions
Immediately useful
Automated HR KPI Scorecard and Dashboard
The KPI Scorecard template will allow you to create HR KPI Scorecard and Dashboard within a few minutes. Once you enter your KPIs and their values, the Scorecard and Dashboard are immediately ready.
The template is designed to be simple to input data and produces highly effective outputs instantly.
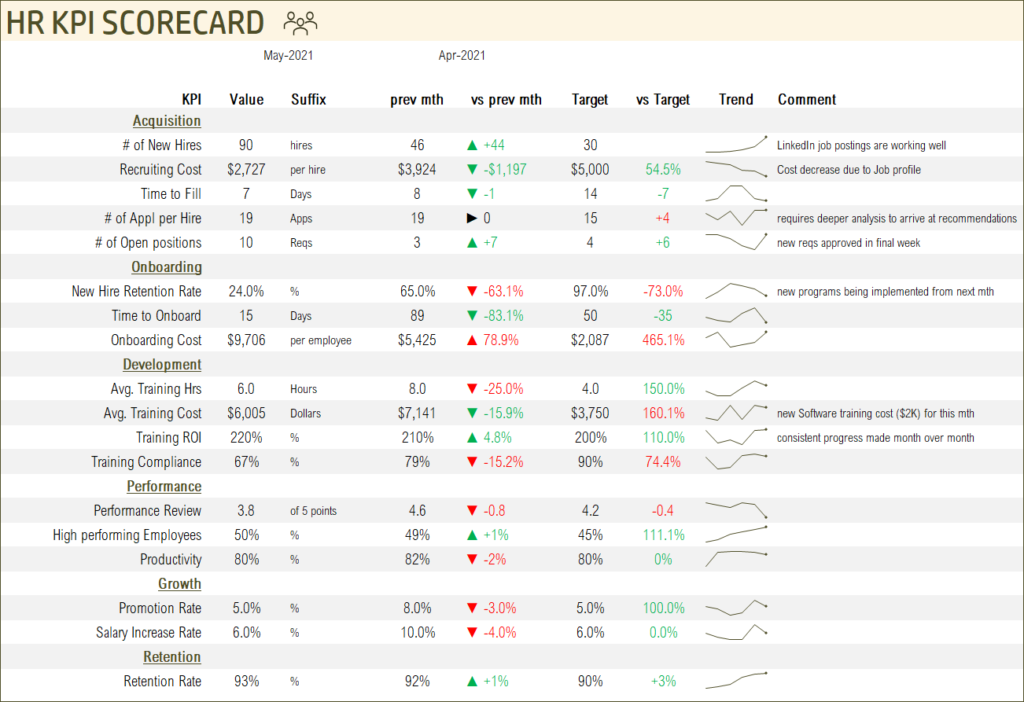
Scorecard design allows comments to appear along with the KPI data, to provide more context to the numbers.
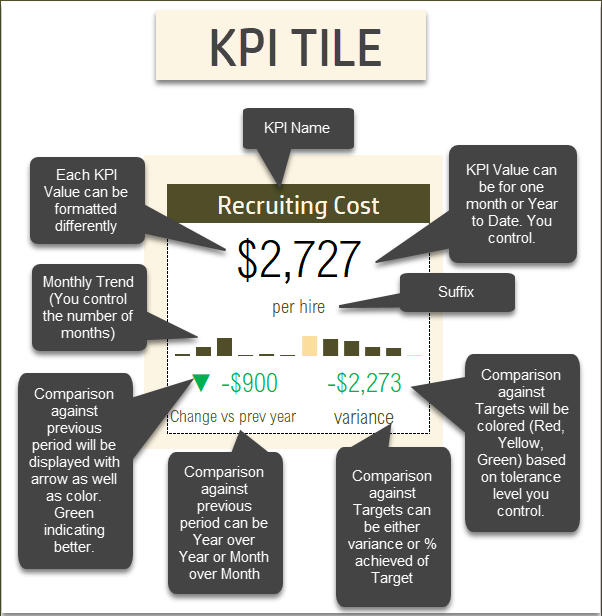
The Dashboard in KPI Scorecard template provides similar information but using a KPI Tile or KPI card style.
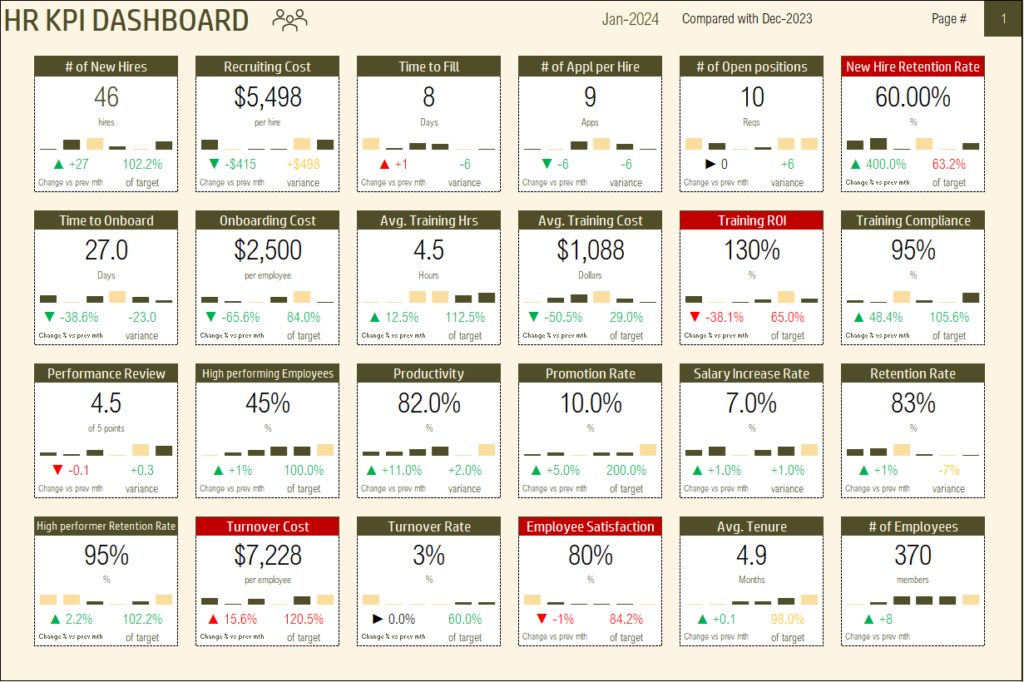
Sample file with common HR KPIs
If you are looking for a base set of KPIs, we also provide a sample file which has 30 KPIs with sample data.
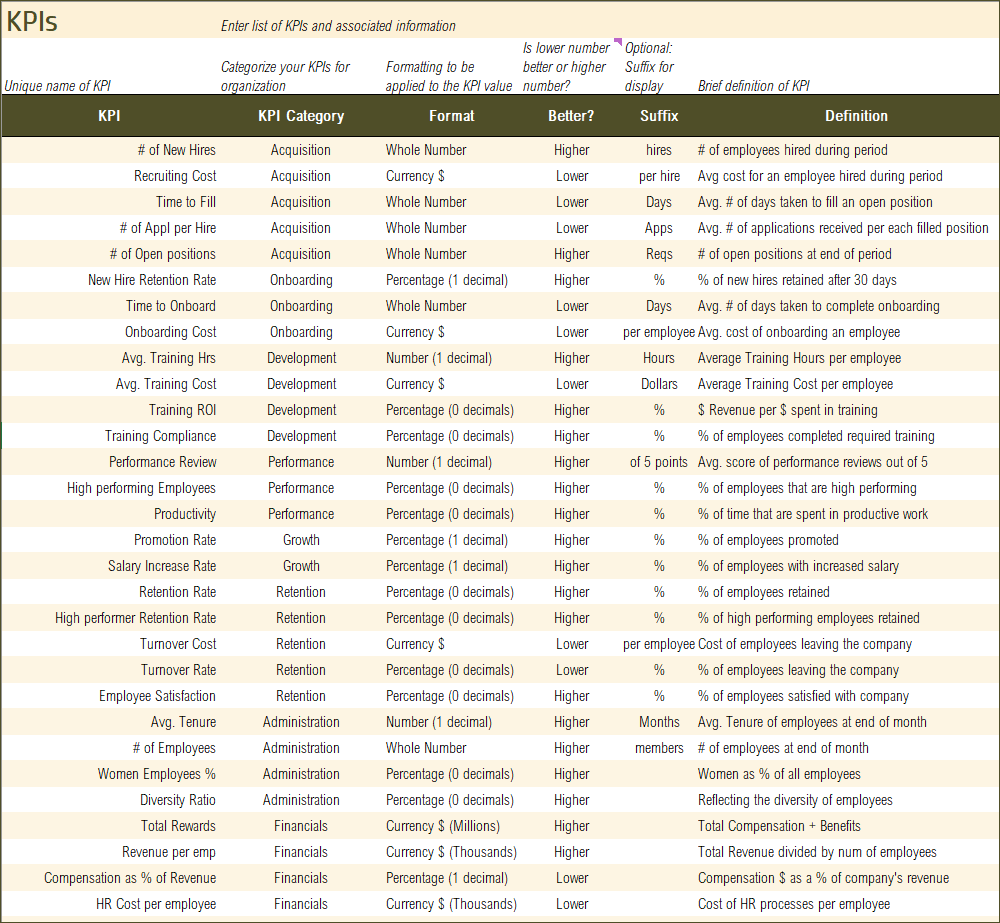
You can modify these to suit your business needs.
Practical functionality to address common business scenarios

- Dashboard can be for one Month or Year to date (YTD)
- Comparison Period can be Previous Month or Same Month Prev Year. This allows calculating month over month or year over year comparisons.

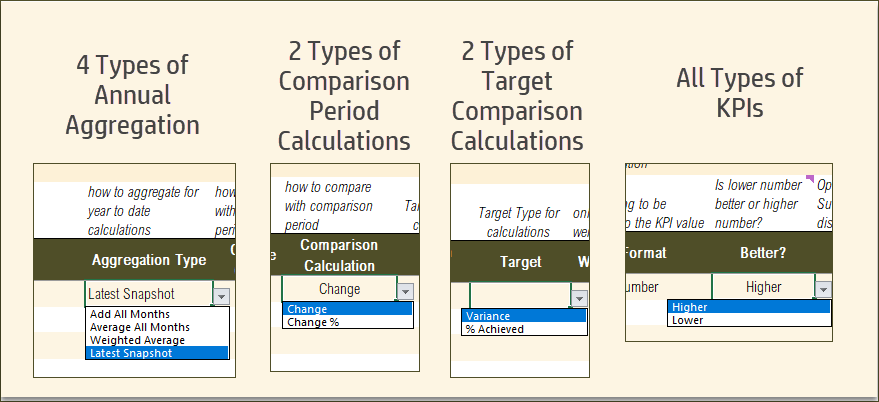
- KPIs can be aggregated as Sum, Average, Weighted average or Latest snapshot
- KPIs can be configured to be compared as Change or Change %. This allows calculating absolute change in KPI value or as a %.
- Targets can be compared as Actual % of target or Actual – Target variance
- Both types of KPIs are supported – whether Lower or Higher value is better.
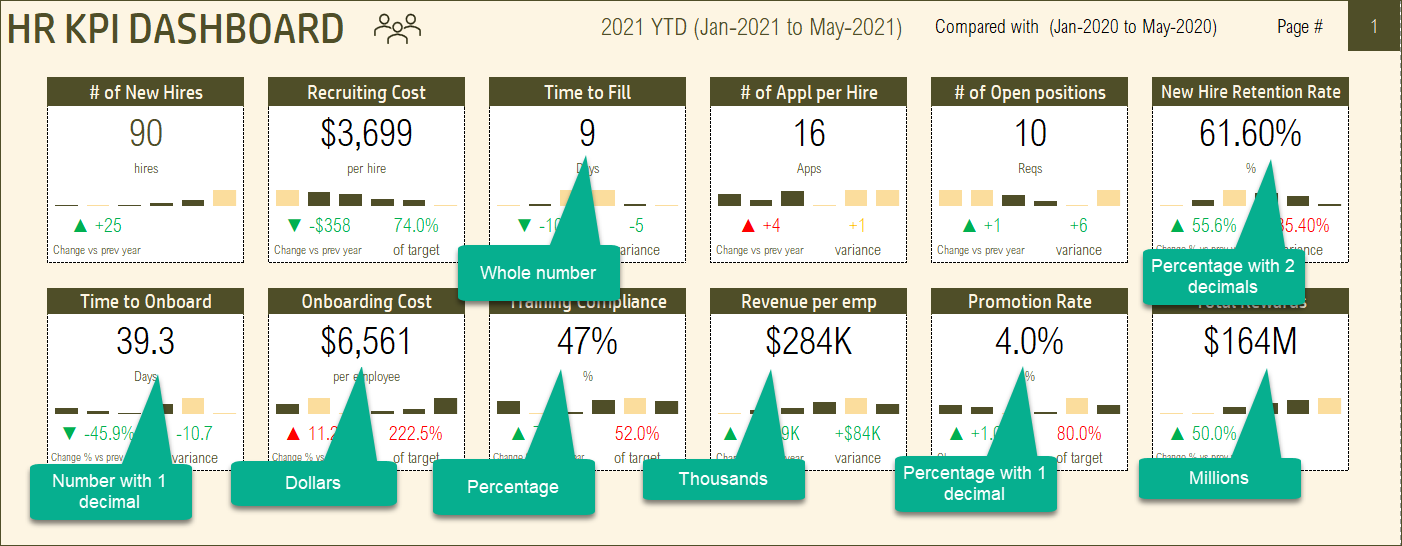
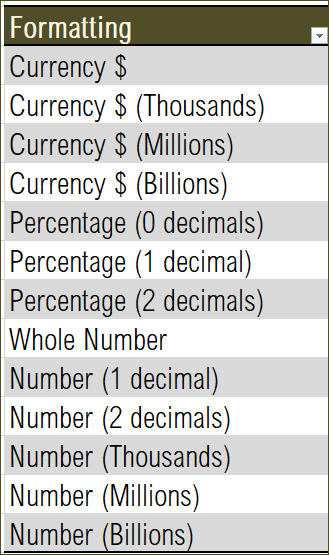
- Accommodates KPIs with different formats (Currency, Whole numbers, Decimals, Percentage)
Customize to your business needs
Enter your own KPIs and customize the settings to make it truly your own KPI scorecard
Period over Period comparison and Target comparison are optional. If you don’t need those comparisons, you can set them to off. The tiles will appear as below.
Period over Period comparison is controlled for all KPIs together while Target comparison can be controlled for each KPI individually.
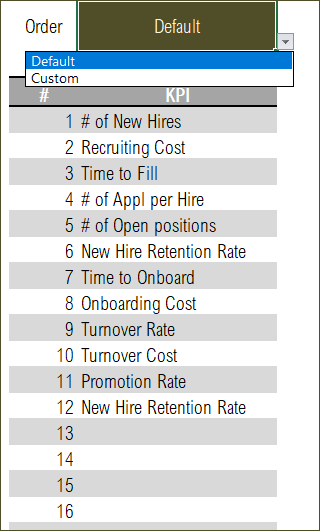
Order of KPIs in Dashboard can be adjusted for display
By default, the KPIs will be displayed in Dashboard in the order of entry. However you can completely control the order by choosing ‘Custom’ order and choosing each tile/card slot in the Dashboard.
Order of KPI Categories can be changed easily for display
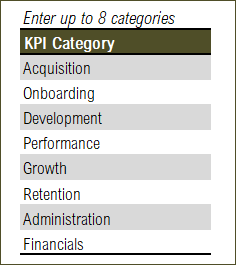
KPIs belonging to a category are grouped automatically in KPI Scorecard. You control the order by entering the KPI categories in the Settings sheet. If you need to modify the order, just change the order in the Settings sheet in the KPI Scorecard template.
Number of Months to display in trendlines can be customized.
Tolerance to allow when comparing against targets is user controlled
You can enter the tolerance % allowed when comparing against targets. This will control whether the comparison value is colored Green, Red or Yellow.
Action-Oriented Design to enable business decisions
Commentary can be recorded for each KPI for each month in the KPI Scorecard template.

This will be displayed on the Scorecard automatically. This approach also allows you to have history of all comments for 2 years in one file.
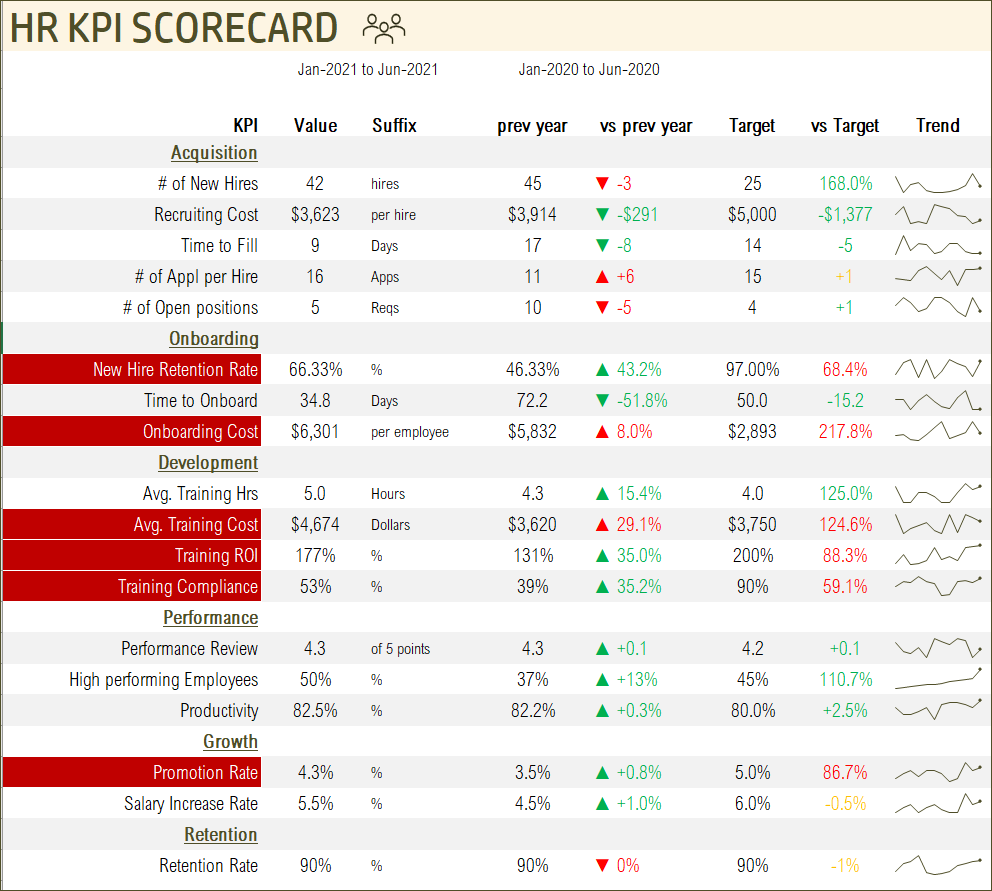
Scorecard and Dashboard allow quickly viewing KPIs which have not met targets

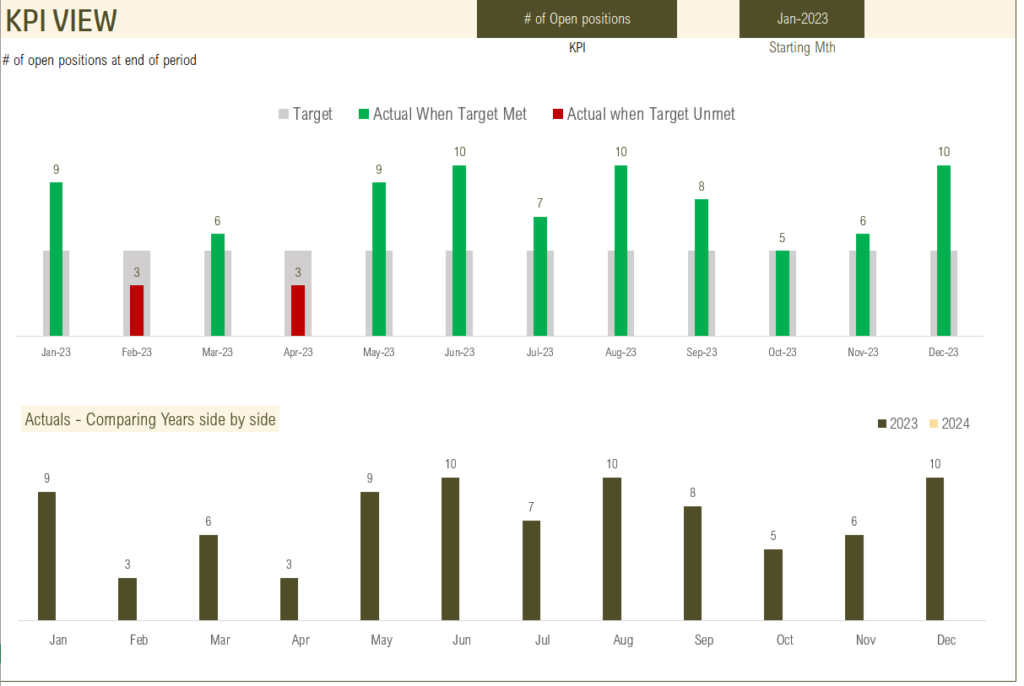
KPI view allows visualization of monthly actuals vs targets and Year over Year.
HR KPI Scorecard Template Demo
Try it out yourself with this demo below. Use the filters and see the dashboard get updated instantly. For fully unlocked version please purchase the template.
Requirements
- Excel 2013 and above
- Excel Online/Excel for the Web
Limitations of HR KPI Scorecard template
- Supports 100 KPIs by default
- Up to 8 KPI categories by default
- Handles 2 years of monthly data
If you need to expand these limits, please contact us at support@indzara.com






This template is amazing, very easy to use, and really improves management.
This is also one of the best dashboards to keep a track of key performance indicators in all the HR parameters.
Again another 5-star rating for it.
Thank you very much Indzara.
I believe its a great tool, using it periodically to inject data and monthly to present Dashboard.
highly customizable and a must for HRBP or HR manager
One of the best KPIs Dashboard ever. Really liked it and highly recommended