Description
Are you looking to improve Training program in your organization?
Want to have instant access to key metrics like Training ROI, Investment per Employee, Enrollment %, Training Completion %, and Avg. Training Rating?
Would you like to identify best training practices and implement across your company?
Want to have automated reports that can be easily refreshed with the click of a button?
Look no further. We present a simple and effective Training Dashboard Power BI Excel Template.
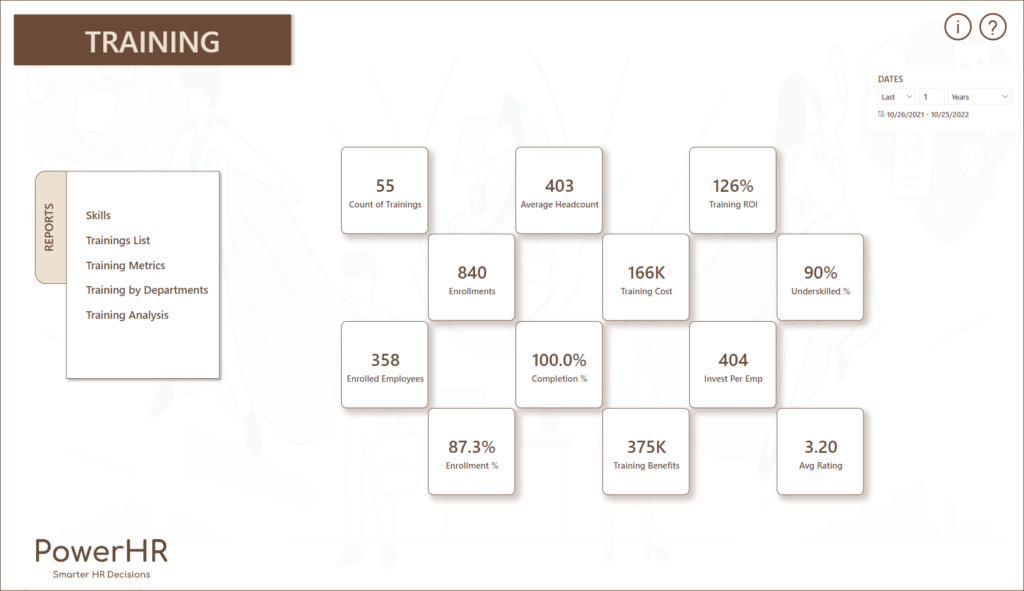
Get instant access to 24 relevant Training metrics in 5 actionable HR reports and take infinite smart HR decisions.
Let’s take a look at the reports and metrics included in the template.
5 Automated Reports
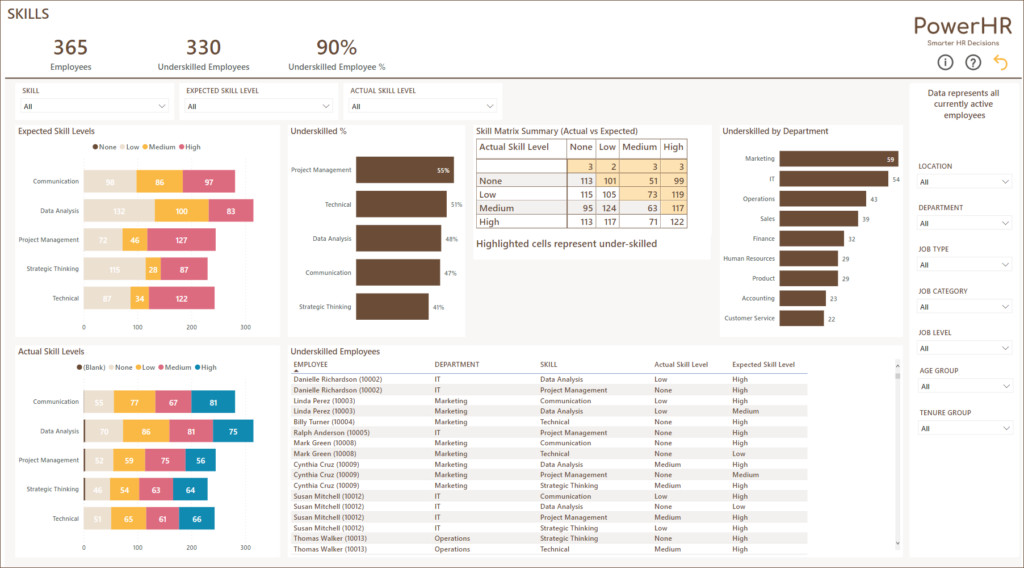
Skills Report
Identify which skills are needed for employees and prepare training programs to improve those skills.
Quantify the number of employees who need to be upskilled in each department.
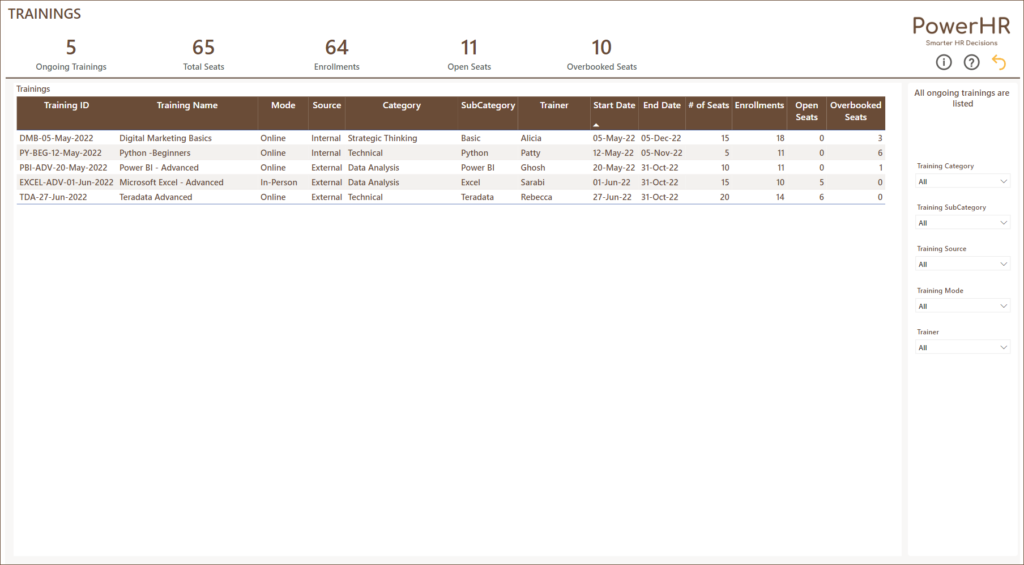
Training List Report
View the list of ongoing trainings along with open seats and any overbooked seats.
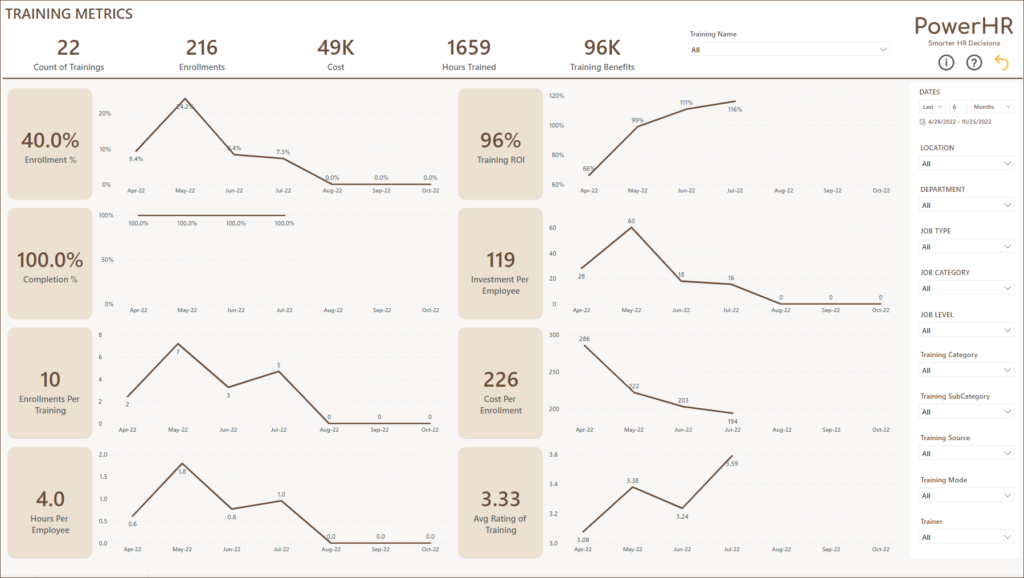
Training Metrics Report
Measure the effectiveness of your training program using Training ROI.
Track Enrollment % and Training Completion % by Department.
Track number of hours of training and cost/benefits.
View trends of these metrics over time to notice improvement.
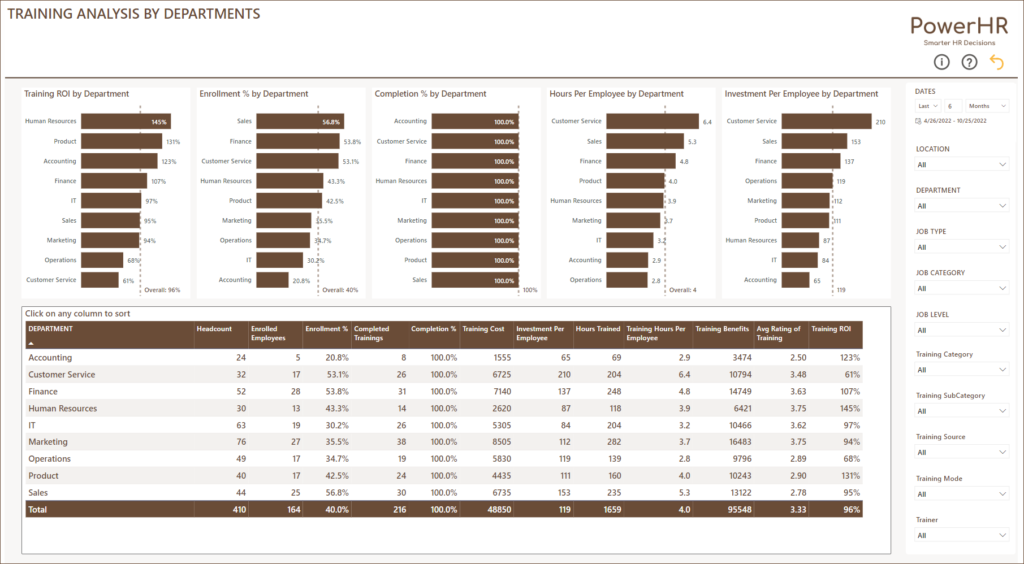
Training by Departments Report
View Training metrics by department and gain valuable insights into which departments are performing well on each metric.
Identify the best performing departments and implement best practices across company.
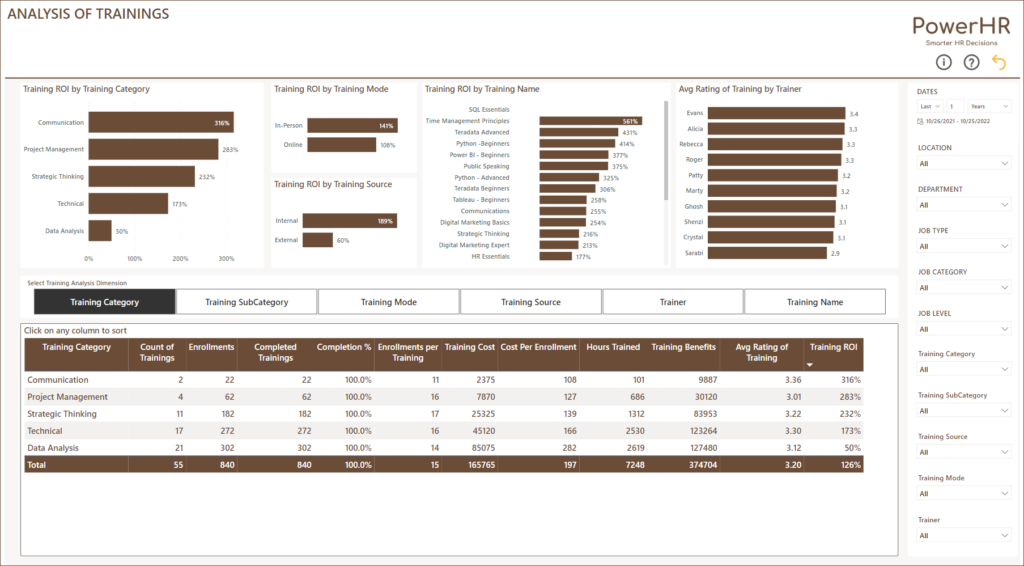
Training Analysis Report
View metrics by Training category, Mode (in-person vs Online) and Source (Internal vs External), Trainer and Training.
Identify what’s working well and investment more into them.
Identify what’s not working and remove investment into those trainings. Or make modifications to those trainings.
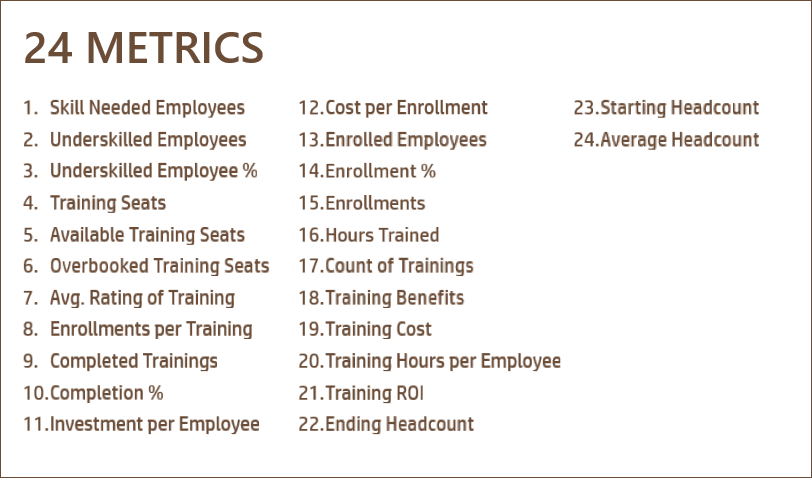
24 Metrics
You will have instant access to 24 Training metrics in the Training Dashboard Power BI Excel Template. They are used in the 5 reports. You can also create your own reports and visuals using the metrics.
Interactive, Customizable & Expandable Reports
All the reports have filters that allow you to narrow down the data according to your needs.
You can easily customize the entire Power BI report by modifying the theme colors/fonts or customize specific visuals individually.
If you have used Power BI before, you can add more reports in the Training Dashboard Power BI Excel Template or modify existing reports easily.
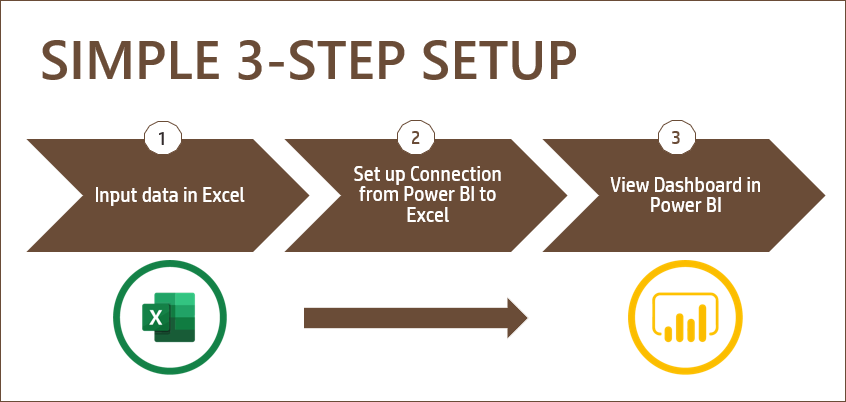
Simple 3 Step Setup
A simple 3-step process to get you started immediately and get instant reports.
You will receive a Power BI file and an Excel file when you purchase. You can download both and save in your local desktop or on cloud drive such as One Drive or SharePoint.
- Enter input data in Excel file
- Set up connection from Power BI file to the Excel file.
- View reports in Power BI
Training Dashboard Power BI Excel Template Demo
Our Promise
Our promise to you is that after downloading this Training Dashboard Power BI Excel Template, within 15 minutes,
You will have a clear and simple streamlined process to enter and manage Training data.
You will have instant access to important Training metrics such as Training ROI, Investment per Employee and Enrollment %.
You will have automated interactive reports and analysis including Skills Dashboard, Training Analysis by Department and Analysis of Trainings.
You will have insights about your training program that you can use to take decisions and improve Training ROI.

Wonderful