Description
Gantt chart is the most common method used to visualize project schedules. The Gantt Chart Excel template allows one to easily create Gantt charts instantly.
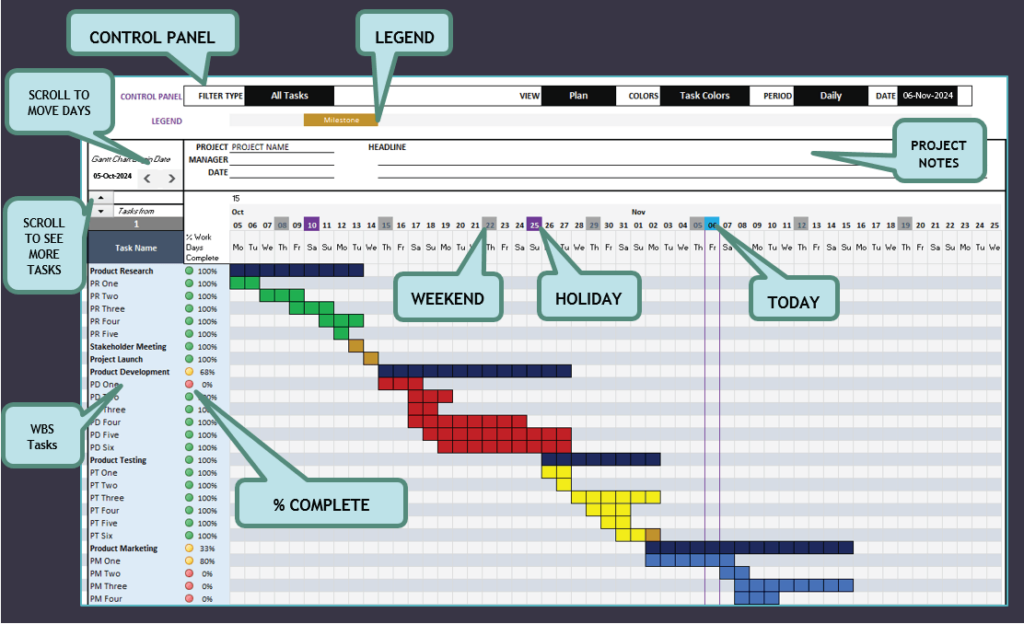
-
- Applicable to projects of any size
- Projects can span across days, weeks, months or years
- Create two levels of Tasks (WBS – Summary tasks and subtasks)
- Summary Tasks’ dates are automatically calculated based on subtasks
- Multiple views (Plan, Actual, Actual vs Plan or Current Status)
- Simple and easy data entry
- Automatic End Date calculation
- Exclude Holidays & Weekends as non-working days
- Enter Actual dates only where there is variance
- Option to use automatically calculated % of Work Days complete or user input
- Control which tasks are displayed
- Filter to select tasks easily
- Show only summary level tasks or Milestones
- Show tasks of one resource
- Incomplete tasks, and delayed tasks are automatically identified
- Visualization
- Assign each task a color. Assign each resource a color.
- 10 colors available (4 of them are theme based)
- Milestone markers are automatically created
- Output
- Ready to print. Or export as PDF and share
- Extension possibilities
- 52 periods (days/weeks/months/years) are shown at a time. Can be extended.
- View 40 tasks at a time by default. Can be extended.
- Applicable to projects of any size
-

Applicable to projects of all sizes
The Gantt Chart Excel template can be used for projects of all sizes. You can choose to view the Gantt chart by Daily / Weekly / Monthly / Yearly.
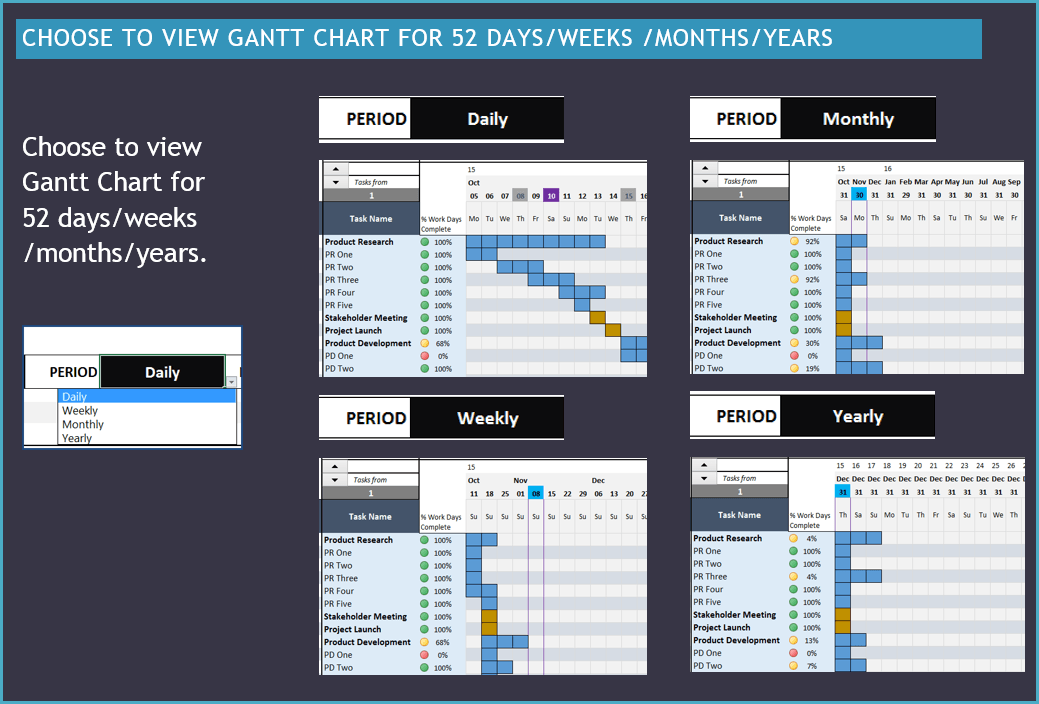
Gantt Chart – Excel Template – Daily/Weekly/Monthly/Yearly Work Breakdown Structure (WBS) – Two Levels of Tasks
You can create two levels of tasks (Summary and Subtask) easily. By default all tasks are summary tasks. Just choose ‘Subtask’ in task type while entering. For summary tasks, Start and End Dates are automatically calculated based on Subtasks. They are also shown in bold font.
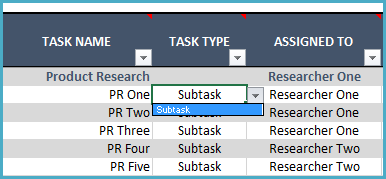
Gantt Chart Excel Template – WBS Four different views
You can choose from 4 different views of the data. View 1) Plan, 2) Actual, 3) Compare Actual vs Plan or 4) Current Status.
- Plan represents the plan schedule.
- Actual represents the Actual schedule.
- Actual vs Plan shows actual schedule in comparison against the plan schedule.
- Current Status shows the Actual schedule, but it shows the work completed as of today vs the future.
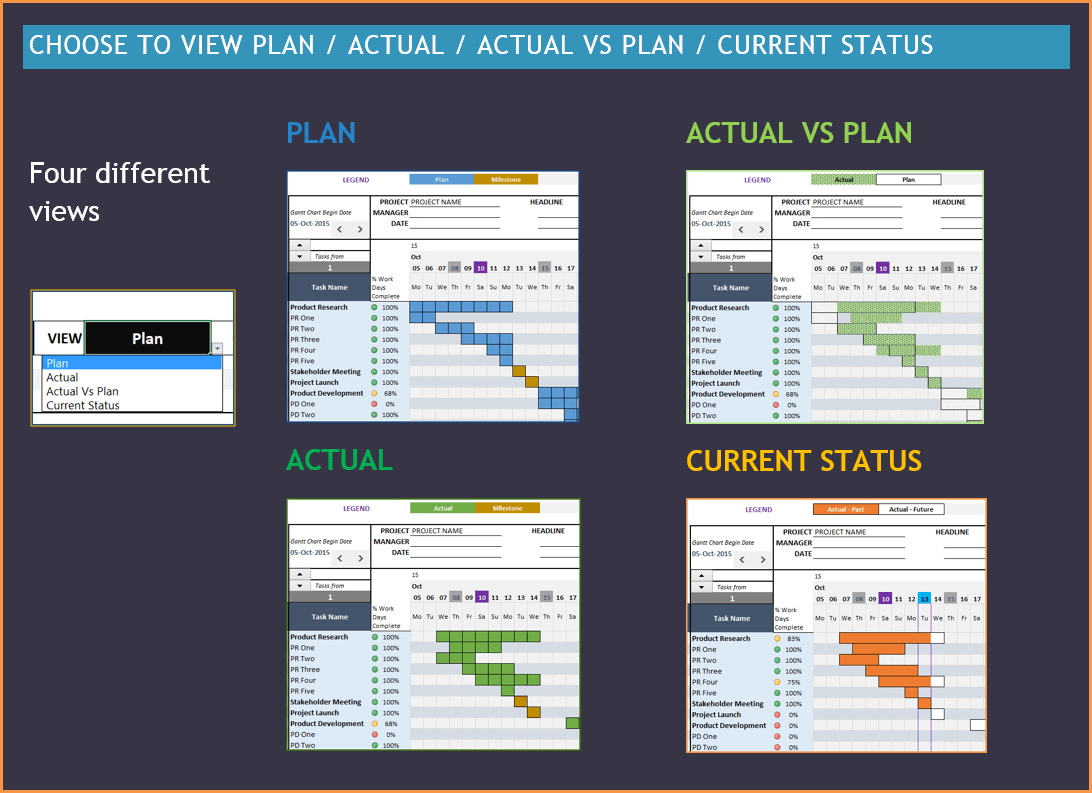
Gantt Chart Excel Template – 4 Views Plan, Actual, Actual Vs Plan, Current Status Simple and Easy Data Entry
In the Gantt Chart Excel Template, data entry is simplified to save time.
- Enter Task Name.
- Choose Task as Subtask if it is one.
- Assign the task to a resource
- Enter Planned Start date and duration. Plan End Date will be calculated by the template.
- For Actuals, enter change in duration if there is variance from plan.
- Enter Actual Start date only if there is variance from plan.

Gantt Chart Excel Template – Data Entry Optional inputs are available to meet your additional needs.
- You can flag certain tasks as Milestones.
- You can track % Work complete
- A custom column is available to track additional information on each task.
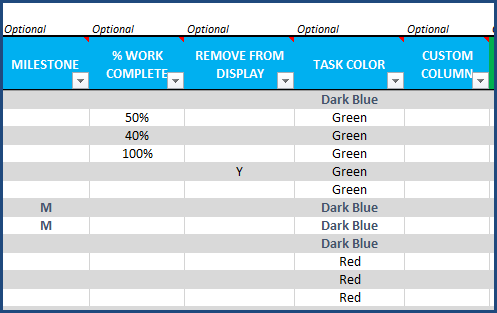
Gantt Chart Excel Template – Optional Data Input Holidays and Weekends are accounted for.
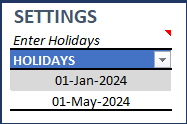
Gantt Chart Maker – Excel Template – Holidays 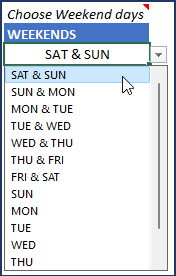
Gantt Chart Maker – Excel Template – Weekends % Complete
There are two options here. You can use the % of Work Days Complete that is automatically calculated as ‘number of work days of actual work done as of today’ divided by ‘number of work days of actual work scheduled for the task’. Or you can choose to enter your own ‘% Work Complete’ in the input table (shown above).
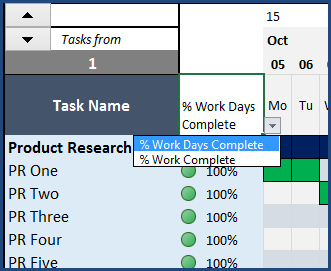
Gantt Chart Maker – Excel Template – % Complete It will appear on the Gantt Chart with conditional formatting showing 0% complete as Red, 100% complete as Green and in between as Yellow. You can also decide to not to show any % Complete information by choosing blank in the drop down menu. It’s all about user control. 🙂
Control tasks to display
In the Gantt Chart Excel template, you can choose not to show certain tasks on the Gantt chart by entering Y in the ‘Remove from Display’ field in the Data entry sheet.
Also, on the Gantt Chart itself, you have several options.
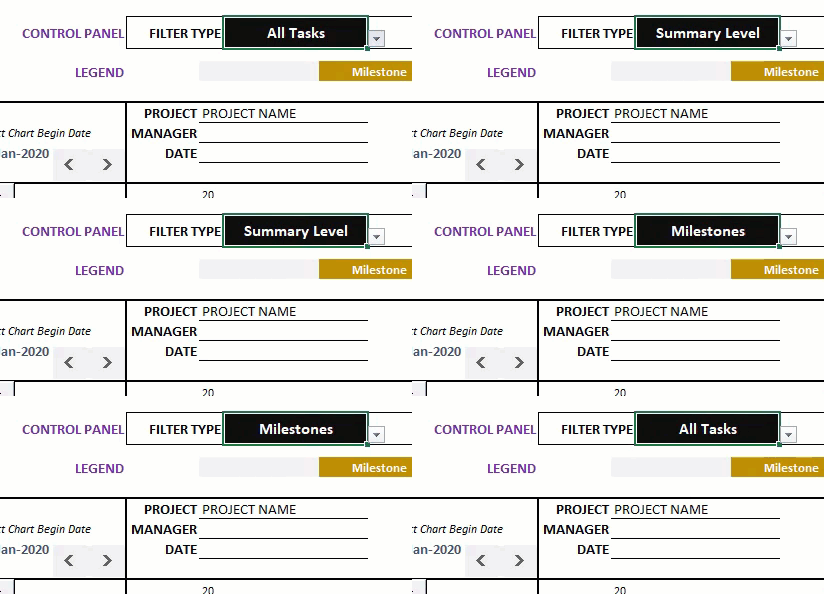
Gantt Chart Maker – Excel Template – Filter Types Choose to view only Summary Level, only Milestones or all tasks. You can also easily filter to delayed tasks (Actual End Date > Plan End Date) and Incomplete tasks (Actual End Date > Today).
In addition, choose a specific resource and only see the tasks assigned to that resource.
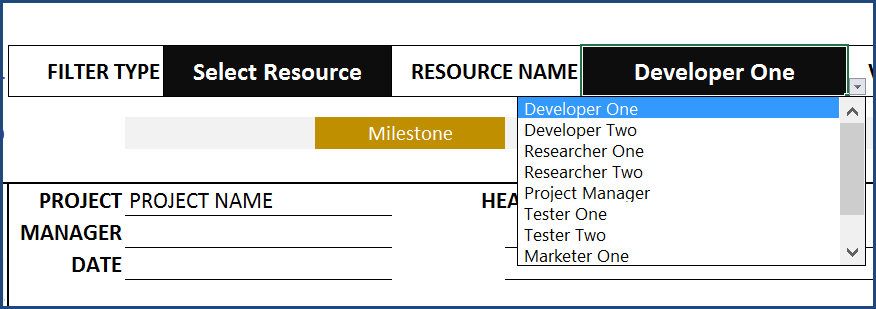
Gantt Chart Maker – Excel Template – Resource Tasks Visualization
You can assign each task a color. You can also assign each resource a color. 10 colors are available.
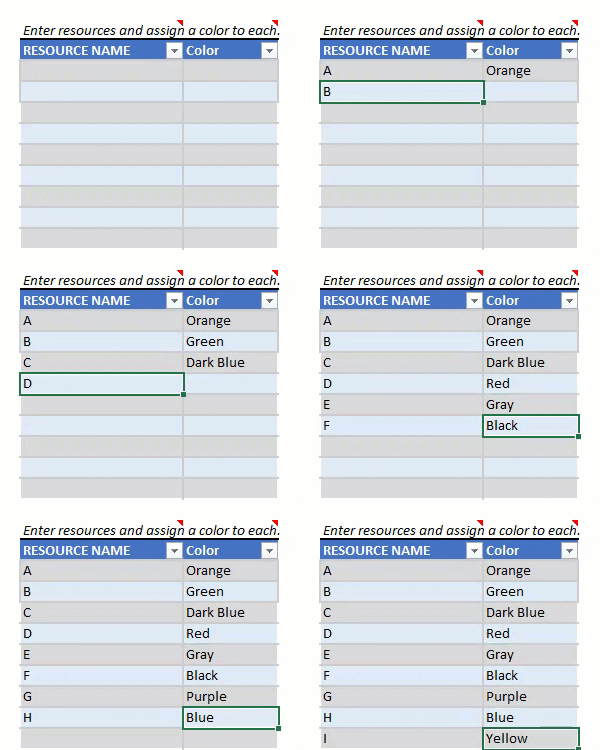
Gantt Chart Maker – Excel Template – Colors On the Gantt Chart, you can choose to view default colors, task colors or resource colors. It’s all up to what view you would like to present for the specific purpose. Of course, you can switch back and forth as needed.
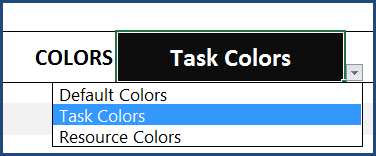
Gantt Chart Maker – Excel Template – Color Choice Output
The Gantt chart is set ready to print. If you would like to print only a portion, you can change the print settings in Excel as usual. You can also export to PDF and share.
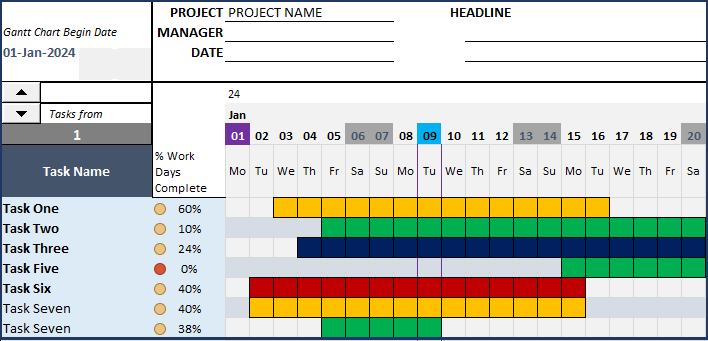
Gantt Chart Excel Template – Gantt Chart -

Gantt Chart Excel Template – Gantt Chart Gantt Chart Excel Template Demo
Try it out yourself with this demo below. Use the filters and see the dashboard get updated instantly. For fully unlocked version please purchase the template.
-
Extension
In the Gantt Chart Excel template, 52 periods and 40 tasks are displayed at a time. You can extend easily as needed. Calculation sheet (hidden) accounts for up to 100 tasks. This can be extended if needed.
This is a regular Excel file with formulas and conditional formatting. No macros or programming. Hence, you can extend this as needed. The Gantt sheet is protected to avoid making unintentional edits. You can unprotect using indzara as password and make changes.
Notes
- Task duration is entered in days (not hours).
- Predecessors are not automatically handled. User will input each task’s plan start date directly.
- Automatic scheduling based on resource availability is not available. Please see Project Planner (Advanced) for that functionality.




Gantt Chart Maker Three sheets concept reduces time to a great extent in understanding the template.is very simple to use and you are ready in just minutes.
Very easy to use and fast setup.
Can’t wait for the next update, hopefully they find a better way of creating dependency between tasks instead of formulas.
Nevertheless it’s a 5 Stars for me!
Very good Gantt Chart and very helpful for project management and task presentation.
Thank you Indzara.
I purchased this template on 21-Oct-2021. No doubt, the template is neat and helpful for various kinds of projects but i found that it isn’t suitable for me where i want to track the production processes of my manufacturing business where we assemble components to make a final product and where components themselves consists of many pre-assembled operations. The other two premium templates which i purchased are indeed very helpful though.
A great GANTT template. This is so useful for many projects as usually finding and creating GANTT plans for various purposes can be a bit of a pain. This template is very easy to use for different projects.