
Description
Want to supercharge your SMA (Simple Moving Average) trading strategy? Our powerful Google Sheets template makes backtesting effortless, seamlessly analyzing data and gaining instant insights, all within Google Sheets. Analyze historical data, fine-tune your strategy, and make smarter trading decisions with ease. Get started today!
What is backtesting?
Backtesting is testing your trading strategy using historical data.
Using real historical data, you can simulate the trading results as if you had used the specific trading strategy with the specific stock.
You can not only identify if the strategy is a profitable one or not. You can also fine-tune your trading parameters and try to find a profitable strategy.
Though the past results are not guaranteed to happen in the future, your trading decisions will be based on past results and not just guesswork.
Let’s take an example.
-
- Stock: NSE:JPPOWER
- Testing period: From Jan 1, 2024 to Dec 31, 2024
- Strategy: Whenever a day closes with Buy Signal, enter a long trade the next day and when a day closes with Sell Signal, exit a long trade the next day.
- SMA Length: 9
- Capital invested: ₹ 10,000
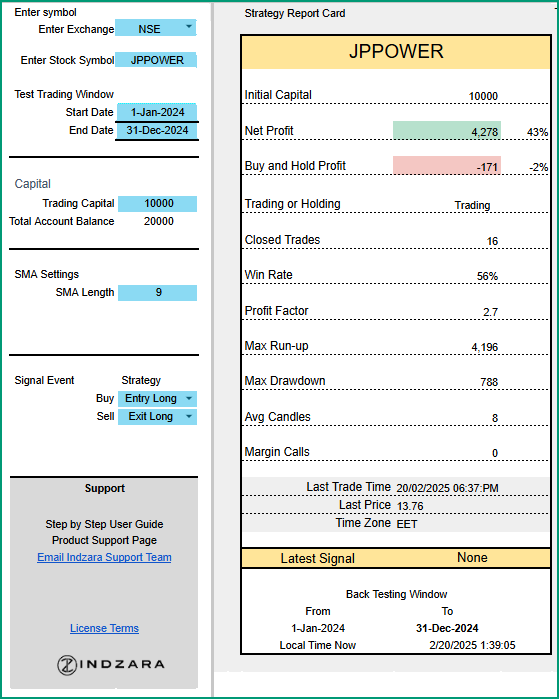
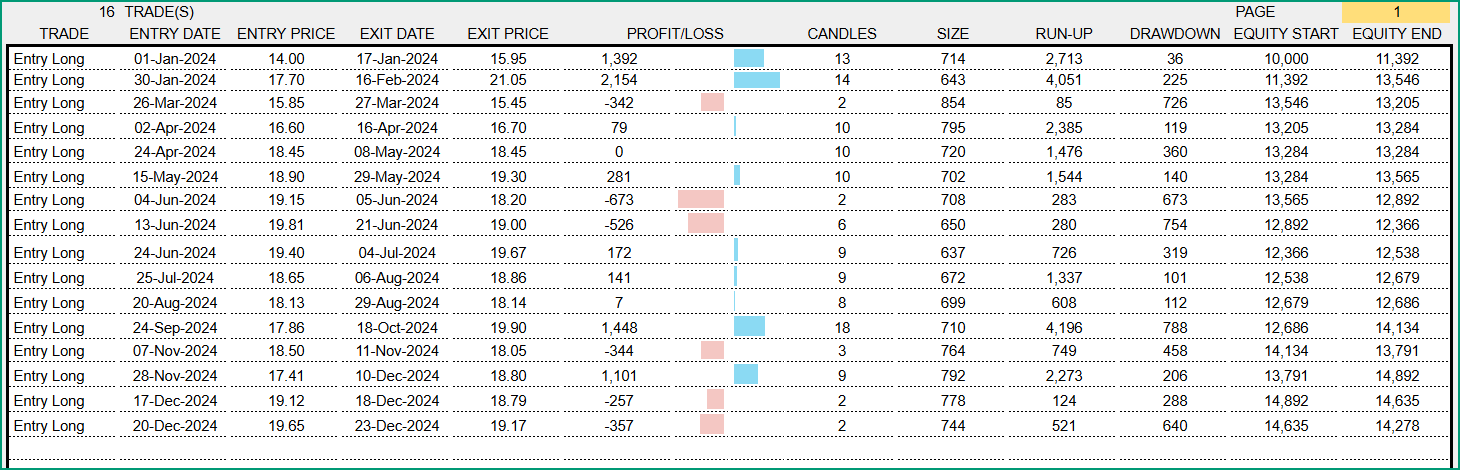
If I had used the above simple trading strategy using SMA(Simple Moving Average) indicator to drive my trading decisions, I would have made ₹ 4,278 profit. I would have closed 16 trades, with a win rate of 56% and Profit factor of 2.7
What if we bought and held the shares instead of trading?
If we had not executed these 16 trades and had followed a buy-and-hold strategy we would have incurred a loss. In this specific example, trading would have been the better strategy.
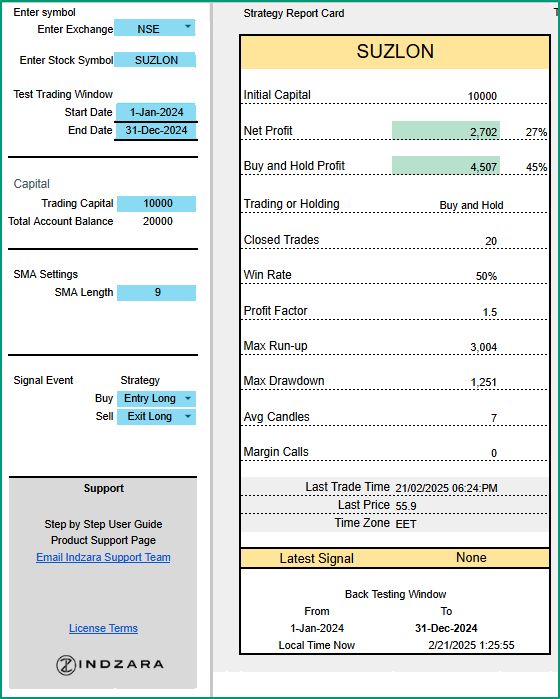
This is just to illustrate the tool’s capability. This does not mean that trading is always the better strategy. Other examples might prove that buying and holding may be the better strategy. For example, if we had tried the same strategy with SUZLON stock, the results would have been different.
Why backtesting?
This is a risk-free method to test your strategies on real historical data as you are not using real money to trade.
You can try many different strategies to find one that works for you.
Disclaimer
We do not offer financial or trading advice. Our template is another tool to help you make smarter data-driven trading decisions. Our template automates the calculations based on your own strategy inputs. Indzara.com is not responsible for any trading decisions taken.
Easy to Use
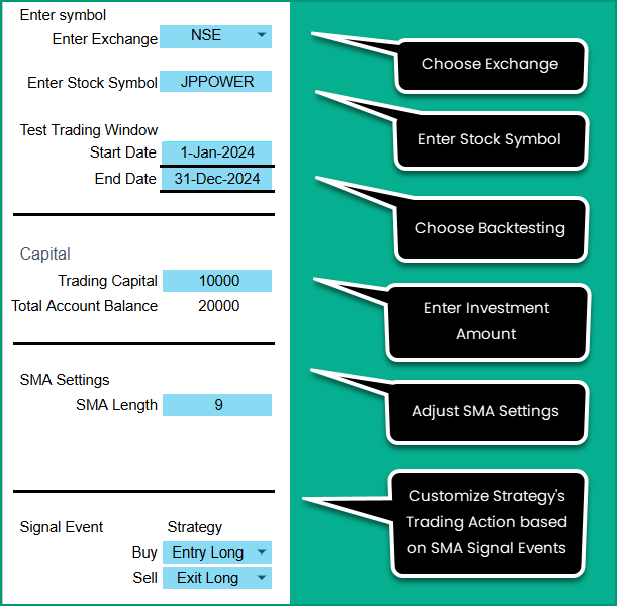
Enter 5 Simple inputs (Stock symbol, Test window, SMA settings, Trading strategy, and Capital Investment) and view the backtesting results instantly.
Customizable/Flexible
- Each trader has a different approach when it comes to trading strategy and the template allows you to customize the settings for the SMA(Simple Moving Average) indicator.
- You can also choose what trading action you would like to take based on the signal events from the SMA(Simple Moving Average) indicator. For more on the SMA indicator, please see this article
- The template supports Long and Short trading
Accurate
For traders, having accurate data is very crucial and we have verified our calculations with the results from the TradingView.com website.
Designed for Insights
Charts and calculations are designed and presented in a way to aid quick and confident decision-making.
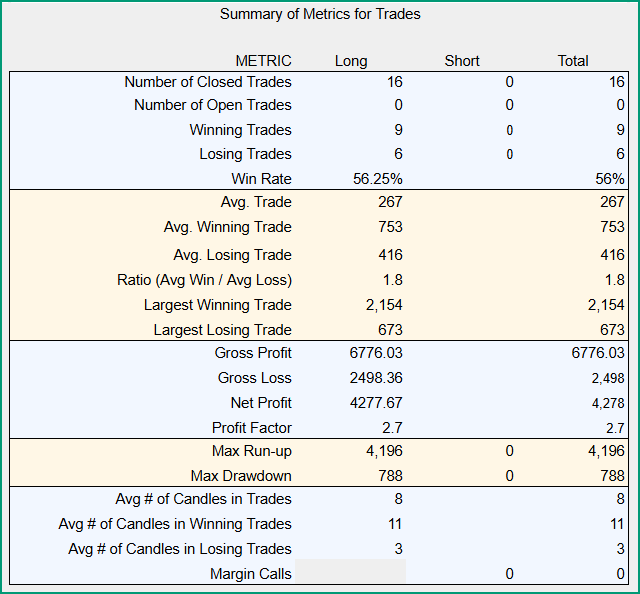
Metrics included in the template
- Number of trades (Closed/Open)
- Win Rate %
- Avg. Trade Profit/Loss
- Avg Win/Avg Loss Ratio
- Net Profit
- Profit Factor
- Max Run-up
- Max Drawdown
- Avg # Candles per trade
- Margin Calls
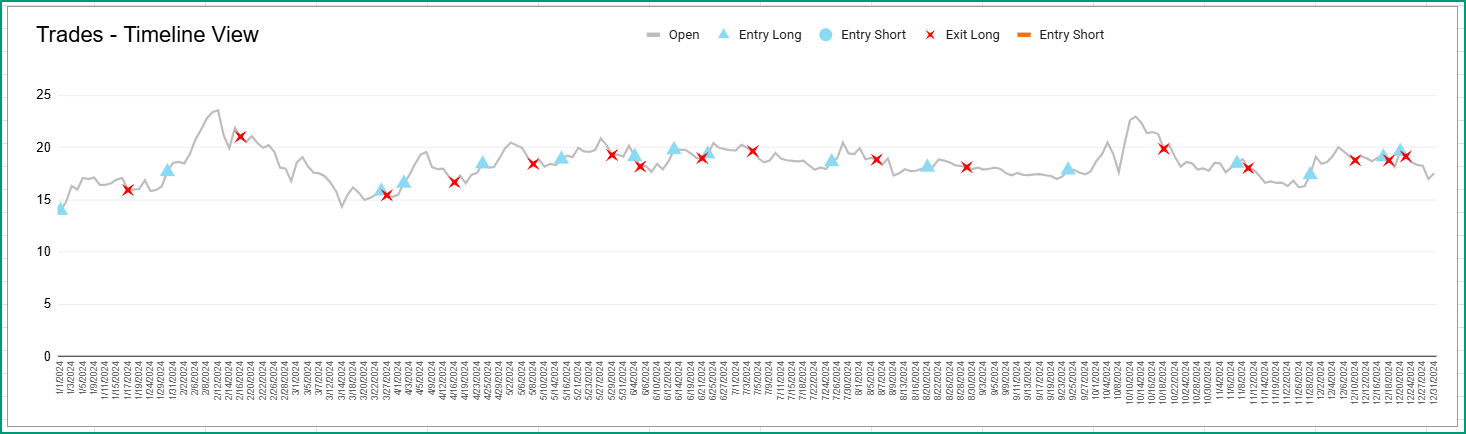
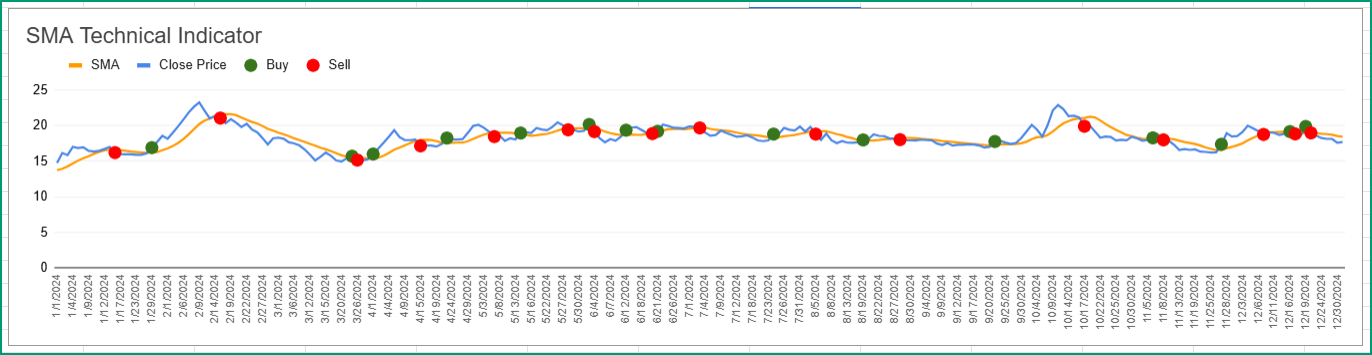
Timeline View
View the trades on a timeline chart showing exactly when and what type of trades are made based on strategy.
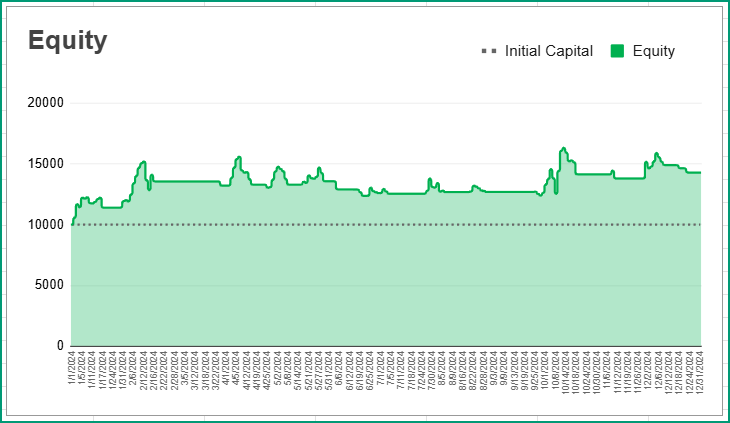
Equity Trend Chart
View the trend of your equity over time during the backtesting period.
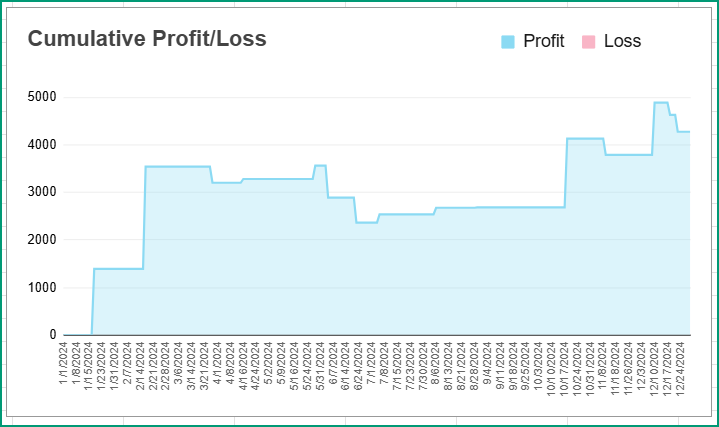
Cumulative Profit/Loss Chart
View the trend of profit/loss over the backtesting period.
List of Trades
In addition to the summary metrics and charts, you can view the specific trades in detail.
SMA(Simple Moving Average) Chart
A customizable SMA(Simple Moving Average) chart that shows the SMA line, Price line and Signals. You can also enable the signal events.
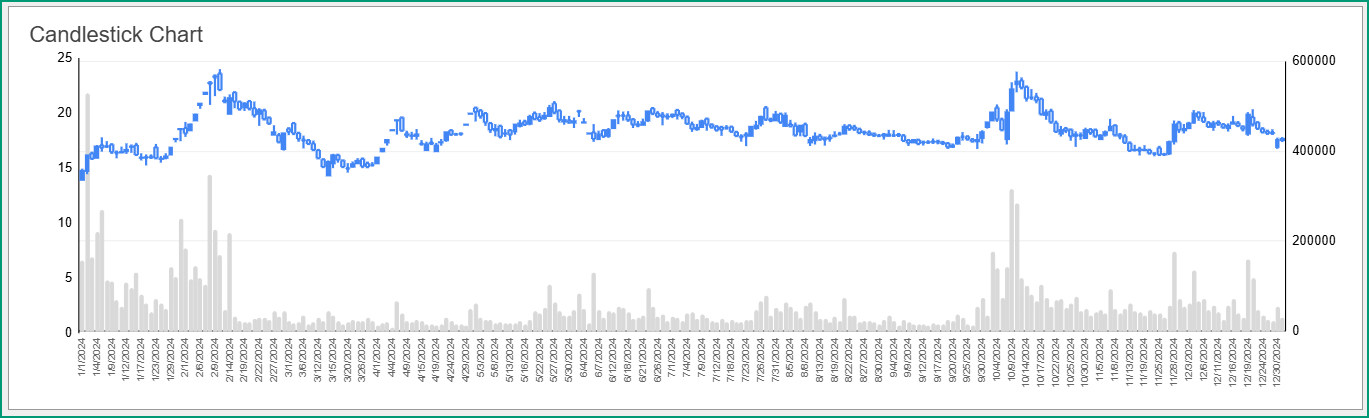
Candlestick Chart
A standard candlestick chart that shows the candles, along with the volume bars.
Requirements
To use this solution to backtest SMA trading strategies, you need the following two.
1. Google Sheets template
Purchase the template from this page here for an affordable one-time fee. Our template uses the Market data and automates all the calculations involved in backtesting.
2. Internet connection
You need to connect to the internet to get market data.
Application / Limitation
- The template can be used for Swing Trading using daily market prices. The template cannot be used for intra-day trading. Google services do not provide data at minute or hourly intervals. For any queries please contact us.
- Since the template uses market data from Google services, only the stocks, indices and currencies that are available in the Google service can only be analyzed. Not all symbols are available from Google.


Reviews
There are no reviews yet