You can use this template to track the Indian Stock market performance.
Download
Template features
This template can be used to view the India. stock market performance.
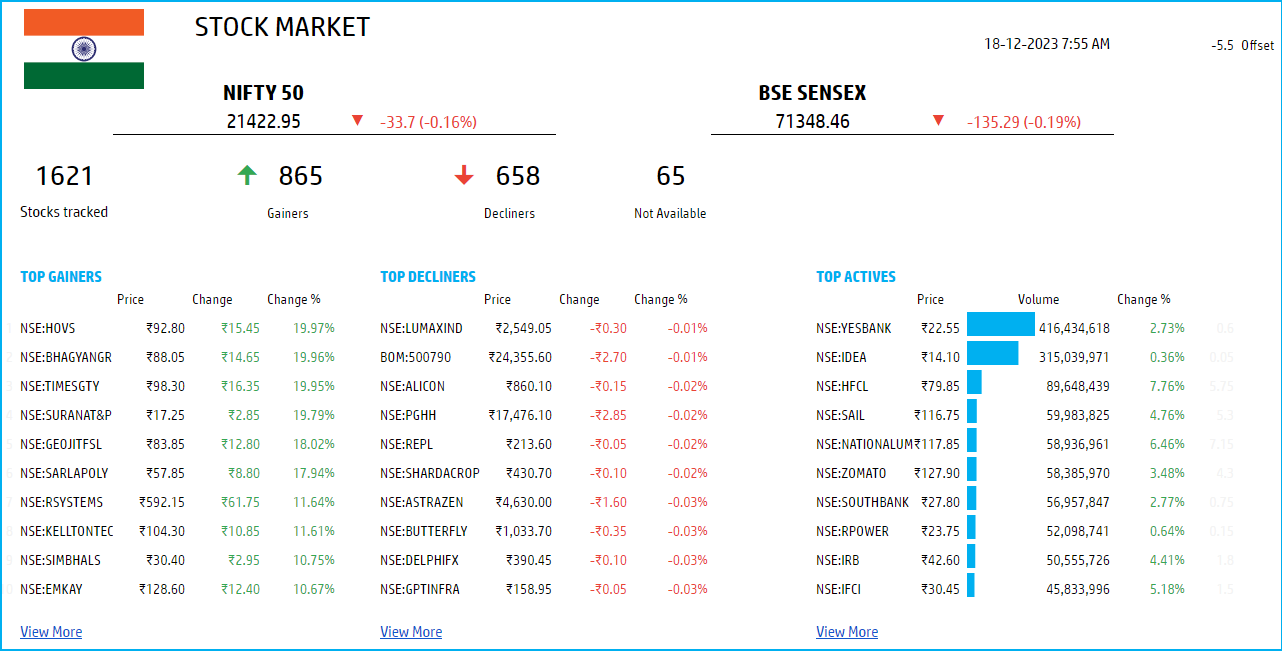
- Automatically shows the major indices – NIFTY 50 and BSE SENSEX
- 1621 stocks are tracked for performance – 65 are currently not available
- New stocks can be added easily
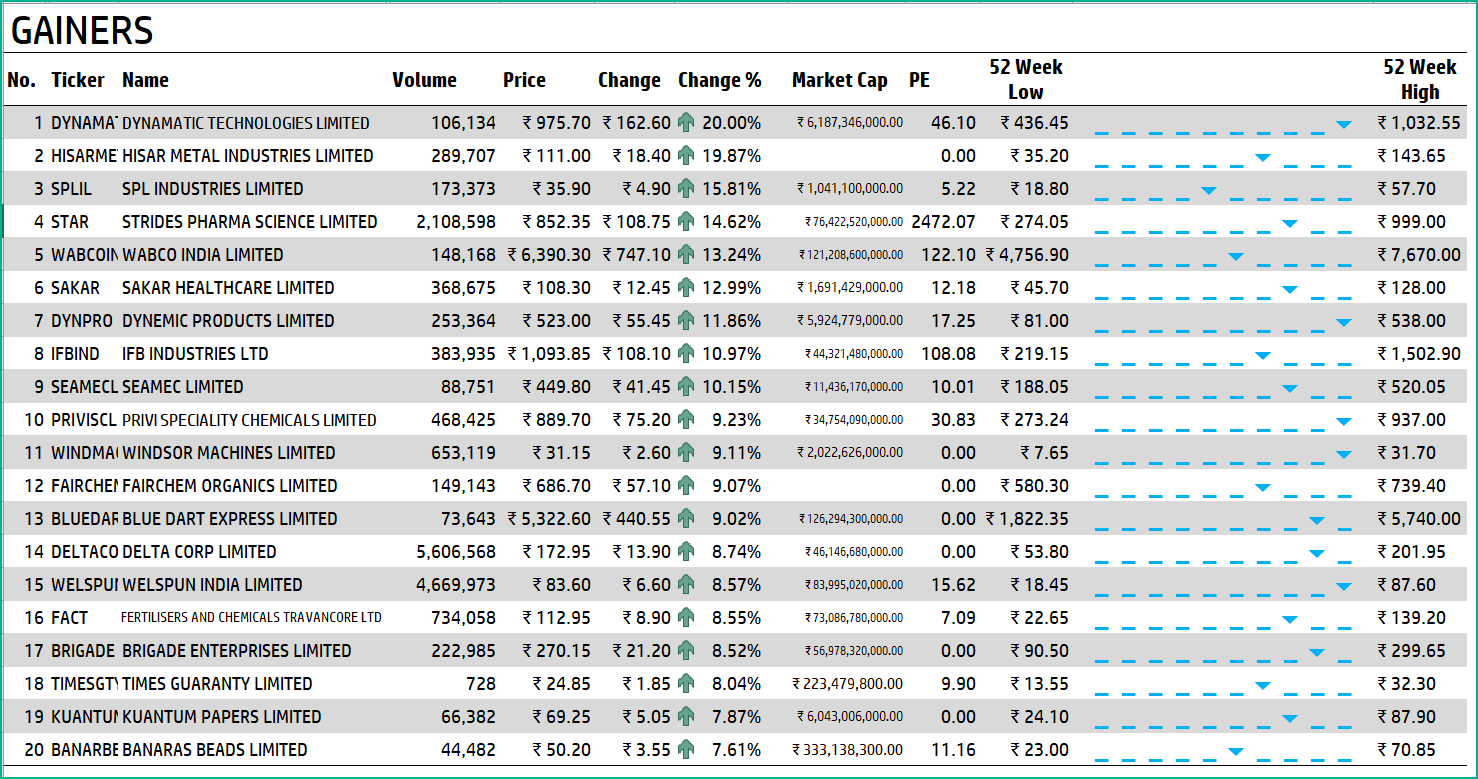
- View the top gainers (stocks which increased in price, ranked by Change %)
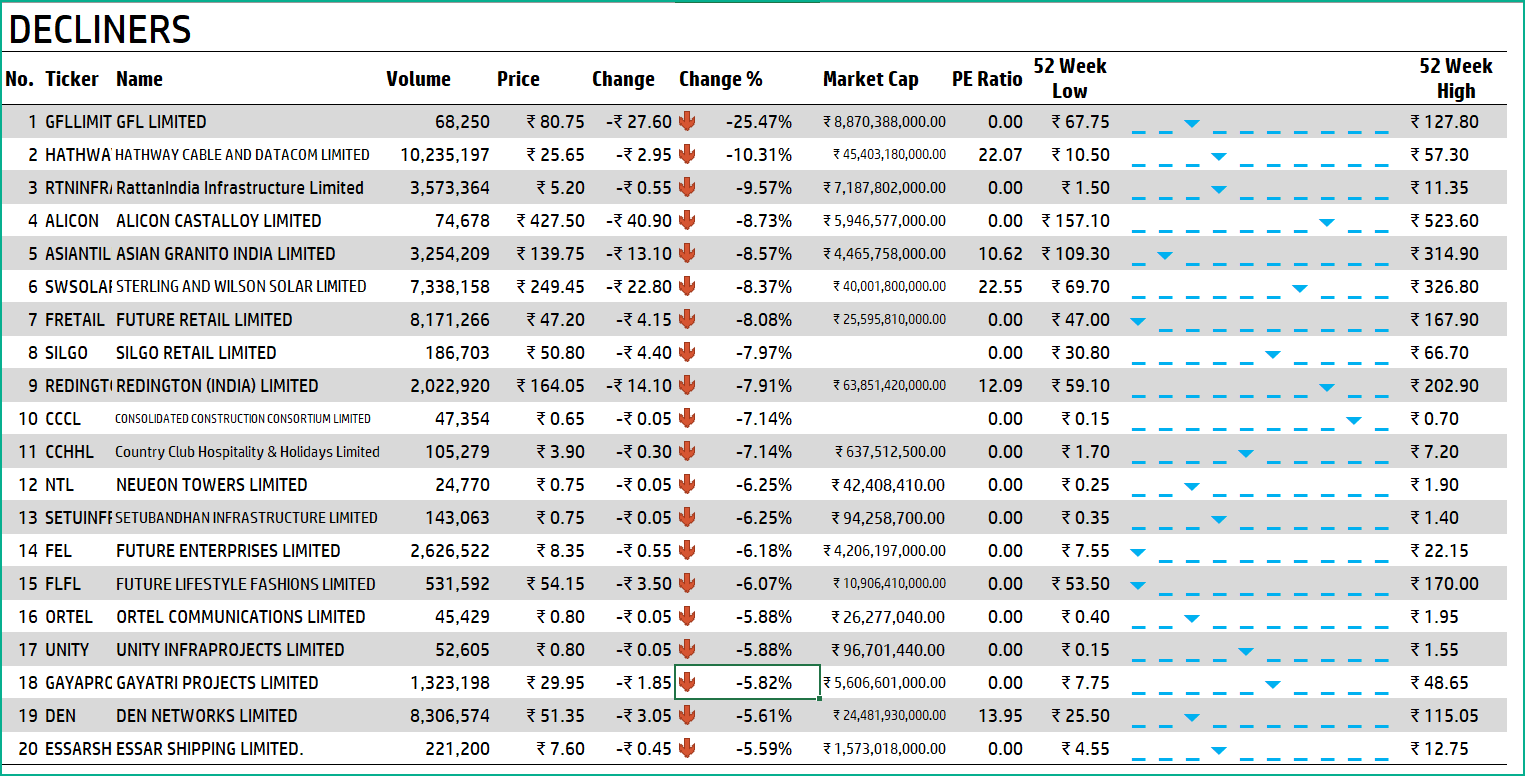
- View the top decliners (stocks which decreased in price, ranked by Change %)
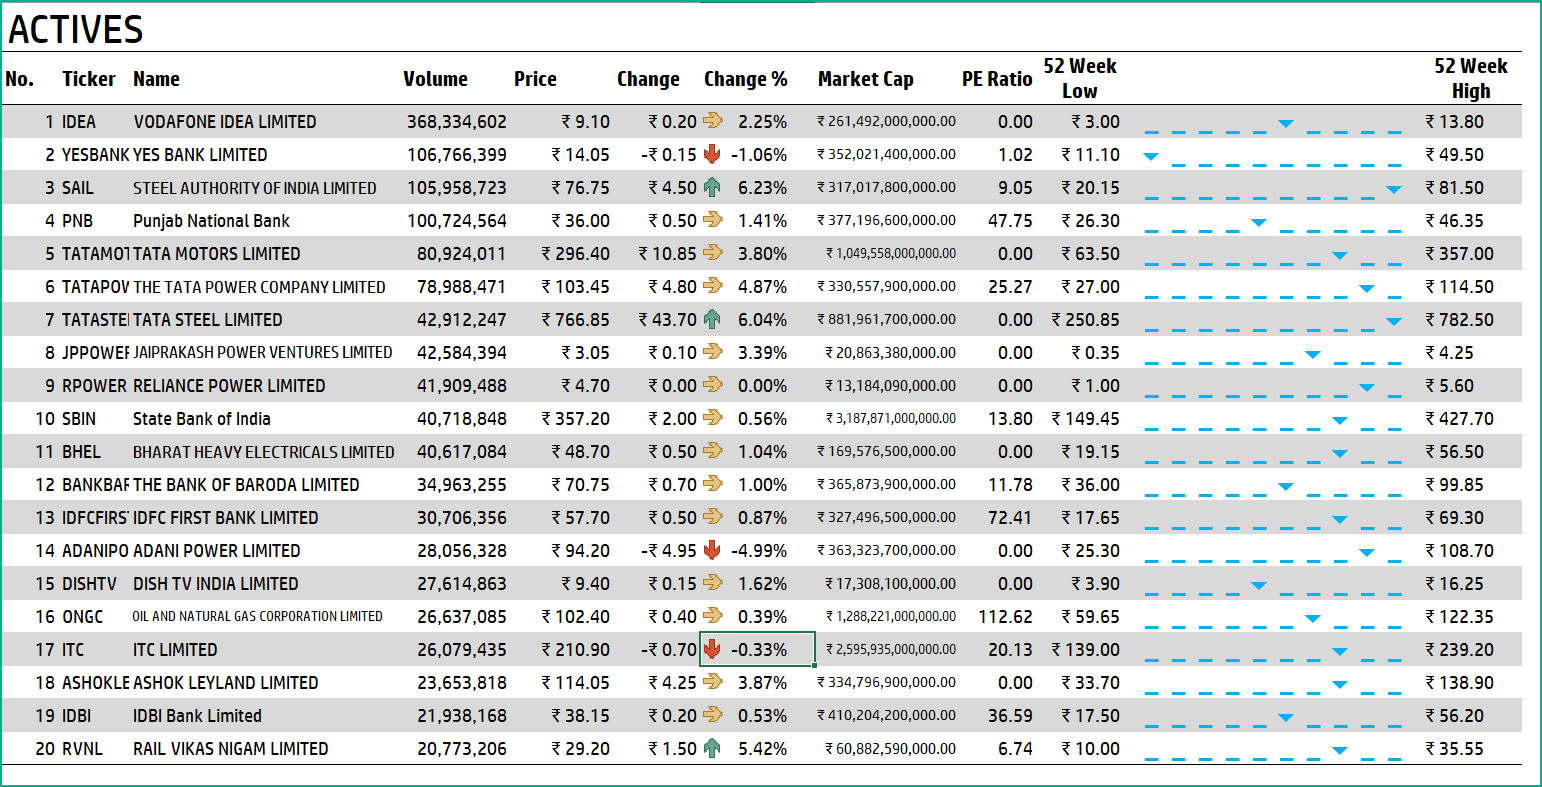
- View the most actives (stocks which traded most in volume, ranked by Volume)
- See more details on the top gainers, top decliners and most actives
The foundation of this template is by using the “googlefinance” function available in Google sheets.
Indices
Two of the most used indices in the Indian stock market are NIFTY 50 and BSE SENSEX.
Dashboard shows the indices’ current price, change in price and change %.

You can also see that of the 1621 stocks that make up the indices, how many gained in price and how many declined in price.
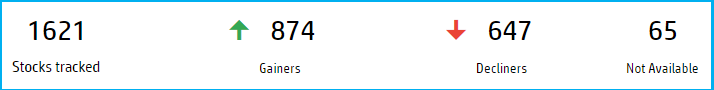
In the above screenshot, 874 gained and 647 declined. 65 stocks are not mapped.
On the top right you can see the maximum of the last trade time of all the stocks.
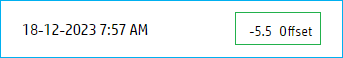
The default time that Googlefinance functions provides is UTC, we convert that to Indian Standard Time via the offset of 5.5 hours.
Visit https://savvytime.com/converter/utc to view offset
Top Gainers
The dashboard shows the Top gainers of the day.
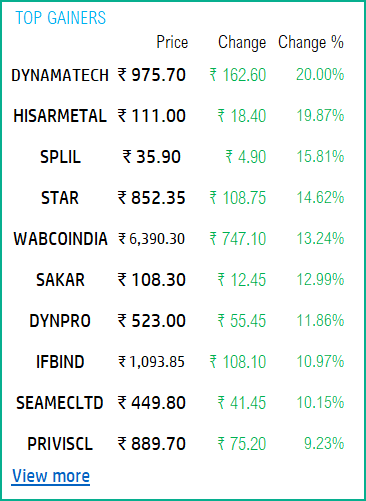
In the Gainers sheet, you can see more details about the top gainers. You can also see top 20 stocks that gained.
Top Decliners
The dashboard also shows the top decliners of the day.
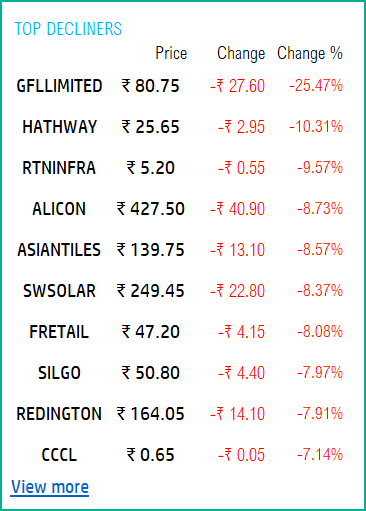
You can see more details of these stocks and also top 20 stocks that declined in price, in the DECLINERS sheet.
Top Active Stocks
Finally, the dashboard also shows the top 10 stocks that are active (by trading volume) on the day.

To see top 20 stocks that were active and also see more details such as 52 week price range, please see the ACTIVES sheet.
Here is the link to the article from Google Finance which shows which exchanges are available and the delay in data refresh for each.
How to add more stocks?
Please unhide the hidden DATA sheet and add stock symbols to that table. Edit the corresponding named ranges to include the added rows. Please reach out to us at support.com if you need further clarifications.
-
 SMA Strategy Backtester Google Sheets Template$25
 -
SMA Strategy Backtester Excel Template$25
-
RSI Strategy Backtester Google Sheets Template$25
-
RSI Strategy Backtester Excel Template$25
-
MACD Strategy Backtester Google Sheets Template$25
-
MACD Strategy Backtester Excel Template$25
-
 Simple Moving Average Stock Screener Google Sheet Template$25
 -
Stock Screener Excel Template$97
-
Simple Moving Average Stock Screener Excel Template$25


Feedback
Please share your experience. I expect this to be different with different exchanges and countries. Is it working for you? Is it working differently? I would love to hear from you.