Are you ready to follow the twists and turns of the 2024 U.S. Presidential Election in real-time?
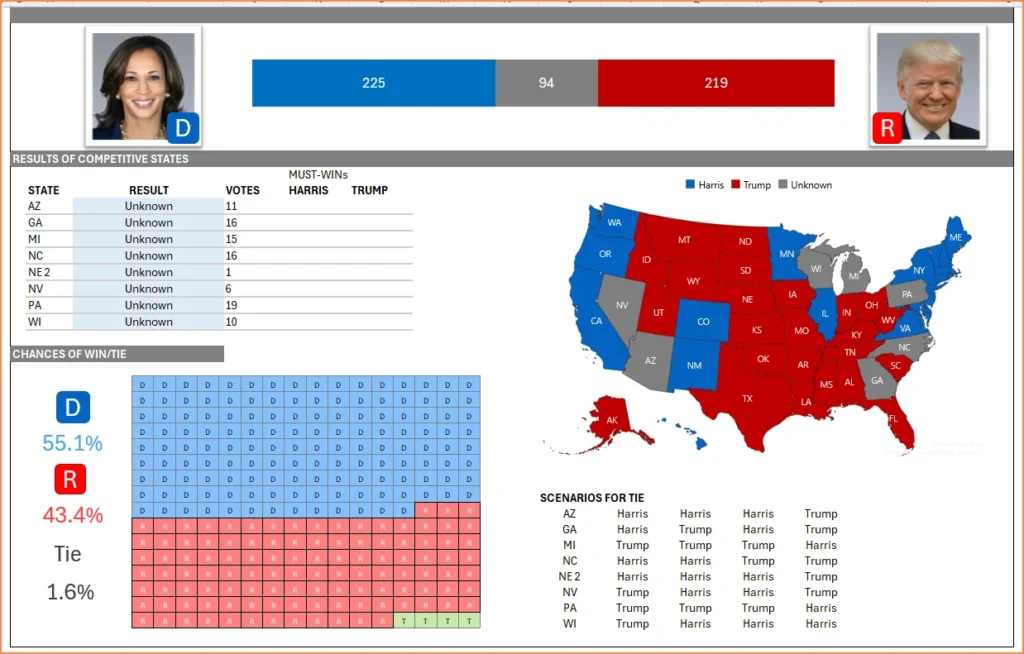
Our U.S. Presidential Election Tracker template brings the excitement of election night right to your fingertips! This easy-to-use Excel template allows you to enter your predictions for each state, instantly calculating electoral votes for each candidate.
Plus, it’s equipped to provide you with insights on the probability of each candidate’s path to victory or even the chance of a tie. Whether you’re following the election casually or enjoy deep analysis, this tool helps you keep track of one of the most significant events in modern democracy with clarity and precision. Dive in and see how your predictions might stack up against the final results!
Setup
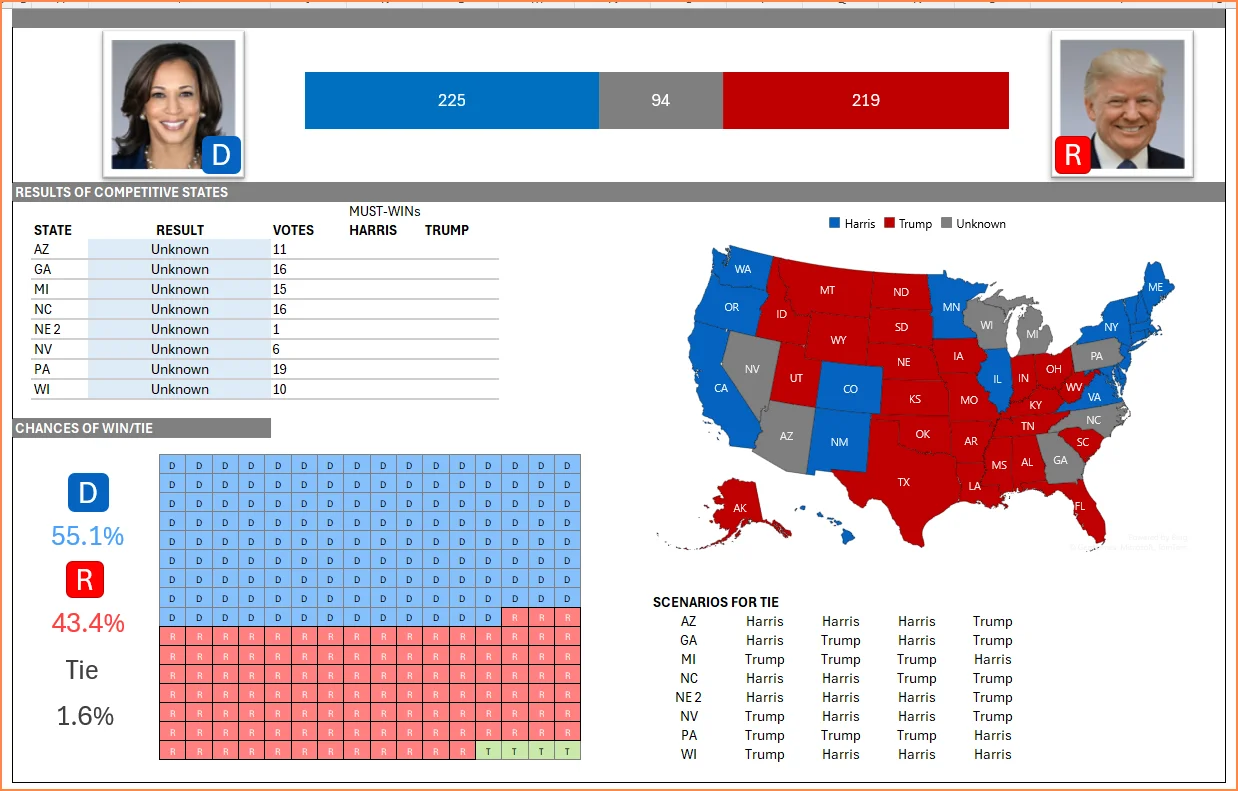
On the left side of the template, you can see the following:
- All the states are listed, along with the congressional districts at the bottom.
- The electoral votes for each state are also listed.
- The names of the winners – ‘Harris ,Trump’ have already been chosen for states that are considered decided
- For the competitive states (7 states and 1 congressional district) still in play, the option ‘Unknown’ is chosen.
On the right side of the template, you can see the following:
- The electoral votes for each candidate and a grey bar indicating the number of unpredicted electoral votes.
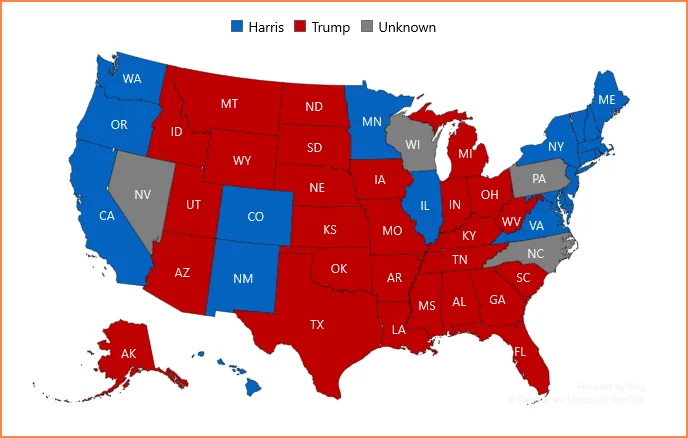
- A geographic map that updates based on changes in the results of the competitive states.
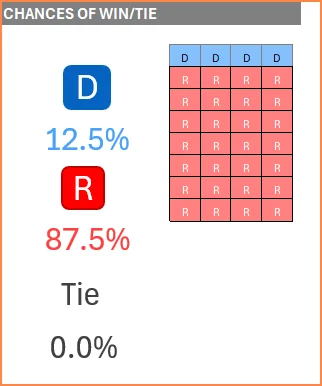
- Chances of a Republican win, Democratic win, or a tie.
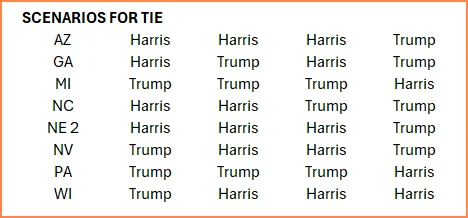
- Scenarios for a tie.
Video Tutorial
How to use the US Election Tracker Template?
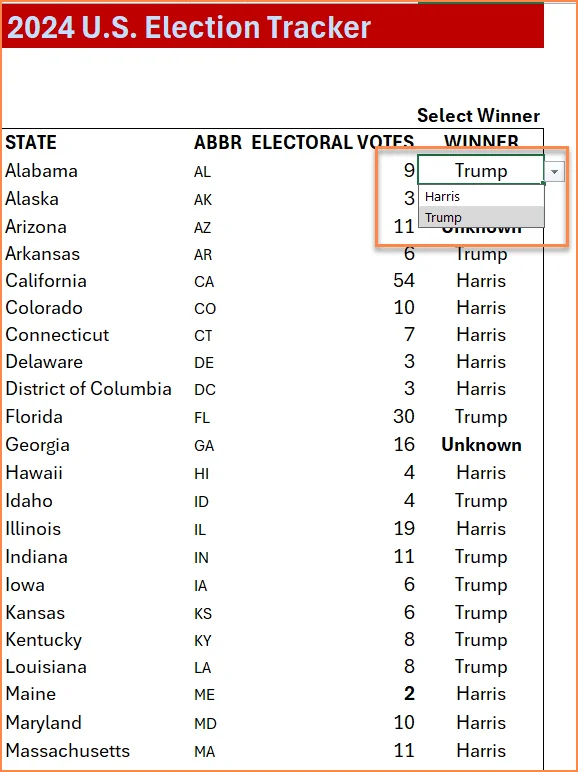
Step 1 : Enter winner for the non-competitive states
Choose the winner from the dropdown for the non-competitive states – Harris or Trump.
Step 2: Total electoral votes for each candidate is calculated
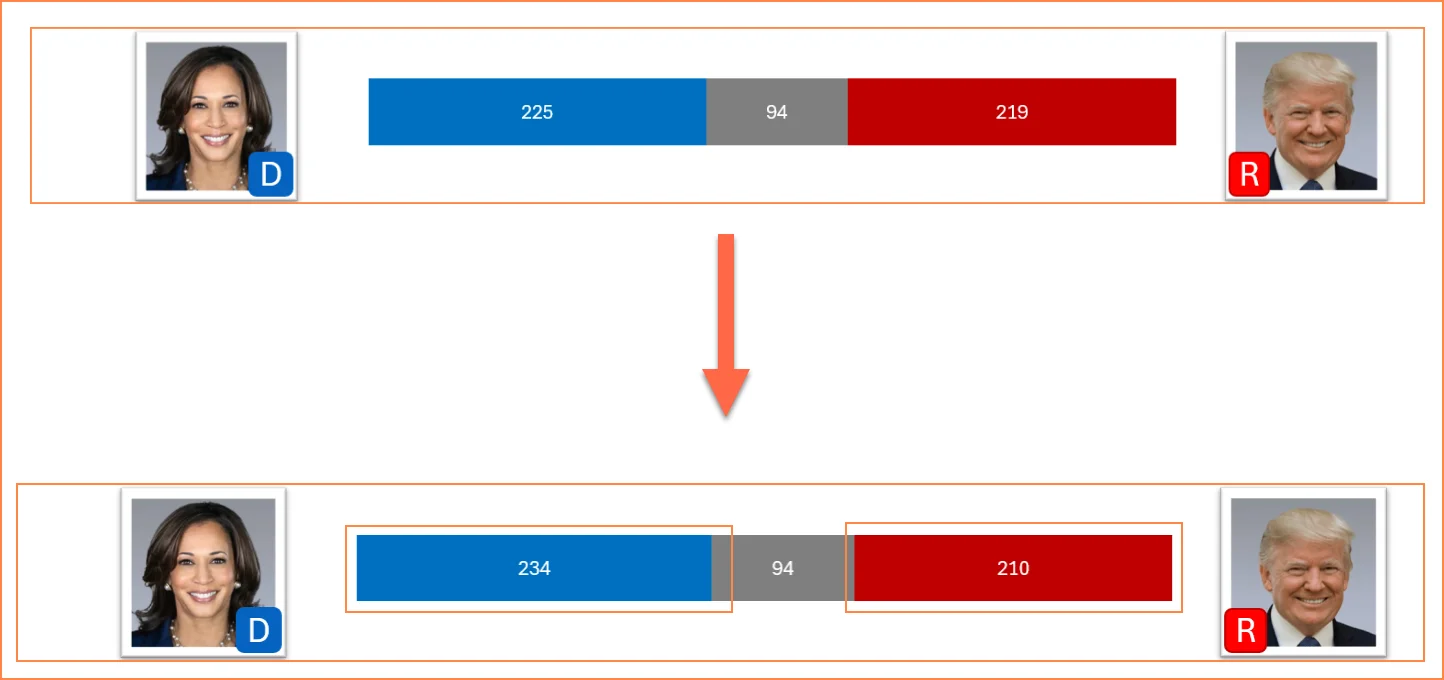
Template calculates the total electoral votes for each candidate and the votes undecided.
For example, if you predict the Democratic candidate to be the winner in Alabama, the number of electoral votes for the Democratic candidate will automatically increase.
Step 3: Enter the winner/prediction for the competitive states
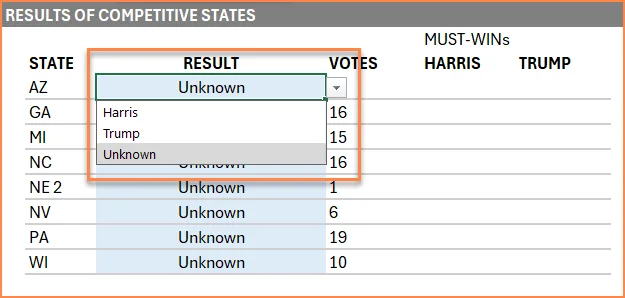
Choose the winner/prediction from the dropdown for the competitive states from the ‘Results’ dropdown – Harris or Trump.
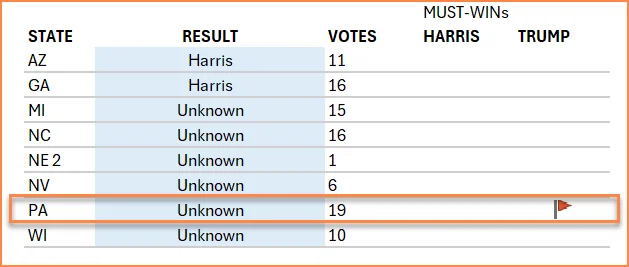
Step 4: Must Win State indicated with Red Flag
As you enter more of the states, any must-win state will be shown with a red flag for each candidate
When a candidate is predicted to win certain key states, specific remaining states may become ‘Must Win’ for the opposing candidate to secure their path to victory, highlighted with a red flag to indicate their critical importance.
Example if suppose you predict that the the Democratic candidate would win in Arizona and Georgia then the Republican candidate ‘Must Win’ in pennsylvania and that is marked with the Red Flag
Step 5: The US map updates automatically
The US map will automatically update as you enter the data.
- Grey color indicates the undecided States.
- Red color indicates the Republican won States.
- Blue color indicates the Democratic won States.
Step 6: Waffle chart showing the chances of win of the remaining undecided States
Waffle chart on bottom left shows the chances of win for each candidate, given the remaining undecided states
For example, if Republican candidate wins AZ, GA and MI. there will be 5 remaining states to be decided. Tere are 32 possible combinations and out of those, 4 lead to Democratic victory and 28 lead to Republican win. So, the waffle chart shows 12.5% D win and 87.5% R win.
Step 7: Scenarios for a tie
The Scenarios where there will be a tie (and no winner) are shown in the bottom right.
Conclusion
Our U.S. Presidential Election Tracker template allows you to enter your predictions for each state. Whether you’re a political enthusiast or just curious about the impact of each swing state, this tool will help you anticipate the winner. Download from below.
Download 2024 U.S. Elections Tracker
Download Free 2024 U.S. Elections Tracker


