Average Headcount

Average Headcount HR metric

What (Definition)

Average Headcount represents the average of headcount in a company during a time period or date range.

Why (Benefits)

Headcount is a metric that can change every day (as new employees can join and existing employees can leave the company). When we calculate HR metrics such as turnover rate, we need a single headcount number as a reference or baseline. This is where an average headcount metric will be useful.

How (Calculation)

Formula:

Average headcount during the period = (Starting Headcount + Ending Headcount)/2

Let’s take an example dataset where we have headcount calculated at the start of each month.

Average Headcount calculation – HR metrics

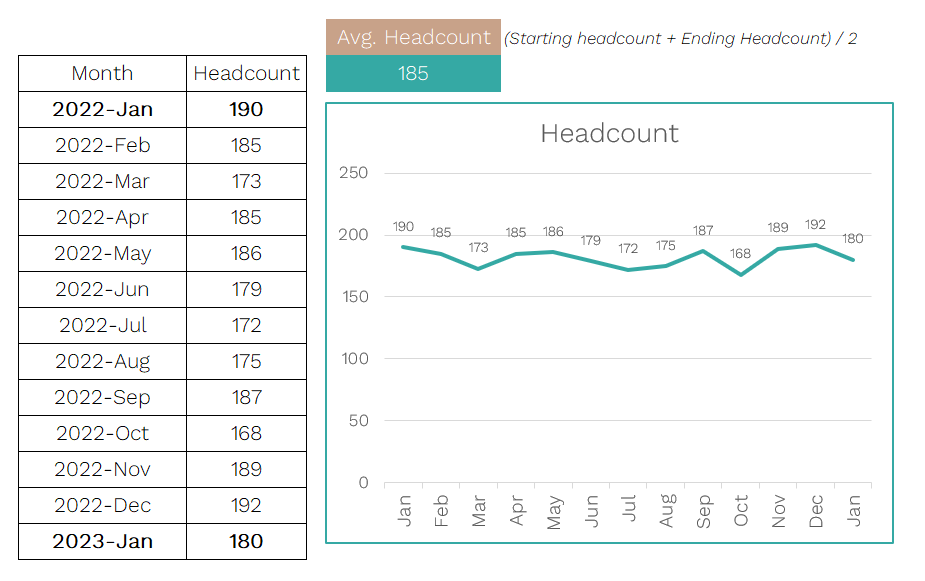
As we can see the headcount fluctuates monthly.

The headcount on January 1st, 2022, was 190 and headcount on Jan 1st, 2023, was 180.

The average headcount during 2022 is (190+180)/2 = 185.

Related Products

  • Human Resources Toolkit Excel Templates

Get automated HR metrics for your company with our templates
(Available in 3 platforms: Microsoft Power BI, Google Sheets or Microsoft Excel)

  • Human Resources Toolkit Excel Templates

Related Posts

HR Metric - Applications per Open Position

Applications Per Open Position

Gain insights into ‘Applications per Open Position’, a crucial HR metric, to understand recruitment demand and optimize hiring strategies. A key metric for HR professionals aiming to balance candidate influx with open job positions efficiently.

Read More »
HR Metric - Pending Applications

Pending Applications

Discover the significance of ‘Pending Applications’ in HR metrics; learn why tracking them is key for recruitment efficiency and how to manage them effectively.

Read More »

Now it’s your turn.

Do you measure the number of applications reaching a stage during the hiring period in your company? Please share your thoughts on how you do it below. We would like to hear from your experience.

To learn more about other recruiting metrics please visit HR Guides