
What (Definition)
Headcount Change Month over Month (or Headcount Delta Month over Month) measures the change in Headcount this month compared to previous month.
Why (Benefits)
Headcount changes are very common in all companies. New employees join and existing employees may leave anytime. A growing company sees increase in headcount and during tough economic times, companies may have to reduce headcount to cut expenses. Monitoring headcount changes is extremely important.
While the absolute headcount metric is useful to know the number of employees, this metric Headcount Change measures the change in headcount.
This metric allows us to focus easily on the change whether this is up or down and the magnitude of the change.
Let’s take the 2 charts below.
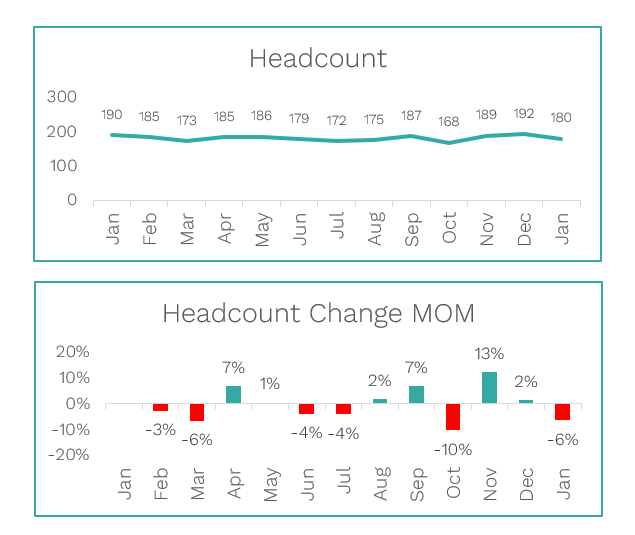
While the first one shows the headcount trend monthly, the second chart shows the change in headcount as a %. While the first chart can inform us of the overall trend, minor changes are not easily visible. This is where the second chart is useful. It shows the direction of change (increase or decrease) very clearly.
How (Calculation)
Formula:
Headcount Change Month over Month
= (Headcount in current month – Headcount in previous month)
Headcount Change Month over Month %
= (Headcount in current month – Headcount in previous month) / (Headcount in previous month)
Let’s take an example. You can see below a table of monthly headcount data in our fictional company.
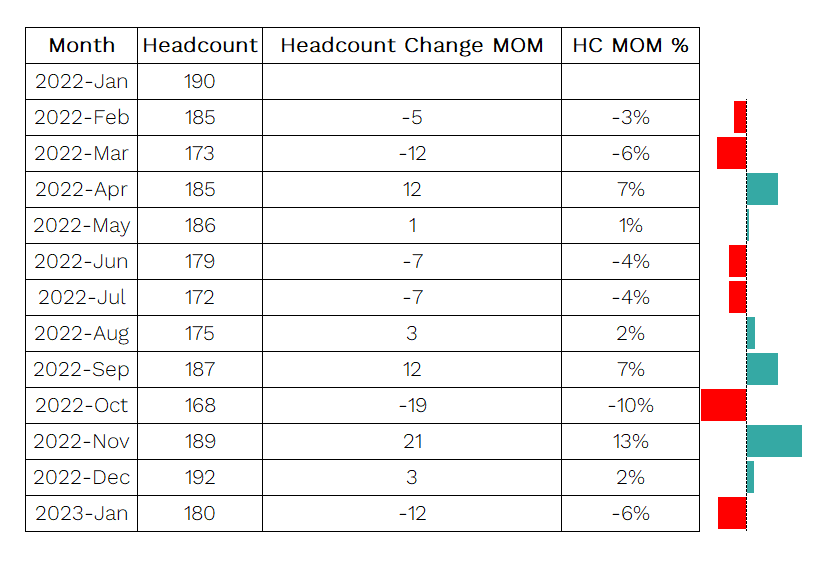
We have calculated Headcount Change (MOM) as Current Month headcount – Previous Month headcount.
For example, 2022-Feb had 185 employees while 2022-Jan had 190. That is a reduction in 5. Hence it is -5.
We also calculate this Headcount change as a %. For 2022-Feb, it is (-5 / 190) = -3%
Headcount reduced by 3% in 2022-Feb.