HR Guides

HR Metrics

Smarter
HR Decisions

HR (Human Resource) metrics are measurements that help us evaluate different aspects and elements of HR processes with the goal of improving them.

HR organization needs to pay close attention to these HR metrics to understand the current performance and set targets to improve. Having accurate HR metrics will enable smarter HR decisions that will lead to positive value to the business.

There are many ways to categorize HR metrics. The metrics and their categorization can also vary by organization size, country, culture and other company attributes. We present a generic categorization that should apply to most companies. If you have any suggestions, please post them below in the Comments section.

Administrative HR Metrics

HR Administrative Metrics
  1. Headcount: Count of employed people in a company at any given point of time.

  2. Average Headcount: Average headcount during the period. (Starting Headcount + Ending Headcount)/2

  3. % of Headcount: Headcount for a specific selection as % of Total headcount

    • Example: Headcount in Accounting Department as % of Total company headcount.

  4. Headcount Change Month over Month (MOM): Headcount compared to headcount a month earlier

    • Example: Headcount by end of February is 110, Headcount by end of January was 100. So, it’s a 10% increase.

  5. Headcount Change Year over Year (YOY): Headcount compared to headcount a year earlier

    • Example: Headcount by end of 2022 Dec is 110, Headcount by end of 2021 Dec was 100. So, it’s a 10% increase.

  6. Average Employee Tenure: Average of tenure (duration from employee start to current day) of active employees

  7. Median Employee Tenure: Median of tenures (duration from employee start to current day) of active employees

  8. Median Employee Age: Median of Age of active Employees (as Average measurement can be sometimes misleading)

  9. Maximum Annual Salary: Maximum of actual salaries of active employees

  10. Minimum Annual Salary: Minimum of actual Salaries of active employees

  11. Median Annual Salary: Median of actual salaries of active employees

  12. Total Annual Salary: Sum of actual salaries of active employees

  13. Average Annual Salary: Average of actual annual salaries of active employees

  14. Diversity %: Number of Employees belonging to a diversity group out of all active Employees in company. This could be used for any kind of diversity measurement. Example: Gender, Ethnicity and Race.


Recruiting Metrics

Recruiting Metrics
  1. Hired Positions: Count of employees hired during the period.

  2. Hiring Cost: Sum of all costs involved with recruiting employees who were hired during the period

  3. Cost per Hire: Average cost of hiring a candidate for a job. [Hiring cost / Hired Positions]

  4. Avg Time to Fill: Average number of days between Job Posted Date and Employee Join Date for employees hired during the period

  5. Avg Time to Hire: Average number of days between Application date and Candidate Hire Date for employees hired during the period

  6. Avg Days Hire to Join: Average number of days taken from HIRE DATE to JOIN DATE for employees hired during period

  7. Percent of All Hires: % of Hires coming from a selected application source out of all Hired applications regardless of source.

    • Example: [Number of Hired Positions from LinkedIn source/ Total Number of Hired Positions]

  8. Avg Days taken for each stage: Number of days taken from one stage of recruitment to next.

  9. Applications: Number of applications received during the period.

  10. Applications reaching a stage: Count of Applications reaching a specific recruitment Stage.

  11. Offers given: Number of applications received during the period and reaching Offer Stage.

  12. Offer %: % of Applications reaching Offer Stage (or Hire Stage) out of all Applications Received. Offer Stage is the penultimate stage. All applications received during the period are considered.

  13. Offer Acceptance %: % of Applications hired out of all applications reaching offer stage.

  14. Conversion %: % of Applications received that got Hired. [Number of Applications Hired/ Number of Applications Received]

  15. Open Jobs: Number of jobs currently in open status and being hired for.

  16. Avg Days in Market: Average number of days in market for all jobs with OPEN status.

  17. Pending Applications: Number of applications which have not been decided on yet.

  18. Applications per Open Position: Average number of applications pending per Open Job. [Pending Applications / Open Jobs]

  19. # of Recruitment Stages: Number of stages in Recruitment or Hiring process

  20. Applications Hired: Number of applications which were received during the period and got hired at any point of time.

  21. Quality of Hire: Employees who perform satisfactorily out of all employees hired during the period. This is typically measured through a qualitative survey or annual performance review with the employees’ managers after a certain period.

Onboarding Metrics

Onboarding Metrics
  1. New Joiners: Count of employees who started at company during the period.

  2. Eligible Joiners: Count of employees who joined during the period and have completed 90 days of tenure. This metric will help calculate early 90-day churn rate.

  3. 90-Day Leavers: Count of employees who joined during the date range and left the company within 90 days of tenure.

  4. 90-Day Churn Rate: [90-day Leavers/ Eligible Joiners]. When measuring this metric, we need to give at least 90 days for calculating churn rate accurately.

  5. Being Onboarded: Count of active employees who have not completed onboarding.

  6. Onboarding Completions: Count of employees who started at company during the period and who have completed onboarding.

  7. Onboarding Completed %: % of employees who have completed onboarding out of all employees who joined the company during the period. [Onboarding Completions/ New Joiners]

  8. Avg. Onboarding Time: Average number of workdays taken for onboarding to complete for employees who joined during period. This could also be called as ‘Time to productivity’.

Training Metrics

Training Metrics
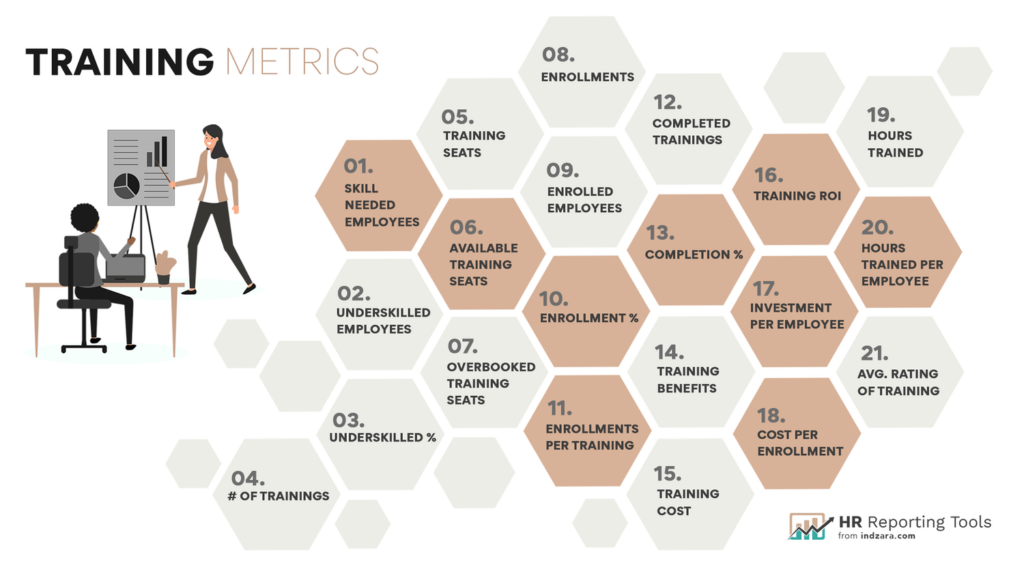
  1. Skill Needed Employees: Count of employees that are active now and is expected to have skills in at least one skill.

  2. Underskilled Employees: # of active employees with at least one skill at a level less than expected skill level.

  3. Underskilled Employee %: % of employees that are underskilled and need to upskill. [Underskilled Employees/Skill Needed Employees]

  4. Count of Trainings: Count of trainings available during the period

  5. Training Seats: Total number of seats (booked and available) for all Trainings

  6. Available Training Seats: Number of seats available in ongoing Trainings

  7. Overbooked Training Seats: Number of seats overbooked in Ongoing Trainings

  8. Enrollments: Number of enrollments for trainings during date range

  9. Enrolled Employees: Number of distinct employees with enrollments during date range

  10. Enrollment %: % of active employees who enrolled in training during period. [Enrolled Employees / Headcount]. Headcount represents the headcount at the end of the period

  11. Enrollments per Training: Average number of enrollments per training. [Enrollments / Count of Trainings]

  12. Completed Trainings: Number of enrollments who also completed trainings during the period

  13. Completion %: % of enrollments that were completed. [Completed Trainings/Enrollments].

  14. Training Benefits: Total benefits of all training enrollments during period.

  15. Training Cost: Total Cost of all enrollments during period.

  16. Training ROI: Return on Investment for training. [(Training Benefits – Training Cost) / Training Cost]

  17. Investment per Employee: Average investment for training per active employee. [Training Cost / Headcount]

  18. Cost per Enrollment: Average cost of training per enrollment during period. [Training Cost / Enrollments].

  19. Hours Trained: Sum of number of hours of training by employees who enrolled during period.

  20. Training Hours per Employee: Average hours of training completed per active employee. [Hours Trained/Headcount]

  21. Avg. Rating of Training: Average of rating given by employees who enrolled and completed training during period.

Employee Performance Metrics

Performance Metrics
  1. Performance Reviews: Count of performance reviews during the period

  2. High Performers %: % of employees with ‘High’ performance score for the period chosen. (High Performers/ Total number of Performance Reviews)

  3. Low Performers %: % of employees with ‘Low’ performance score for the period chosen. (Low Performers/ Total number of Performance Reviews)

  4. Employee Promotion Rate: Number of employees with promotion during the period out of all active employees. [Promoted Employees/Headcount]

Employee Satisfaction Metrics

Employee Satisfaction Metrics
  1. Net Promoter Score: A measure of employee satisfaction with the role and company. This is measured through an anonymous survey to employees. Calculated as [(number of promoters – number of detractors)/number of responses]

  2. Public Employee Reviews: There are public websites where employees can post their reviews about the company. These could also serve as an indicator of satisfaction of company’s employees (past and present).

Time Management Metrics

  1. Total Capacity (Man Days): Total # of Man Days of capacity during the period.

    • For example, in a week of 5 working days (excluding weekends and holidays) where 10 employees are employed, the total capacity is 10*5 = 50 Man days.

  2. Leave (Man Days): Total # of Man Days of leave planned/taken during the period.

    • For example, in a week of 5 working days (excluding weekends and holidays) where 2 employees are taking leave every day, the total Leave Man days is 5*2 = 10.

  3. Available Capacity (Man Days): Total # of Man Days of Capacity Available to use during the date range selected.

    • For example, in a week of 5 working days with 10 employees, with 2 employees taking leave every day, Total capacity is 5*10 = 50, Leave is 5*2 = 10 and hence Available capacity is 50 – 10 = 40 Man Days.

  4. Availability %: % of Total Capacity that is actually available. [Available Capacity Man Days / Total Capacity Man days]

  5. Employees on Leave: Distinct count of Employees who are on leave on working days during the period.

  6. Calendar Days: Number of calendar days during the period.

  7. Weekend Days: Number of days that fall on the weekend days during the period.

  8. Holidays: Number of company holidays during the period.

  9. Working days: Number of Working Days during the period. Number of Calendar days excluding days which are either weekend and/or holidays.

  10. Non-Working Days: Number of non-working days (holidays and weekends) during the period.

Retention Metrics

Retention Metrics
  1. Total Exits: Distinct count of employees who exited during the period.

  2. Voluntary Exits: Distinct count of employees who exited during the period ‘Voluntarily’

  3. Involuntary Exits: Distinct count of employees who exited during the period ‘Involuntarily’.

  4. Retention Rate: Out of Employees who were active at start of the period, how many were active as of end of period. Expressed as %.

  5. Turnover Rate: (Total Exits during the period) / [(Active employees at start + Active employees at end)/2];

  6. Voluntary Turnover Rate: [Voluntary Exits during the period / Average Headcount during the period] where Average headcount = [(Active employees at start + Active employees at end)/2]

  7. Involuntary Turnover Rate: [Involuntary Exits during the period / Average Headcount during the period] where Average headcount = [(Active employees at start + Active employees at end)/2]

  8. Total Starts: Distinct Count of employees who started during the period.

  9. Regrettable Exits: Number of employees who exited voluntarily the company during the period with a ‘regrettable’ exit.

  10. Regrettable Exits %: % of regrettable exits out of all voluntary exits during the period

  11. Median Tenure at Exit: Median tenure of employees who exited during the period. Tenure is measured as of exit date for each employee.

Salary Grade Metrics

Salary Grade Metrics
  1. Salary Minimum: Minimum Salary for each Salary or Pay Grade

  2. Salary Maximum: Maximum Salary for each Salary or Pay Grade

  3. Salary Midpoint: Midpoint of each Salary or Pay Grade

  4. Salary Range: Difference between Salary Minimum and Salary Maximum for each Salary or Pay Grade. [Salary Maximum – Salary Minimum]

  5. Salary Overlap %: Salary overlap for each Salary or Pay Grade is calculated as [(Salary Maximum of Previous lower Grade – Salary Minimum of Current Grade)/ Salary Range of Current Grade]

  6. Spread: Salary Spread for each Salary or Pay Grade is calculated as [Salary Range of Current Grade/ Salary Minimum of Current Grade]

  7. Midpoint Differential %: Midpoint Differential % for each Salary or Pay Grade is calculated as [(Current Salary Midpoint – Previous Salary Midpoint)/ Previous Salary Midpoint]

  8. Salary Range Penetration: Calculated for each employee, this measures how much of the grade’s Salary Range has the employee already reached based on current salary. [(Current Salary – Salary Minimum of Current Grade) / Salary Range of Current Grade] *100

Financial Metrics

Financial Metrics
  1. Revenue per Employee: Total Revenue of company during the period divided by average headcount

  2. Total cost per Employee: Total expenses of company during the period divided by average headcount

  3. HR cost per Employee: Total HR expenses of company during the period divided by average headcount

You can automate HR metrics and reports for your company using our templates.

Gain insights into 'Applications per Open Position', a crucial HR metric, to understand recruitment demand and optimize hiring strategies. A key metric for HR professionals aiming to balance candidate influx with open job positions efficiently.
Discover the significance of 'Pending Applications' in HR metrics; learn why tracking them is key for recruitment efficiency and how to manage them effectively.
How to calculate the Average Days in the Market metric effectively for your hiring process? How is it useful? Recruitment metrics for HR.
Explore the HR Recruitment Metrics of 'Open Jobs' in this blog post. Understand the implications of open job positions, why tracking this metric is essential for workforce planning, and how to track it effectively.
How to calculate the Conversion% metric effectively for your hiring process? How is it useful? Recruitment metrics for HR.
The Offer Acceptance % metric - Learn the essentials of how this metric reflects candidate responses to job offers, its significance in assessing recruitment efficacy with our dedicated blog post.
How to calculate the Offers Given metric effectively for your hiring process? How is it useful? Recruitment metrics for HR.
How to calculate the Applications metric effectively for your hiring process? How is it useful? Recruitment metrics for HR.
Understand what 'Average Days Taken for Each Stage' metric reveals about each phase of the recruitment process, why it's crucial for efficient hiring, and how to measure and optimize it effectively.
'Percent of All Hires' : Learn what this metric encompasses, its significance in evaluating recruitment success, and how to effectively implement and analyze it. This article is a valuable resource for HR professionals and recruiters seeking to understand the proportion of successful hires in their overall recruitment strategy.
Read along to learn about the 'Average Days: Hire to Join' metric in our comprehensive blog post. Understand the significance of this HR metric, from what it measures to why it's crucial for optimizing the hiring to onboarding process.
Explore the crucial 'Average Time to Hire' metric in our insightful blog post. Understand what this metric signifies in HR, why it's vital for effective recruitment, and how to accurately measure and improve it
Discover what 'Average Time to Fill" metric means, its significance in the recruitment process, and practical methods for calculating this with our dedicated blog post.
Delve into the critical HR metric of 'Cost per Hire' with our insightful blog post. Uncover the essentials of what cost per hire entails, why it's a pivotal metric in HR recruitment, and how to effectively calculate and utilize it
Hiring Cost is a key Recruitment Metric. Read about what it is, how to calculate the hiring cost for your organization and why is it an important metric?
How to calculate total annual salary? How is it useful? Administrative metrics for HR.
Explore the nuances of 'Hired Positions' in our detailed blog post: What is the Hired Position Metric? Why is it crucial and how to calculate this?
What is diversity measurement in organizations? How to calculate Diversity %? How is it useful? Administrative metrics for HR.
How to calculate total annual salary? How is it useful? Administrative metrics for HR.
How to calculate median annual salary? How is it useful? Administrative metrics for HR.
How to calculate minimum annual salary? How is it useful? Administrative metrics for HR.
How to calculate maximum annual salary? How is it useful? Administrative metrics for HR.
How to calculate median employee age? How is it useful? Administrative metrics for HR.
How to calculate median employee tenure? How is it useful? Administrative metrics for HR.
How to calculate average employee tenure? How is it useful? Administrative metrics for HR.
How to calculate changes in headcount annually? How is it useful? Headcount metrics.
How to calculate changes in headcount monthly? How is it useful? Headcount metrics for HR.
What is Percent of headcount? How to calculate Percent of headcount? What are the benefits of % headcount reporting?
What is average headcount? How to calculate average headcount? What are the benefits of average headcount reporting?
What is headcount? How to calculate headcount? What are the benefits of headcount reporting?
Explore the 'Quality of Hire' metric in HR, understanding its importance in gauging employee performance and retention. A must-read blog for HR professionals focused on enhancing recruitment outcomes and workforce quality.
How to calculate the Offers% metric effectively for your hiring process? How is it useful? Recruitment metrics for HR.
Understand what 'Number of Recruitment stages' metric is and why it's crucial for the efficiency of a hiring process, and how to measure and optimize it effectively.
This metric can be used to identify the sourcing quality of the multiple application channels used in hiring process. From the below example we can see that the applications from “Agency” tend to have lower hired rates. Key decisions like whether to continue using Agency as a medium of sourcing candidates can be made using this metric.
What is Quality of Hire Metric? How and Why to calculate it?