
What (Definition)
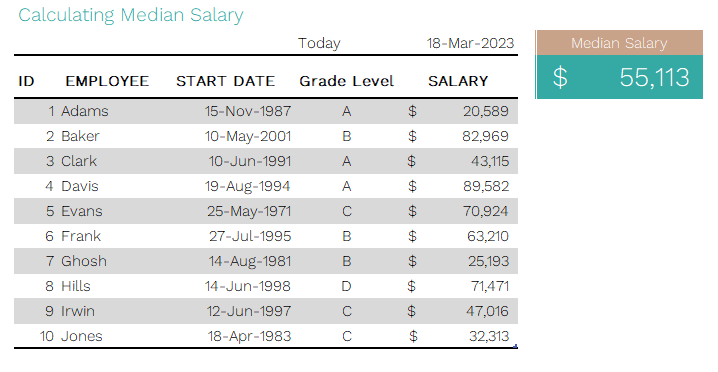
Median annual Salary is the median of actual salaries of current employees. This is based on the annual salary agreed with the employee and not the salary paid to employee so far.
Why (Benefits)
Median Salary is a good indicator of how the employees’ salaries are distributed. It is usually helpful to know median salary within a specific salary grade or pay grade. Jobs are usually assigned a specific salary grade and each grade has a minimum, midpoint and maximum salaries as guidelines. This actual median salary can be compared to the midpoint salary set for the specific grade to ensure that the policy guidelines are followed.
How (Calculation)
Formula: Median of Actual Annual Salaries of Employees
If we have a list of employees and their salaries, we can calculate the median.
To understand how median calculation works, it is better to show the employee salary sorted by salary amount.
If we had 11 employees sorted by their salary amount, then salary of 6th employee in that order will be the median, as it represents the middle.
In our dataset, we have 10 employees and there is no natural midpoint. So, we take the average of 5th and 6th salaries.
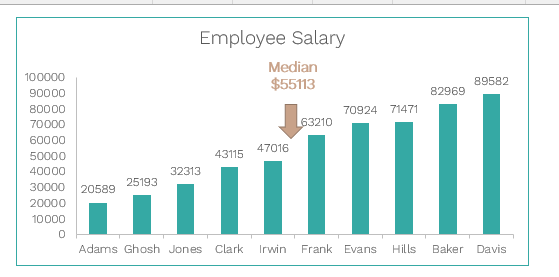
In this example dataset, the median salary is $55,113 which is the average of $47016 (5th salary) and $63210 (6th Salary)
As mentioned earlier, the metric is useful when segmented by job grade. If the job grades are A, B, C and D, we can calculate the median salary for each grade.
Let’s look at this chart below.

While using median or average metrics, it is recommended that we also see the frequency distribution.
This is where we create groups or buckets of salaries and calculate the frequency.
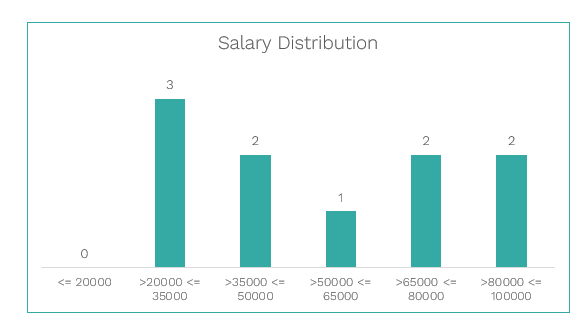
In this chart above, we can see the number of employees in each salary band/bucket. 3 employees have salaries between 20001 and 35000. This analysis allows us to see which salary buckets the concentration of employees is and will reveal outliers if any.