Calculating Diversity Percentage % in Excel
The value of diversity in employees has been recognized and appreciated more in recent times. Diversity in all aspects is good for a company.
In this article, I will explain how you can calculate a Diversity Percentage % KPI for your company.
I will use Racial Diversity in my example below. However, this concept can be used for measuring any type of diversity.
Data
There are two parts to the data we deal with, in this example.
First is the list of employees.
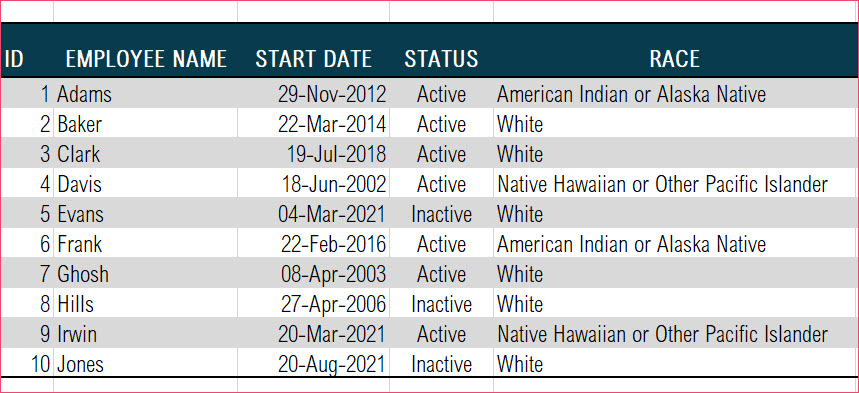
As always, please convert the data to an Excel table by pressing Control+T while selecting the data cells. Name the table. Eg. T_EMP
In the above data, we can see the RACE column representing the race of each employee.
The second data we will use here is a table that will tell us how the diversity groups are categorized.
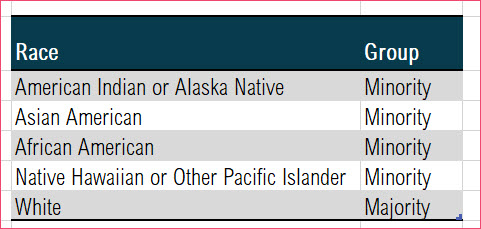
This table provides us the mapping from Race to Group. Group column tells which races are considered Minority and which are Majority.
Calculating Group for each employee
To begin, let’s calculate for each employee the GROUP they belong to.
We will add a new column ‘GROUP’ in our employee table T_EMP. We will enter the following formula in the column.
Formula
- For each employee, MATCH function finds the position (or row number) in the T_RACE table where the value in RACE column matches the RACE value of the employee.
- INDEX function extracts the value from the GROUP column at the specific row (defined by previous step) in T_RACE table.
This creates the values for GROUP for all employees, as shown below.

Calculating the Diversity Percentage
Now we will use the familiar formula (like how we did with the Gender Diversity % KPI) to calculate the Diversity Percentage.
Formula
As per the definition, we calculate the numerator (# of active employees who are in Minority group) and then divide by the denominator (total # of active employees)
- Numerator: We are using COUNTIFS function to count the number of employees from T_EMP table where Group equals “Minority” and Status equals “Active”.
- COUNTIFS function allows us to count based on more than one criterion or condition.
- Denominator: We use a COUNTIF function to count the number of employees whose Status equals “Active”.
- We divide Numerator by Denominator.
Formatting as Percentage
For the final step, we will update the Number format.
Click on the cell and press Control+1 to open Format cells dialog box.
Choose the Percentage format and update decimal places as needed.
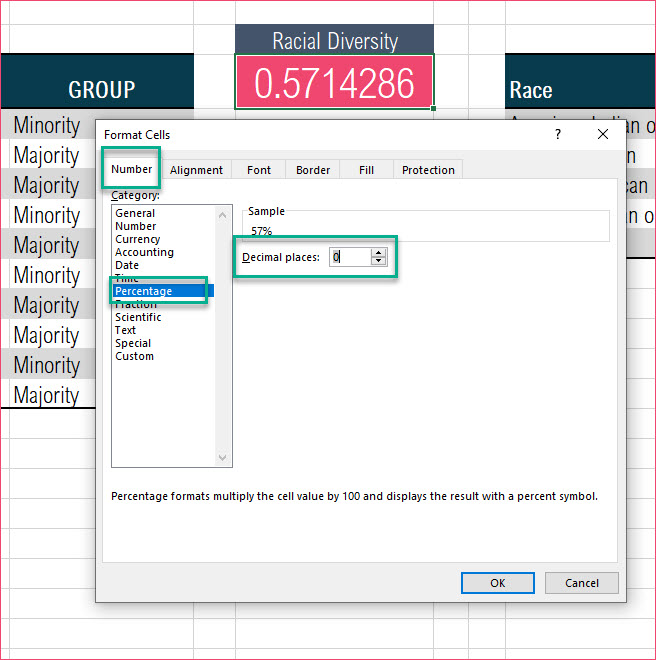
Now, the output would appear as below.

Functions used: MATCH, INDEX, COUNTIFS, COUNTIF
Conclusion
I hope this was useful. In your company, how do you calculate the diversity of employees in your company? I would love to hear from you in the comments section. If there is a specific metric or KPI you would like me to do a video about, please let me know.
HR Templates and Tutorials
Leave a Reply