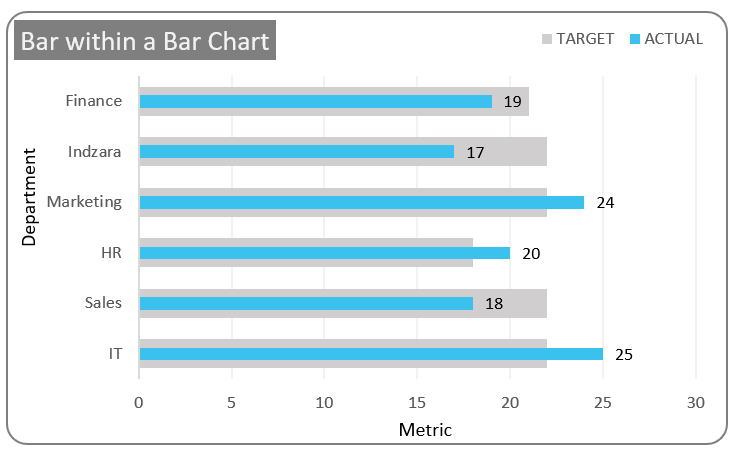
There are multiple ways to display actual versus multiple target values, one of the simplest yet efficient ways is by using a bar within a bar chart in Excel.
Before we get started, if you want to follow the tutorial in a video, please click here. Now, let’s get started.
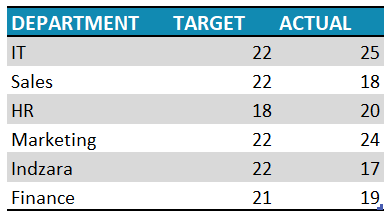
Consider the target versus actual for a particular metric across departments as shown:
Here is the overview of what we are going to see in this article.
- Step 01: Create the Chart
- Step 02: Format the Actual Series
- Step 03: Adjust the target series
- Step 04: Format the Chart
Ready to save time on your next presentation? Explore our Data Visualization Toolkit featuring multiple pre-designed charts, ready to use in Excel. Buy now, create charts instantly, and save time! Click here to visit the product page.
Now, let’s get back to creating a bar within a bar chart in Microsoft Excel.
Video Guide to create bar within a bar chart in Microsoft Excel
Step 01: Create the chart
Select all data and insert a 2D clustered bar chart.
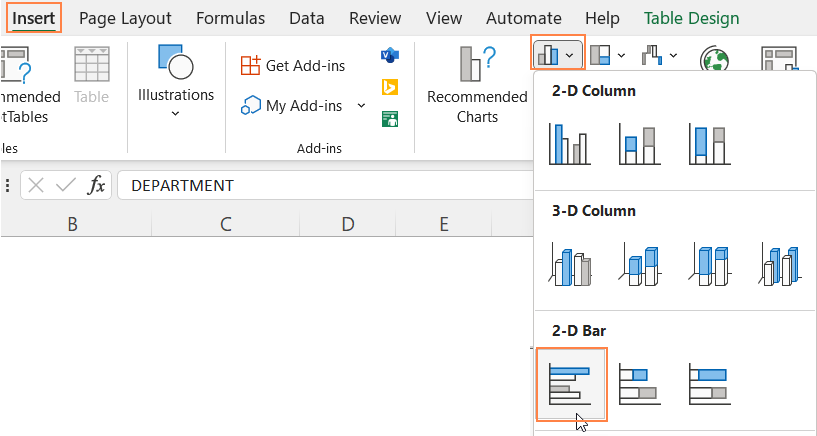
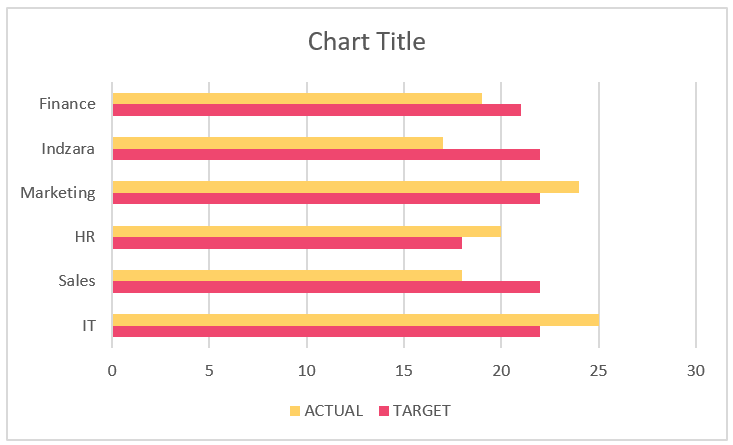
With this, a default bar chart gets inserted with two series: Target and Actual.
Step 02: Format the Actual series
To make this a bar within a bar chart, follow the steps here:
i. Click on the chart, and press CTRL+1 to open the format pane.
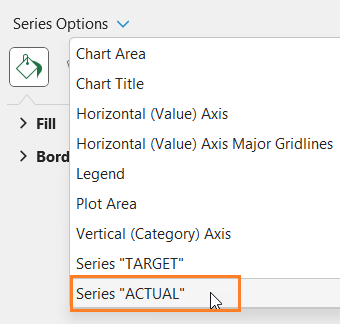
ii. From the format pane drop-down, choose the “Actual” series
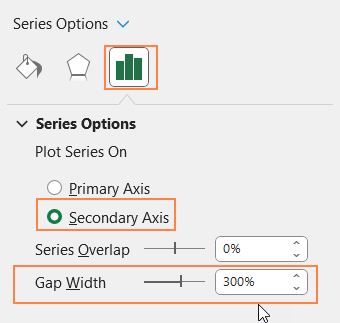
iii. Under the series options to increase the gap width to 300% and move the series to the secondary axis as shown:
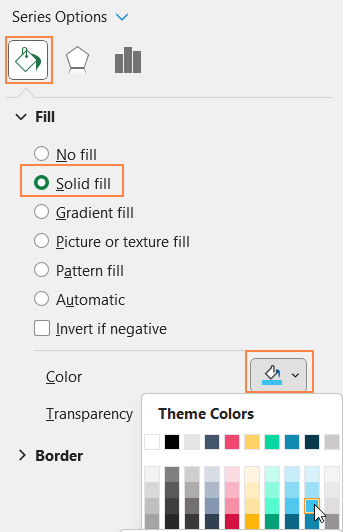
iv. Now, under the fill & line, change the fill color as needed
Step 03:Adjust the target series
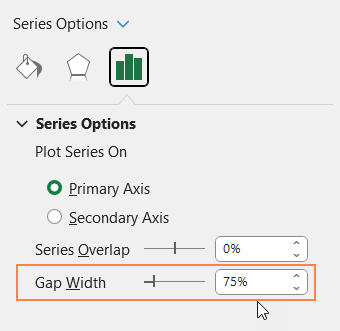
i. Similar to the previous step, from the format pane drop-down, choose the “Target” series
ii. Under the series option, here reduce the gap width to ensure that the target series becomes broader.
iii. Go to fill & line and modify the fill color as required.

Step 04: Format the chart
Now, it is time for some common formatting of the chart for a visually appealing chart.
Before that, click on the secondary horizontal axis (on top) and press the delete key to remove this.
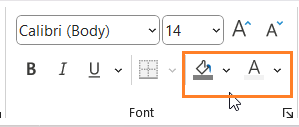
i. Add a suitable title to the chart, and format the same using the home ribbon formatting options.
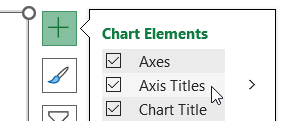
ii. Click on the chart, and use the “+” that appears on the top right to add axis titles. Format if need be using the home ribbon.
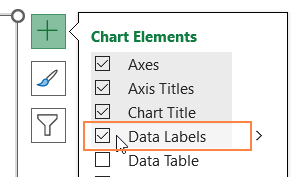
iii. Similarly, from the drop-down choose the “Actual” series and use “+” to add data labels.
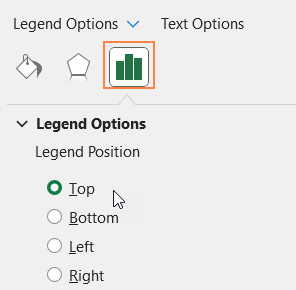
iv. Click on the legends and use the legend options in the format pane to position it at the top
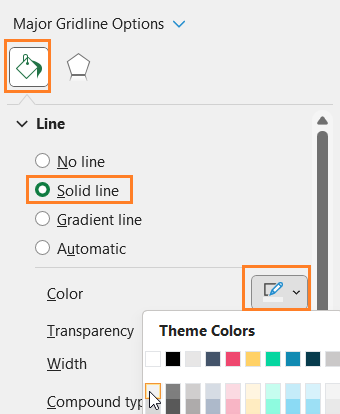
v. From the format pane drop-down, choose the “Horizontal (Value) Axis Major Gridlines”
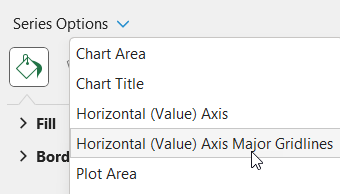
And format the lines to make it less apparent.
vi. Click on chart, format the chart border as shown below:
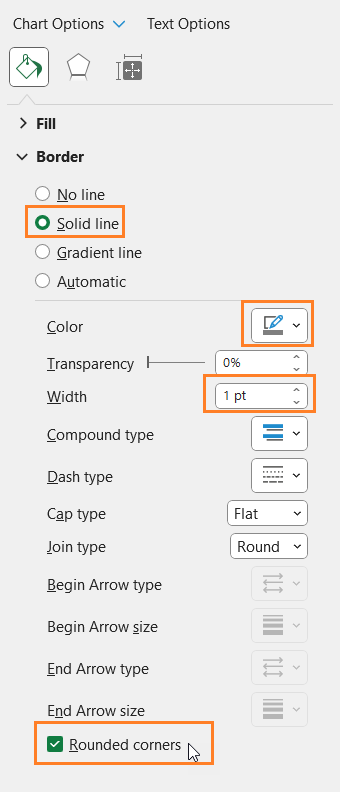
With these simple steps, your bar within a bar chart is ready!


