Report Card – Basic (Free Excel Template)
PURPOSE
The purpose of this template is to automate creation of student report cards and provide meaningful academic performance information to teachers and instructors, with minimal effort. I believe this would be useful for schools and other educational institutions, conducting tests or assessments for their students.
FREE DOWNLOAD
FEATURES OF REPORT CARD EXCEL TEMPLATE
- Handles up to 50 students
- Up to 12 different tests can be entered
- Up to 12 different subjects can be entered
- Customizable % required to pass
- Easy data entry of marks
- Customizable maximum marks for each test for each subject
- Marks presented as %
- Option to calculate final marks based on custom weights assigned to each test
- Class View
- Highlights Subject with the least average in each test
- Presents the number of students failed in each subject in each test
- Calculates the average final % for each subject
- Subject View (Choose one subject)
- Presents the data for all the students in each test
- Highlights the highest marks in each test
- Highlights students failing to meet the % required to pass
- Calculates the average final % for each student
- Student View (Choose one student)
- Presents all the data for one student
- Calculates the final overall %, final class rank and final result.
- Calculates the final % for each subject
- Calculates the result and class rank for each test
- Ready for printing
HOW TO USE THE TEMPLATE
- Step 1: Enter information in cells underlined in the Settings worksheet.
- Step 2: Enter information in Entry worksheet.
- Enter Maximum Marks for each test
- Enter Student info and marks.
- Step 3: Go to Class View to view and print Class Report Card
- Step 4: Go to Subject View to view and print Subject Report Card (Choose a Subject)
- Step 5: Go to Student View to view and print Student Report Card (Choose a Student)
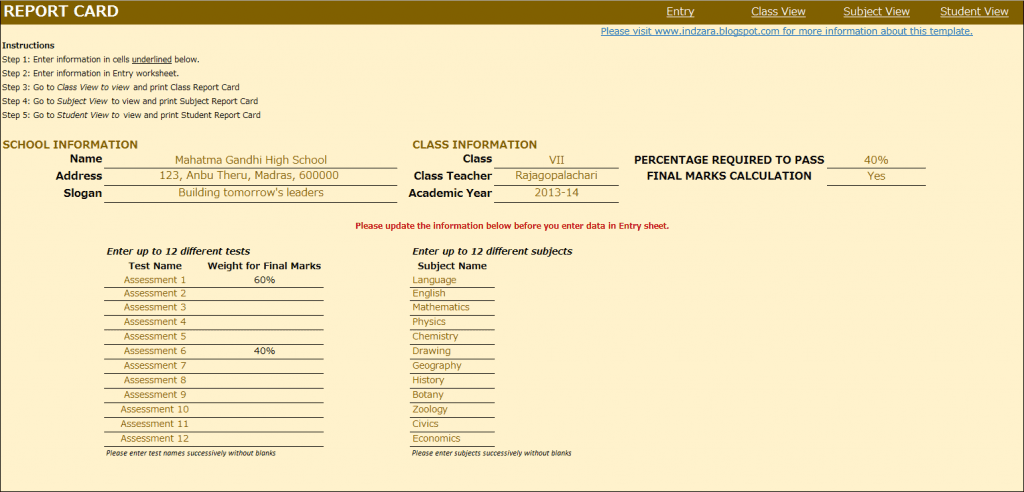
This is where you would enter your school and class information. Also, you would enter the ‘% Required to Pass’. In the screenshot above with the sample data, I have used 40% as % required to pass. This allows the template to automatically highlight any marks which are less than 40% with a red font so that it’s easy for the teacher to identify failures.
In many scenarios, students’ final marks are calculated based on assessments or tests throughout the academic year. In such scenarios, weights are assigned to each test and final marks are calculated based on those weights. This template accommodates that set-up. You can choose up to 12 tests and you can assign a weight to each test and the total of the weights should be 100%. The template is very flexible. For example, if your final marks are based only on the last test you conduct, you would assign 100% weight to the last test and 0% weight to all other tests.
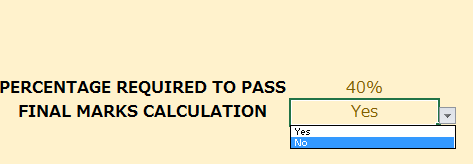
If you do not have the need to calculate final marks, please choose No in the drop-down menu as shown in the image below. This would make sure that the final marks will not be displayed anywhere in the template.
You can choose up to 12 subjects. Please make sure that the subject names are unique.
ENTRY
CLASS VIEW
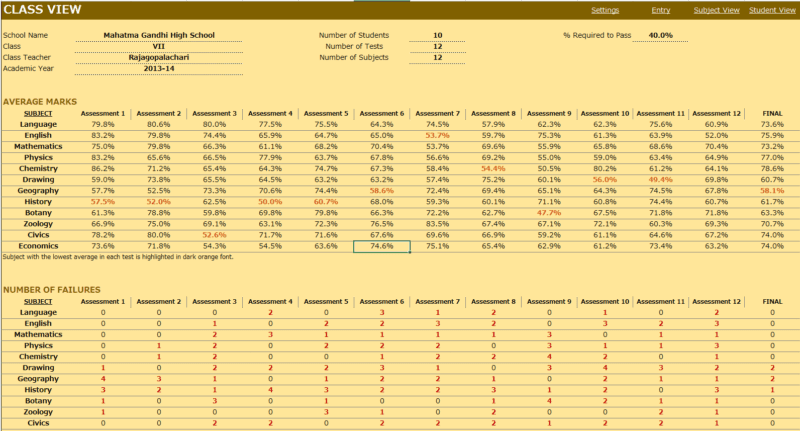
This is where you enter the student names, their roll numbers and the marks they scored in each subject in each test. This sheet automatically adjusts based on the number of tests and subjects you have entered in the Settings worksheet.
Enter Maximum Marks for each test. This is crucial for calculation. If you don’t enter this, you would see errors.
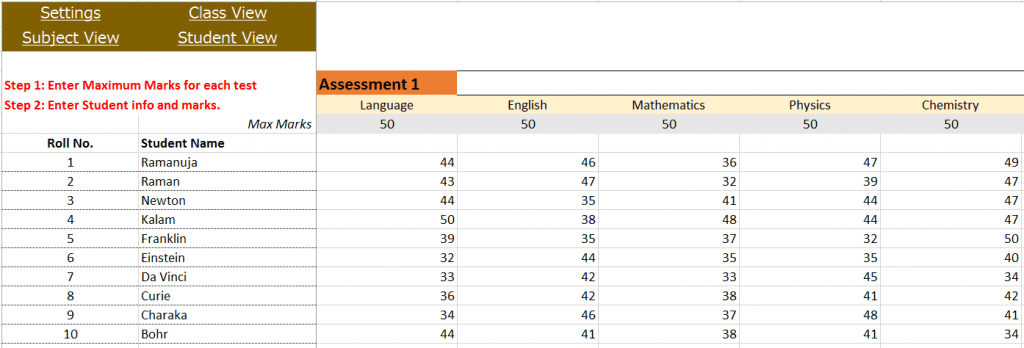
- This view presents the overall performance of the class and highlights areas of opportunities. Everything is automatically calculated and is ready to print.
- Subject with the least average in each test is highlighted with dark orange font. This allows easy identification of the (relatively) weakest subject for the class.
- Number of students failed in each subject in each test is also calculated and highlighted.
- If you have chosen to calculate final marks in the Settings worksheet, the average final % of the class for each subject is also calculated.
SUBJECT VIEW

Choose a subject from the drop down menu and this view presents each student’s performance in that subject during the course of the academic year. This allows the teacher to understand how the class is performing in that subject.
- Highest marks in each test is highlighted in dark green font.
- Marks that have failed to meet the % required to pass are highlighted with dark red font.
- If you have chosen to calculate final marks in the Settings worksheet, the final % of each student in that subject is also calculated.
STUDENT VIEW
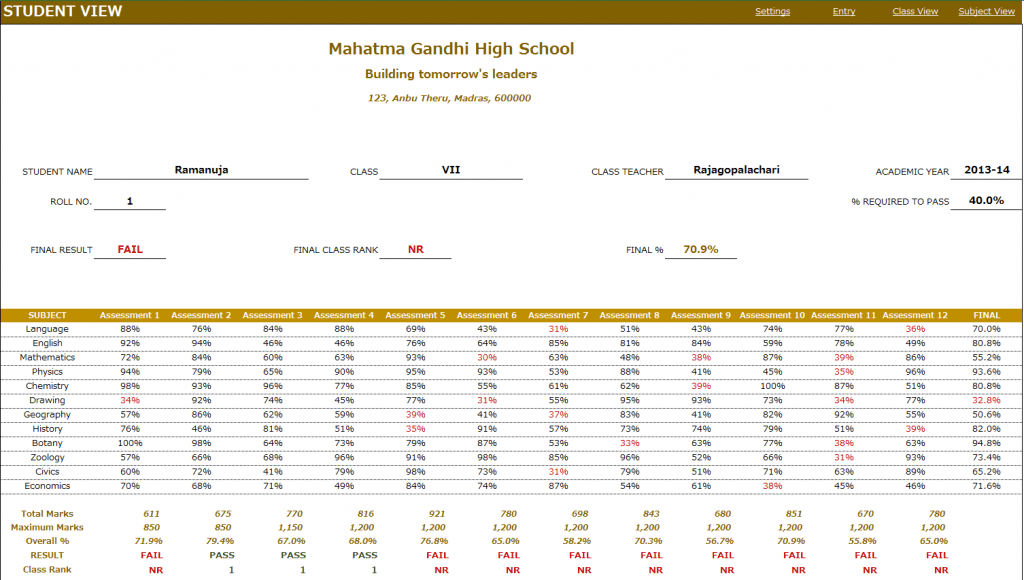
Choose a student from the drop down menu and this view presents the performance of that student in all subjects across all the tests.
- In addition to the %, this sheet calculates
- Result (Pass or Fail) whether the student has passed in each subject in a test.
- Class Rank of the student in each test
- If you have chosen to calculate final marks in the Settings worksheet, the final % of the student in each subject is calculated. The Final Result, Final Class Rank and Final Overall % are also calculated.
- Placeholders are provided for signatures from school principal and class teacher. This sheet can be printed and handed to the students.
Calculation Logic
- Total Marks is the sum of actual marks scored in all the subjects in a test.
- Maximum Marks is the sum of maximum possible marks in all the subjects in a test.
- Overall % is calculated as Total Marks/Maximum Marks in each test.
- Result is ‘PASS’ if the student has scored at least the “% Required to Pass” in each of the subjects in the test. Otherwise the Result is ‘FAIL’.
- Class Rank is calculated based on students whose result is ‘PASS’ in the test. For students with a ‘FAIL’ result, the class rank is NR (No Rank).
- If there are five students and 2 of them score the highest total marks in a test, then both of them will get a class rank of 1 and there will not be class rank of 2. The next highest student will get a class rank of 3.
- Final % for each subject is calculated based on weights given to each test in the settings worksheet.
- Final Overall % is calculated as average of the Final % in all subjects.
- Final Result is PASS if the student’s Final % for each subject is at least the ‘% required to pass’.
- Final Class Rank is calculated based on students whose final Result is PASS. For students whose final Result is FAIL, the final class rank is NR.
This excel result sheet download is simple and effective in managing the student report of a class of 50 students. I hope you find the result card format in excel template useful. Please share your feedback on whether the marksheet format in excel template captures the requirements of your scenario. I can make the necessary changes so that the template can be used by as many people as possible.

293 Comments
Thank you very much. I tried the template & found ever best. I need to handle the data of at least 300 students. Please help me to increase the number of students in the sheet.
Its urgent. Please reply. I will remain thankful.
Please reply to rabarbhuyan@gmail.com
Thank you very much. I tried the template & found ever best. I need to handle the data of at least 300 students. Please help me to increase the number of students in the sheet.
Its urgent. Please reply. I will remain thankful.
Hii
I have a request can you please share some Health & Safety report formats.. like Monthly HSE Statistic Report in dashboard fully automated.
by the way I have prepared one but I am not satisfied with that so if you could help me out, I’ll be very thankful to you..
Your sharing are truly amazing..
Thanks
Regards,
Tarique Khan
Thanks for your interest. I am sorry that I don’t have such a template.
Best wishes.
PLEASE SIR.HOW CAN I GET INTO THE SITE.AS IN INTO THIS TEMPLATE THAT ENABLES ME MAKE MY OWN CHANGES? EMAIL ME PLEASE.benkroos72@gmail.com
You can download the template file and use Excel in your desktop to make changes. Best wishes.
AND more to add how to add school logo
You can right click on the logo and select Change Picture. Then, choose an image file from your computer to replace.
Best wishes.
Sir i must thank you very much am happy about the template. please how do i add student’s pictures to the final report card. thanks
You are welcome. You can insert pictures manually from the Insert ribbon. For the picture to automatically change in Student report card, it would require many steps. I am sorry that I don’t have that documented. Best wishes.
Use formula =IF(K17>=90%,”A1″,IF(K17>=80%,”A2″,IF(K17>=70%,”B1″,IF(K17>=60%,”B2″,IF(K17>=50%,”C”,IF(K17>=40%,”NEED IMPROVEMENT”)))))) to set grades based on the percentage of marks obtained.
Thanks.
Dear Indzara, This is really amazing. I have customized the sheet for my requirement and it looks awesome. It has saved lot of my time in keeping track of my students performance and now my PTA goes very smooth and accurate. I tried a lot to make the sheet take more than 50 students.. but did not succeed. I can understand you are busy. But my request is that help us getting this done when you are free. One more suggestion, if there was a drop down option to choose class as well then it would have been unbeatable.
Regards
Educoach
Thanks for the feedback. I will do my best to create an advanced version of this in the future. Best wishes.
Dear Sir,
we want to same format with grade wise marks inplace of % based
can you provide us grade based same format
Kindly confirm or send my e-mail address
sharmakr@rsinfratransmission.com
I have emailed you an example showing marks and implementing grades. I haven’t tested the entire file yet, but it should give you ideas to use.
Thanks & Best wishes.
Hi,
Can you help me, I want a report card generation excel program which give grade output. I am trying with V lookup but failed to do so. I know you are busy so can you guide me on this how can I change the marks into grade and then to CGPA.
I have emailed you an example of implementing grades. I haven’t tested the entire file yet, but it should give you ideas to use.
Thanks & Best wishes.