Report Card – Basic (Free Excel Template)
PURPOSE
The purpose of this template is to automate creation of student report cards and provide meaningful academic performance information to teachers and instructors, with minimal effort. I believe this would be useful for schools and other educational institutions, conducting tests or assessments for their students.
FREE DOWNLOAD
FEATURES OF REPORT CARD EXCEL TEMPLATE
- Handles up to 50 students
- Up to 12 different tests can be entered
- Up to 12 different subjects can be entered
- Customizable % required to pass
- Easy data entry of marks
- Customizable maximum marks for each test for each subject
- Marks presented as %
- Option to calculate final marks based on custom weights assigned to each test
- Class View
- Highlights Subject with the least average in each test
- Presents the number of students failed in each subject in each test
- Calculates the average final % for each subject
- Subject View (Choose one subject)
- Presents the data for all the students in each test
- Highlights the highest marks in each test
- Highlights students failing to meet the % required to pass
- Calculates the average final % for each student
- Student View (Choose one student)
- Presents all the data for one student
- Calculates the final overall %, final class rank and final result.
- Calculates the final % for each subject
- Calculates the result and class rank for each test
- Ready for printing
HOW TO USE THE TEMPLATE
- Step 1: Enter information in cells underlined in the Settings worksheet.
- Step 2: Enter information in Entry worksheet.
- Enter Maximum Marks for each test
- Enter Student info and marks.
- Step 3: Go to Class View to view and print Class Report Card
- Step 4: Go to Subject View to view and print Subject Report Card (Choose a Subject)
- Step 5: Go to Student View to view and print Student Report Card (Choose a Student)
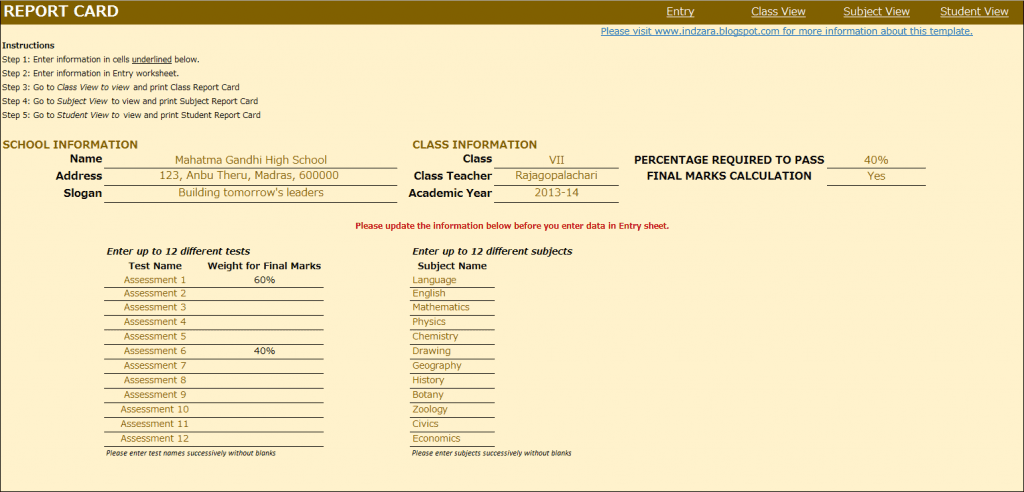
This is where you would enter your school and class information. Also, you would enter the ‘% Required to Pass’. In the screenshot above with the sample data, I have used 40% as % required to pass. This allows the template to automatically highlight any marks which are less than 40% with a red font so that it’s easy for the teacher to identify failures.
In many scenarios, students’ final marks are calculated based on assessments or tests throughout the academic year. In such scenarios, weights are assigned to each test and final marks are calculated based on those weights. This template accommodates that set-up. You can choose up to 12 tests and you can assign a weight to each test and the total of the weights should be 100%. The template is very flexible. For example, if your final marks are based only on the last test you conduct, you would assign 100% weight to the last test and 0% weight to all other tests.
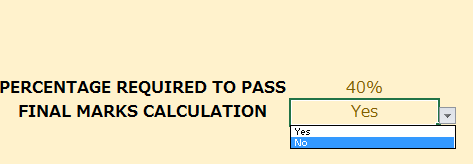
If you do not have the need to calculate final marks, please choose No in the drop-down menu as shown in the image below. This would make sure that the final marks will not be displayed anywhere in the template.
You can choose up to 12 subjects. Please make sure that the subject names are unique.
ENTRY
CLASS VIEW
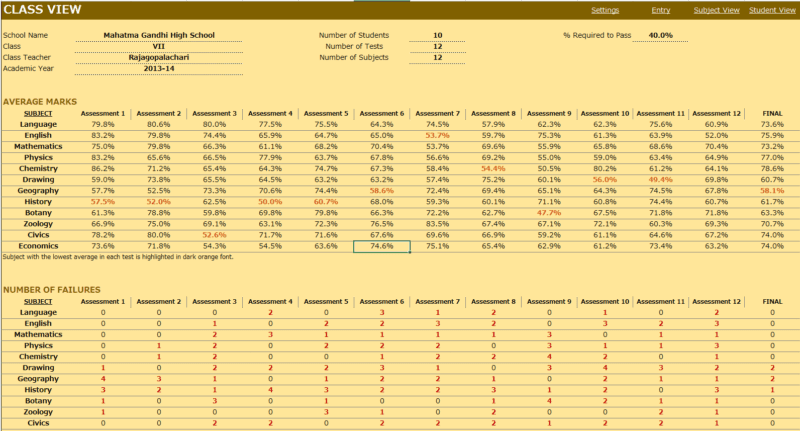
This is where you enter the student names, their roll numbers and the marks they scored in each subject in each test. This sheet automatically adjusts based on the number of tests and subjects you have entered in the Settings worksheet.
Enter Maximum Marks for each test. This is crucial for calculation. If you don’t enter this, you would see errors.
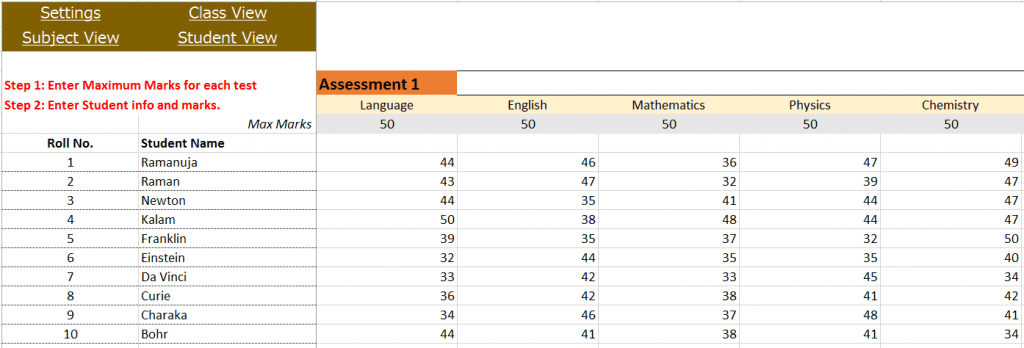
- This view presents the overall performance of the class and highlights areas of opportunities. Everything is automatically calculated and is ready to print.
- Subject with the least average in each test is highlighted with dark orange font. This allows easy identification of the (relatively) weakest subject for the class.
- Number of students failed in each subject in each test is also calculated and highlighted.
- If you have chosen to calculate final marks in the Settings worksheet, the average final % of the class for each subject is also calculated.
SUBJECT VIEW

Choose a subject from the drop down menu and this view presents each student’s performance in that subject during the course of the academic year. This allows the teacher to understand how the class is performing in that subject.
- Highest marks in each test is highlighted in dark green font.
- Marks that have failed to meet the % required to pass are highlighted with dark red font.
- If you have chosen to calculate final marks in the Settings worksheet, the final % of each student in that subject is also calculated.
STUDENT VIEW
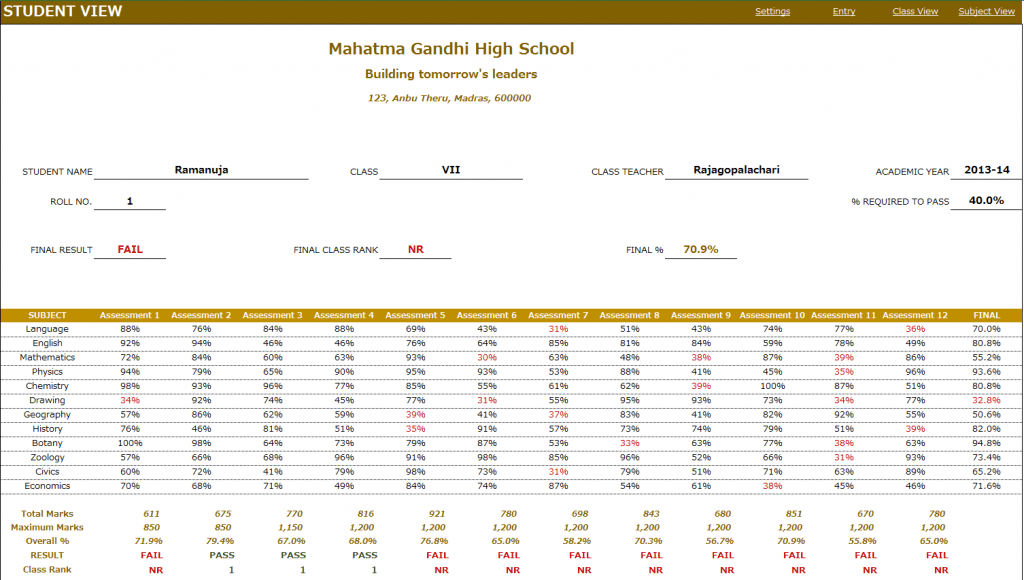
Choose a student from the drop down menu and this view presents the performance of that student in all subjects across all the tests.
- In addition to the %, this sheet calculates
- Result (Pass or Fail) whether the student has passed in each subject in a test.
- Class Rank of the student in each test
- If you have chosen to calculate final marks in the Settings worksheet, the final % of the student in each subject is calculated. The Final Result, Final Class Rank and Final Overall % are also calculated.
- Placeholders are provided for signatures from school principal and class teacher. This sheet can be printed and handed to the students.
Calculation Logic
- Total Marks is the sum of actual marks scored in all the subjects in a test.
- Maximum Marks is the sum of maximum possible marks in all the subjects in a test.
- Overall % is calculated as Total Marks/Maximum Marks in each test.
- Result is ‘PASS’ if the student has scored at least the “% Required to Pass” in each of the subjects in the test. Otherwise the Result is ‘FAIL’.
- Class Rank is calculated based on students whose result is ‘PASS’ in the test. For students with a ‘FAIL’ result, the class rank is NR (No Rank).
- If there are five students and 2 of them score the highest total marks in a test, then both of them will get a class rank of 1 and there will not be class rank of 2. The next highest student will get a class rank of 3.
- Final % for each subject is calculated based on weights given to each test in the settings worksheet.
- Final Overall % is calculated as average of the Final % in all subjects.
- Final Result is PASS if the student’s Final % for each subject is at least the ‘% required to pass’.
- Final Class Rank is calculated based on students whose final Result is PASS. For students whose final Result is FAIL, the final class rank is NR.
This excel result sheet download is simple and effective in managing the student report of a class of 50 students. I hope you find the result card format in excel template useful. Please share your feedback on whether the marksheet format in excel template captures the requirements of your scenario. I can make the necessary changes so that the template can be used by as many people as possible.

293 Comments
Can I edit a column and another grading system? It’s great, anyway. Thank you
Please feel free to edit using password indzara. Thanks. Best wishes.
Hello Sir,
I do not need % format. I require all marks as number without percentage.
Please help me
Mail gsuresh2007@gmail.com
will be happy if you respond please
I have emailed you a file. Please note that I have not tested fully and hence have not published it online yet.
Best wishes.
I have imported grades from exel. I am able to see grades in Class View, but I am getting #N/A in Student View.
Is there a fix? Thank you!
I am not sure what ‘imported grades’ refers to. Please explain. If there are further questions, please email file to support@indzara.com. Thanks. Best wishes.
Hi
This is Sarika Again. Actually we have started working on the result for PT-1. I know you might not like to share the password.Thats absolutely fine with me. But please can you provide me a file having 60 records instead of 50. it will be a great help and solve all my problems.
My email id is sarika.minocha@gmail.com
Please use indzara as password. Thanks.
Best wishes.
Hi
The file is really very good. Can you provide me the password to unprotect and pls guide if I want the records till 60.
My email id is sarika.minocha@gmail.com
Please use indzara as password. Thanks.
Best wishes.
Thank sir, your work helps a lot but
I still have challenges after entry the various marks in the entry.
The marks do not reflect in the class, subject and student views.
Please I need a help!
You are welcome.
Please email file with data to support@indzara.com and specify exactly which marks are not reflecting where. The more specific the information is, easier it will be for me to reply quickly. Thanks for your support.
Best wishes.
Thanks Indzara for the assistance, I just downloaded the template I will study and get back to you. But how can we get this template to handle more students so 300 students
You are welcome. We should make many modifications to the formulas to increase support for number of students. Sorry, I don’t have that built. Best wishes.
The administration at my school likes the template, however they which for the raw scores to be shown for each maximum weight and not the percentage. Could i get some assistance here. Thanks.
Thank you. I have only the % option and don’t have the raw scores. Sorry.
Best wishes.
Nice .I had gone through all the comments till now .and came to know that this INDZARA is a nice person ,because for each queries he had give reply.by which he had helped so many peoples .thanks for helping people.
Thanks for your feedback. Glad to help.
Best wishes.
Hi IndZara, do you do database development as well? like java, php, mysql….. if yes, please notify me, I want to propose a deal.
brandeazygh@gmail.com