Looking for a simple template to view price history of stocks of your choice? This is the template for you!

Read along to know the features of this simple yet quite useful template and how to use it.
Download
Template features
A very important visual in the area of stock markets is the price chart of a stock.
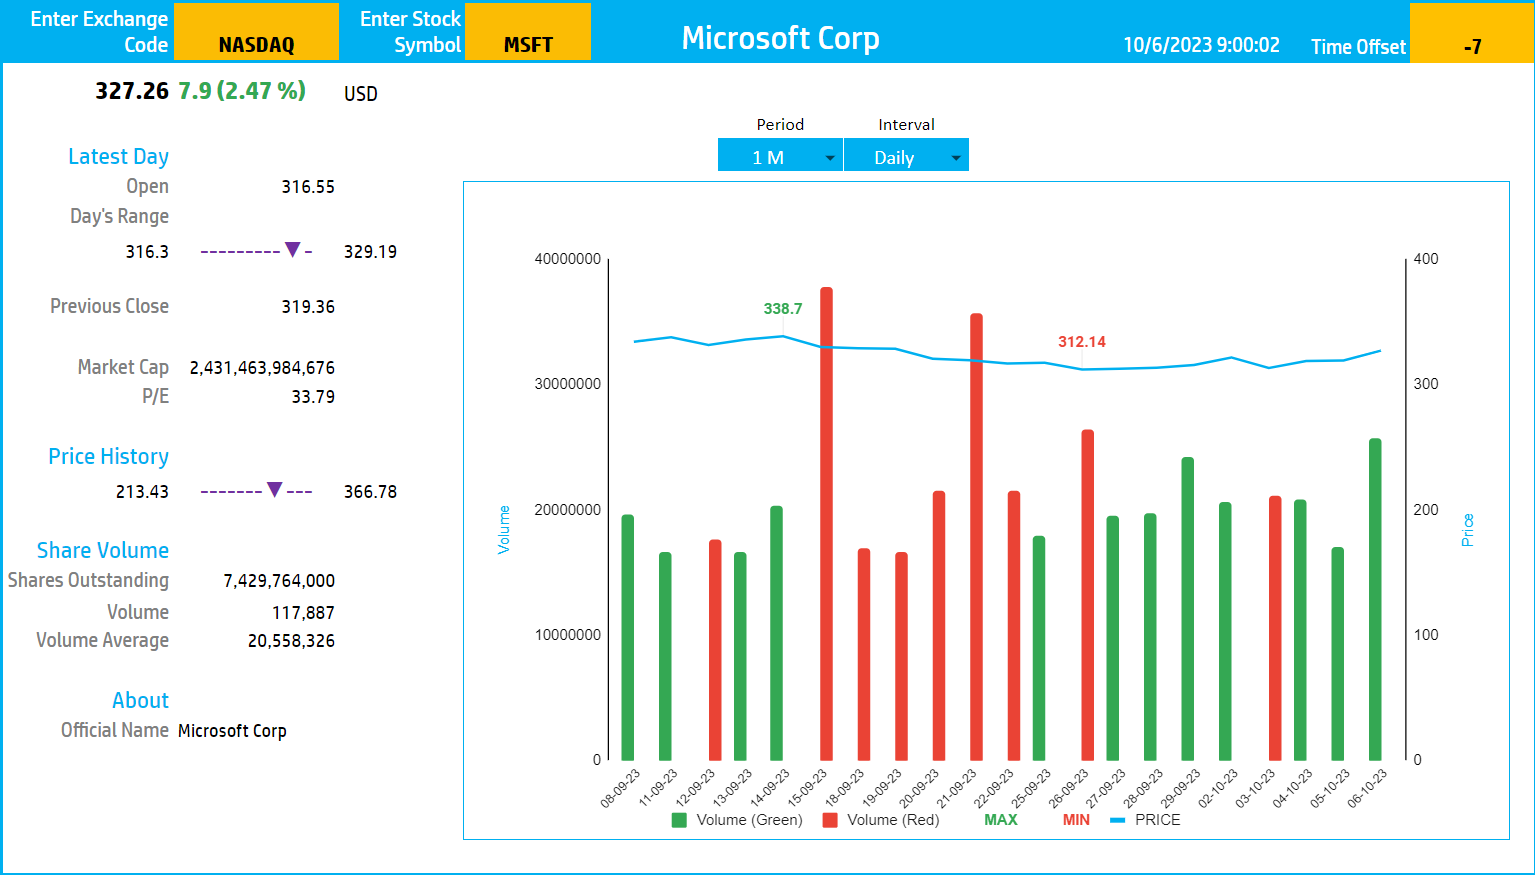
The template allows
- Entering a stock ticker symbol to pull in up to an year of price history
- Allows controlling the period displayed on the chart (5 days, Month To date, 3 Months, etc.)
- Allows controlling the interval of price data – Daily or Weekly
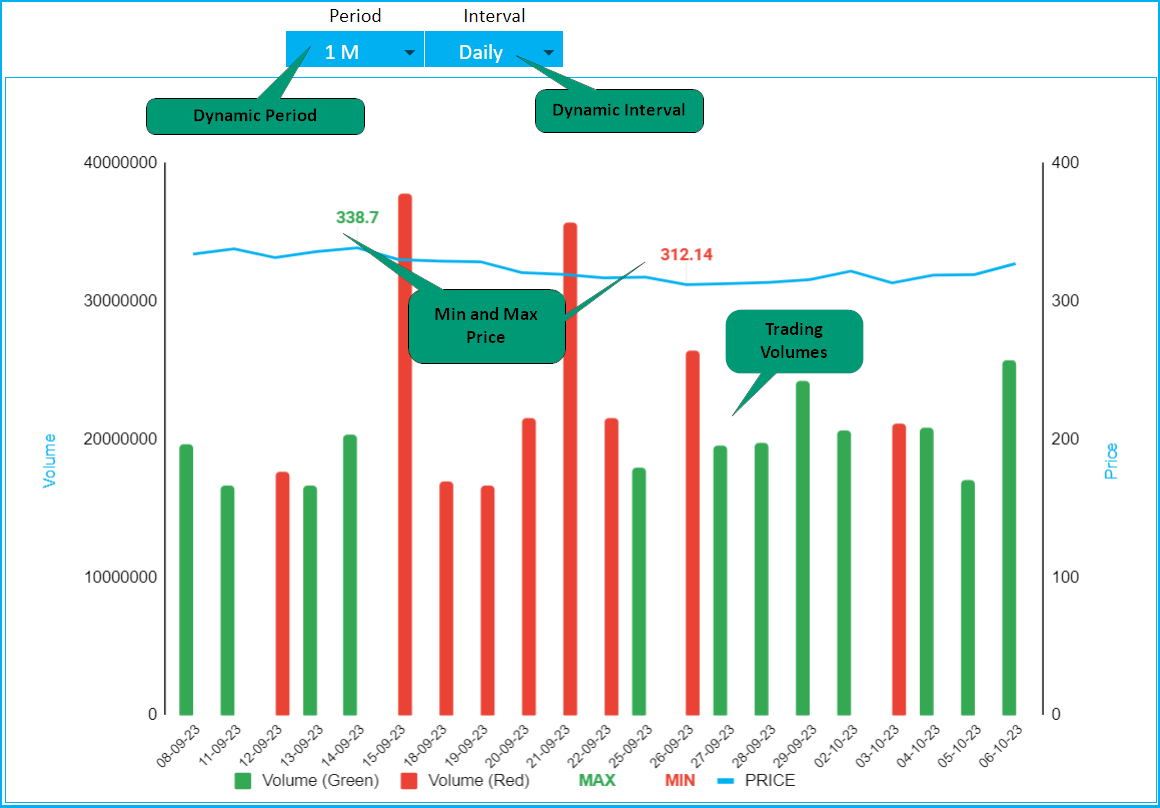
- Automatically identifying the max and min price points on the chart based on your period range and interval choices
- Shows the volume of trading daily with green color bars for periods when closing price was greater than previous period’s closing price and red bars when closing price was less than previous period’s closing price.
You can change the Exchange Code and Ticker symbol and immediately view the price chart for a stock.
To select the stock you are interested in, you need to enter the correct Exchange Name and the correct Ticker symbol in the sheet as shown below.

Period
The template can pull up to an year of price history by default. You can choose how much history to display on the chart easily using the drop-down.
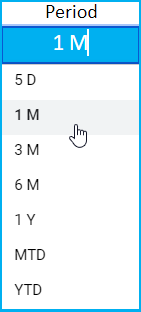
The options are 5 Days, Month Till Date, 1 Month, 3 Months, 6 Months, Year Till Date and 1 Year.
Interval
The template allows price history at 2 different intervals.
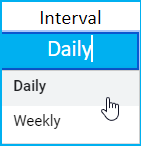
Daily/Weekly are the options.
Premium Stock Templates in Google Sheets

Premium Stock Templates in Microsoft Excel
-
 Stock Screener Excel Template$97
 -
Simple Moving Average Stock Screener Excel Template$25
-
Product on saleTechnical Analysis Pro Excel Template (25 Technical Indicators)Original price was: $97.$67Current price is: $67.


Feedback
Please share your feedback and suggestions on the comments below.