Unpivoting columns in Excel is a technique used to transform data from a wide format, where information is spread across many columns, into a long format, where data is condensed into fewer columns with more rows.
This is particularly useful when dealing with data like schedules or timetables, where you might start with a grid format and want to list the data in a more database-friendly structure for further analysis and report building.
For example, let us consider our sample data from ESPN.COM (https://www.espn.com/nfl/schedulegrid) which contains the schedule of games as a grid:

To be able to perform any analysis using this data in Excel, this data needs to be cleaned up and necessary transformation techniques applied.
As we noted in our introduction, this data has all the week’s schedules as individual columns. To convert the same into a more readable format, we have to unpivot the columns other than the TEAM column.
This technique can apply to other scenarios like employee shift schedules, school timetables, etc.,
Let us look at how to “Unpivot Other Columns” in our sample data:
Step 01:
The first step will be to load our data into Power Query.
Copy the NFL Grid Schedule page in ESPN.com i.e. https://www.espn.com/nfl/schedulegrid

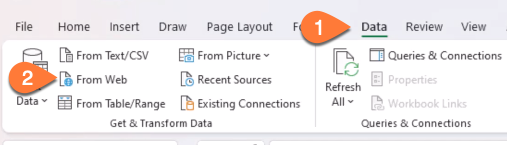
Step 02:
Open a blank Excel notebook, then go to Data (1) then choose From Web (2)
Step 03:
Enter the URL copied for Excel to fetch the data from the given URL.

What we are looking for is to get the result in a tabular format.
Step 04:
The data is successfully extracted from the URL. As the next step click on (1) Table 0 which will display the result in a table view.
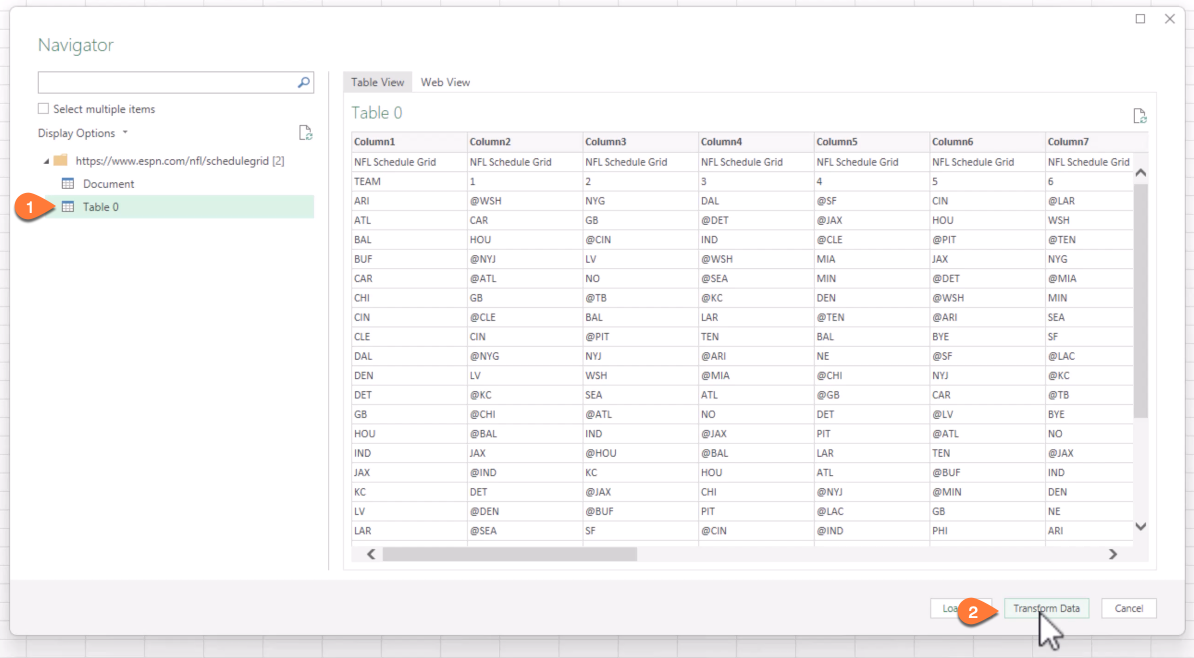
We’ll click on Transform Data to perform the transformations.
Step 05:
We can see that the data needs to be cleaned:
Remove unwanted Rows from the dataset: In this example, the first row of data can be removed. For this, go to Remove Rows (1) and select Remove Top Rows (2)
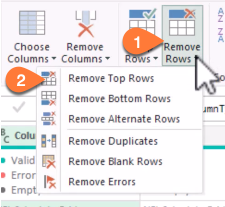
Now choose the number of rows from the top which has to be removed.
Use the first row as the header or the field names in Power Query Editor:

Note: This is a sample scenario used with data from the web, you can apply the following step of unpivoting your data with data obtained from any other source like an Excel table, etc.
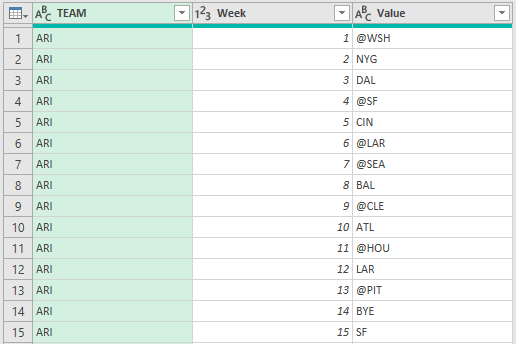
Step 06:
Now, we’ll click on the TEAM column and “Unpivot Other Columns” as shown:

What does unpivoting other columns do?
In the original grid, each row represents a team and each column represents a week of the season. The unpivoting process takes each matchup and creates a separate row for it, resulting in a more detailed and structured list where each game is a record.
Once a desired format is obtained, you can “Close & Load” your data into Excel for further transformations and analysis.
This structured format is more suitable for analysis, reporting, and database storage, as it allows for easier filtering, sorting, and querying of the data.
In summary, unpivoting columns in Excel is a data transformation technique used to reorganize data from a wide format to a long format.
Do check our dedicated YouTube video on converting the NFL schedule grid data into a list of games here:
If you have any feedback or suggestions, please post them in the comments below.


