Sales Pipeline Manager Excel Template – User Guide
This article describes step by step how to use the Sales Pipeline Manager Excel Template. For more information on the features of the template, please visit the product page.
Overview of Steps
- Enter sales stages in your Sales process. Rename if necessary.
- Entering a new deal in Deals table
- Change Currency for Deal Value (amount) field if needed.
- Enter basic deals data (Company Name, Contact Name, Deal Value, Created Date)
- Hide the columns for extra stages.
- Enter deal attributes and contact attributes
- Enter Win % as the chance of winning the deal.
- Updating a deal as you make progress
- Update Stage dates if the deal has moved forward to the next stage.
- Update Win % and expected Close Date if it has changed over time.
- Closing a deal
- Enter Status (Won or Lost) if the deal is closed.
- Enter Close Date
- If deal is lost, enter Lost reason
- Monitoring performance regularly to gain insights
- View Dashboard to see performance and insights of closed deals. Take actions.
- View active deals to know the active pipeline and projected sales
- Track Sales Activities
VIDEO DEMO
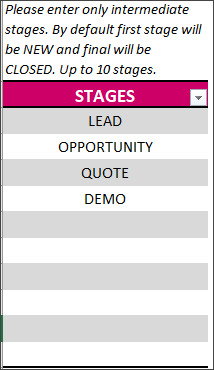
Step 1: Review Stages in Sales Process
By default, the template comes with 4 intermediate stages (Lead, Opportunity, Demo, Quote). The first stage is always creation of a new deal, final stage is Closing a deal. If there are 4 intermediate stages, it means that there are totally 6 stages in your sales process.
You can rename the default 4 and add more or reduce depending on your sales process.
Step 2. Entering a new Sales deal (or lead)
We can enter new deals by typing in the Deals table.
Currency Format
First, let’s set the currency format for deal value amount field.
Click on cell B6. Press Ctrl+1 to open the Format dialog box.
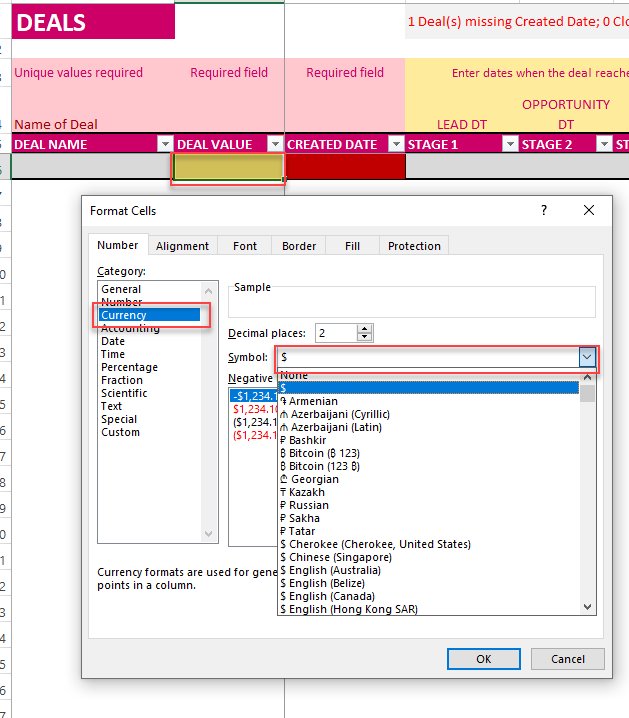
Change the format as shown above to any currency of your choice. Click OK to save it.
Enter Required Fields
For more on data entry in Excel tables, please visit Excel Tables for Data Entry
Each row is a separate deal. There are some key types of information we enter in the table. Let’s look at them on by one.
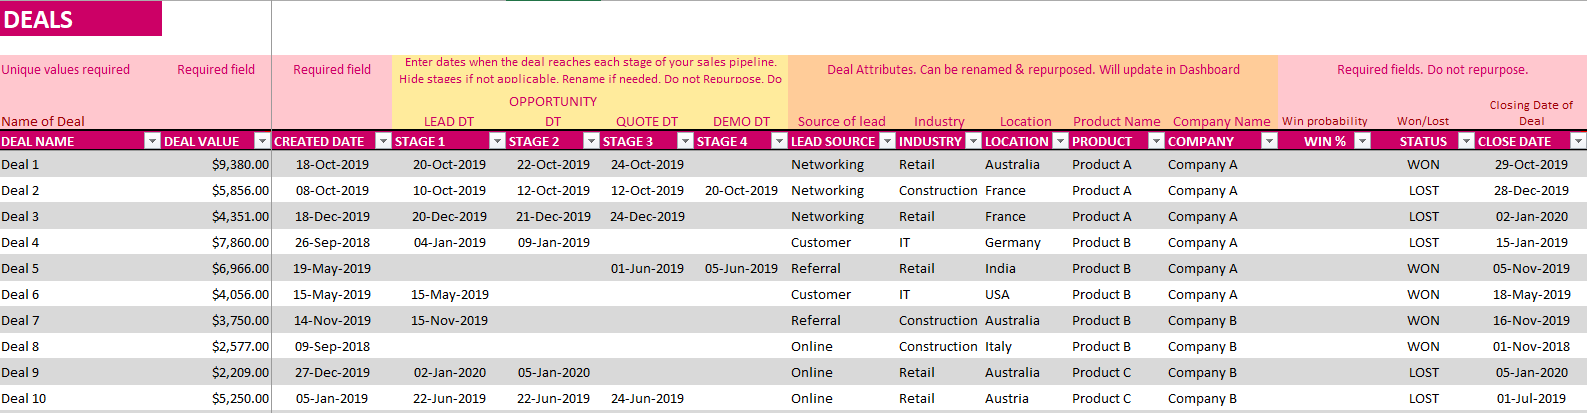
- Deal Name: Give each deal a unique name. This is a required field. If no deal name is entered, the deal does not get counted in the Dashboard. Having a unique name allows easily identify a specific deal.
- Deal Value is the total value of the deal. Deal Value can be estimated if it has not been determined yet. But please enter a value so that the pipeline can be evaluated.
- Created Date is the date when the deal originally was entered. This allows us to track the sales process and timeline from this date.
Stage Dates
As the template can handle 10 intermediate stages, there are 10 stage date columns.
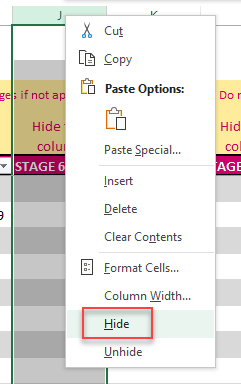
If your sales pipeline process has only 4 intermediate stages, then you can hide the columns Stage 5 to Stage 10. Do not delete. Just hide the columns.
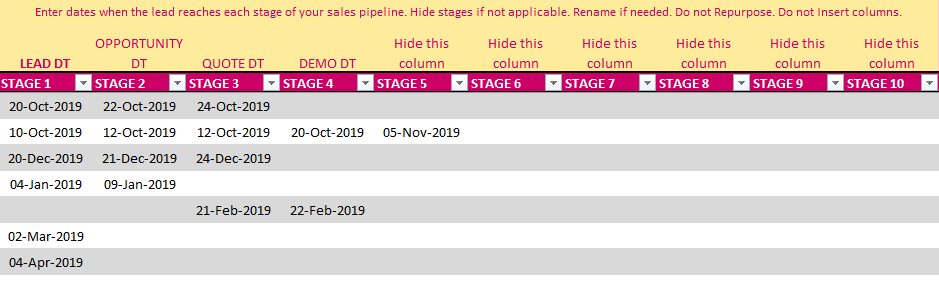
You can select the column. Right click and then choose HIDE.
When a deal passes each stage, enter the date when it reached that stage. In the screenshot above, first deal became as lead on 20th Oct, became an Opportunity on 22nd Oct and Quote was issued on 24th Oct.
If a deal has not reached a specific stage yet, leave the cell blank.
Enter Win %, Status and Close Date
Then, we enter a Win % for each deal. For deals that are not closed yet, we would enter our estimate of the chances of winning a deal. If we have a 50-50 chance of winning or losing a deal, we would enter 50. The template will automatically convert to 50%.
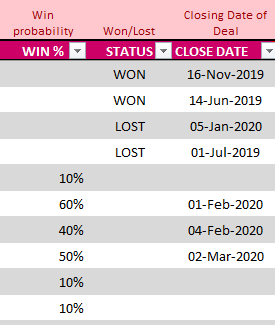
When a deal has closed, choose the status as WON or LOST and enter a Close date.
If the deal is still open, leave the status blank.
Enter a win % for all open deals to calculate the sales pipeline value.
Close Date
When a deal is closed, always enter close date. When a deal is open, you can enter a close date in future, if you are expecting the deal to close on that date. This information will be used to project future closing deals in dashboards.
Deal Attributes
There are 5 deal attributes provided.
Lead Source, Industry, Location, Product and Company are provided as default attributes.
They can be renamed and Repurposed.
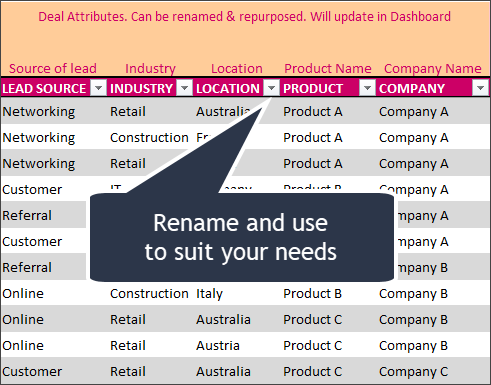
These attributes are useful in the analysis of your sales pipeline to understand what types of deals are being successful versus not.
Notes
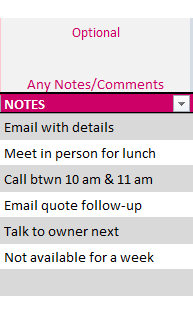
You can type in any notes or comments in this column.
Lost Reason
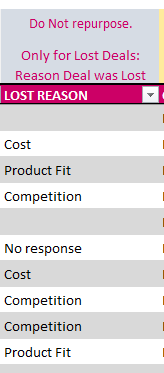
This column can be used to store the reason why the deal was lost. Enter only for deals lost.
Contact Attributes
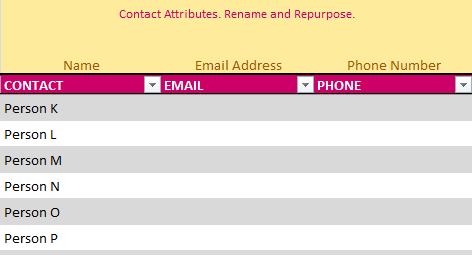
3 columns are provided as placeholders to store Contact name, Email address, Phone number. You can rename and repurpose the fields according to your needs. You can also add more columns to the right.
Validations
There are validations in place in the template for data entry. There will be an error message at the top of Deals sheet indicating the errors. Also, the cell with error will be filled with red color for your convenience.
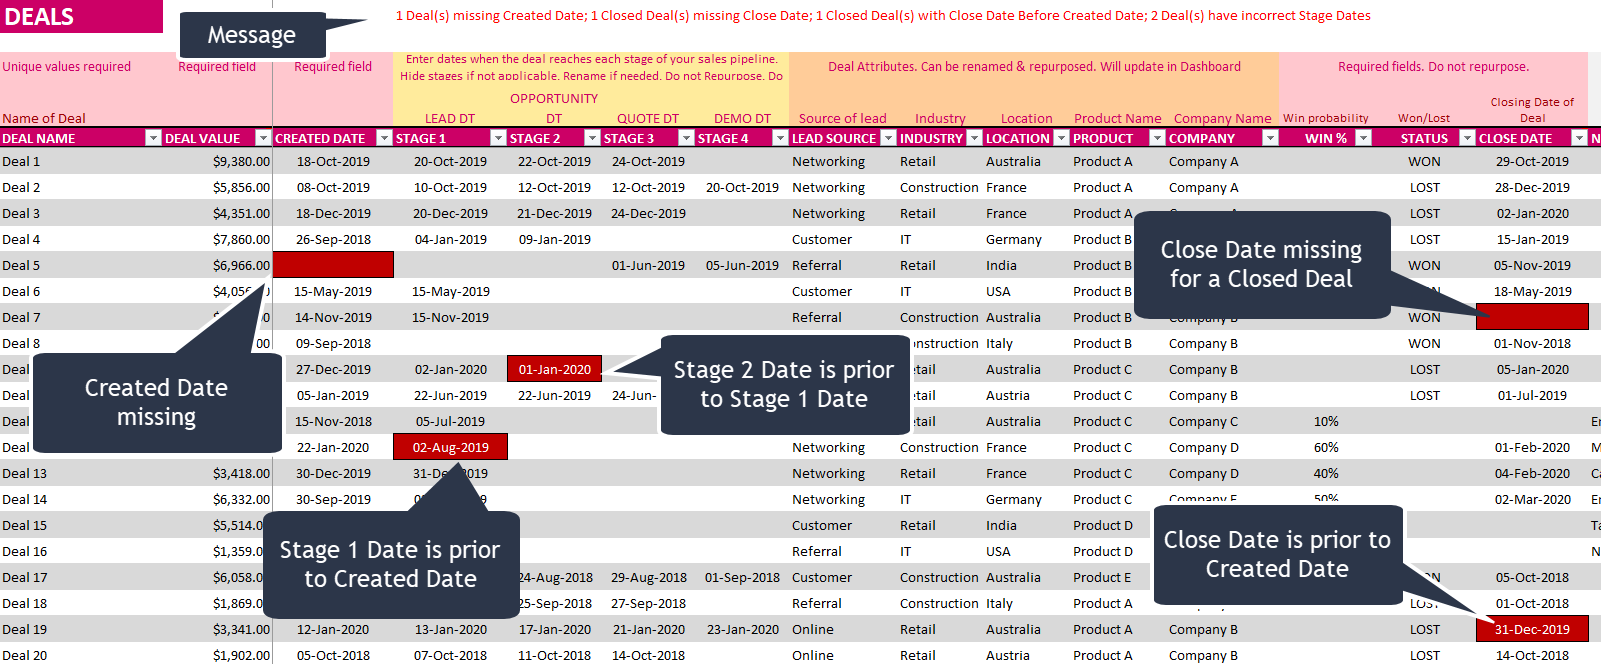
The following are considered errors.
- Created Date is blank
- Close date is not entered when Status is OPEN/LOST
- Closed Date < Created Date
- Stage Date < Previous Stage Date
The error applications will not be included in the Dashboard sheet.
Step 3: Updating a Deal
As we continue to work on deals, new information may arrive. Based on that, we need to update the deals.
Update Win % for deals as needed, so that your active pipeline is always reflecting the reality.
Enter stage dates when deal reaches each stage.
Step 4: Closing a Deal
Deals can be closed if a decision has been taken by the customer to purchase. This is the scenario of a deal WON.
If prospect decides to not to purchase or if it has been a while since the prospect has been in touch, we can close the deal as LOST.
We can enter this information by entering the STATUS to be ‘WON’ or ‘LOST’. The values must be exactly WON or LOST. Other values are not allowed.
Then, we should enter the CLOSE DATE. This date is used to calculate the Average time taken to close a deal.
If the Status is Won or Lost but Close Date is left blank, you will see a red border indicating that the entry is missing.
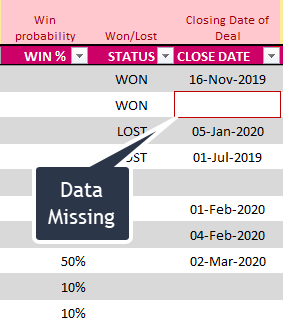
This red border will also appear if Close Date is less than Create Date. This is to ensure that the data is accurately entered.
Win % could be deleted for closed deals as we already know the result of the deal. They will be ignored for calculations.
If deal is lost, enter Lost Reason.
Step 5: Monitor Sales Pipeline performance
This step is one that should be done regularly. It is important to keep an eye on the pipeline metrics to improve performance.
Assessing Performance of closed deals
The DASHBOARD sheet provides information on performance of all your closed deals.
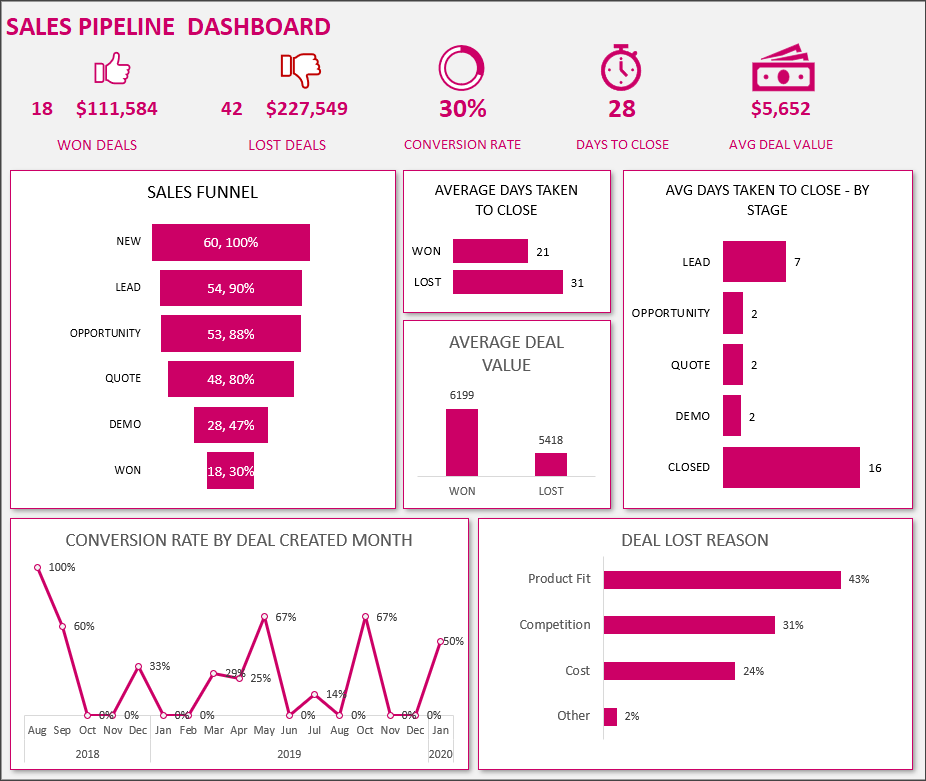
The top section of the sheet shows several important metrics needed. Let’s discuss one by one.
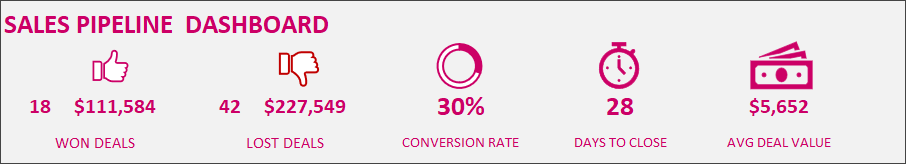
Deals Won and Lost: In the sample above, 18 deals were won for total of $111,584 and 42 deals were lost valued at a total of $227,549.
Conversion Rate: 30% of deals were Won.
Average Time to Close Deals: The 60 deals closed took on average 28 days to close. This is based on the Close Date and Created Date we entered for each deal.
Average Deal value: The 60 deals were on average valued at $5,652.
Sales Funnel: Where do deals drop off?
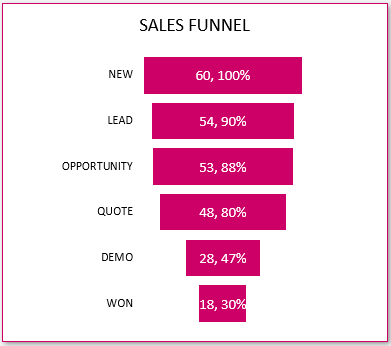
By knowing where the deals are being lost, we can work on those stages to improve our performance.
The Funnel becomes very telling in revealing our strengths and weaknesses. If Demo is the stage we fail most often, we may need to improve the demo event to convince our prospects about the usefulness of our products.
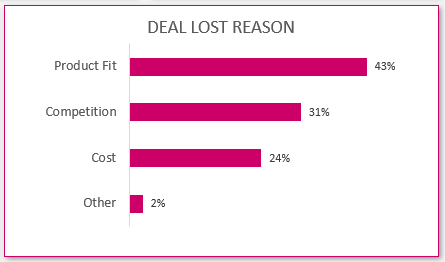
Why are deals lost?
Lost Reason chart shows the top reasons the deals are lost. This is invaluable information to improve conversion rates.
Analysis
The Dashboard also allows analysis of performance by attribute.
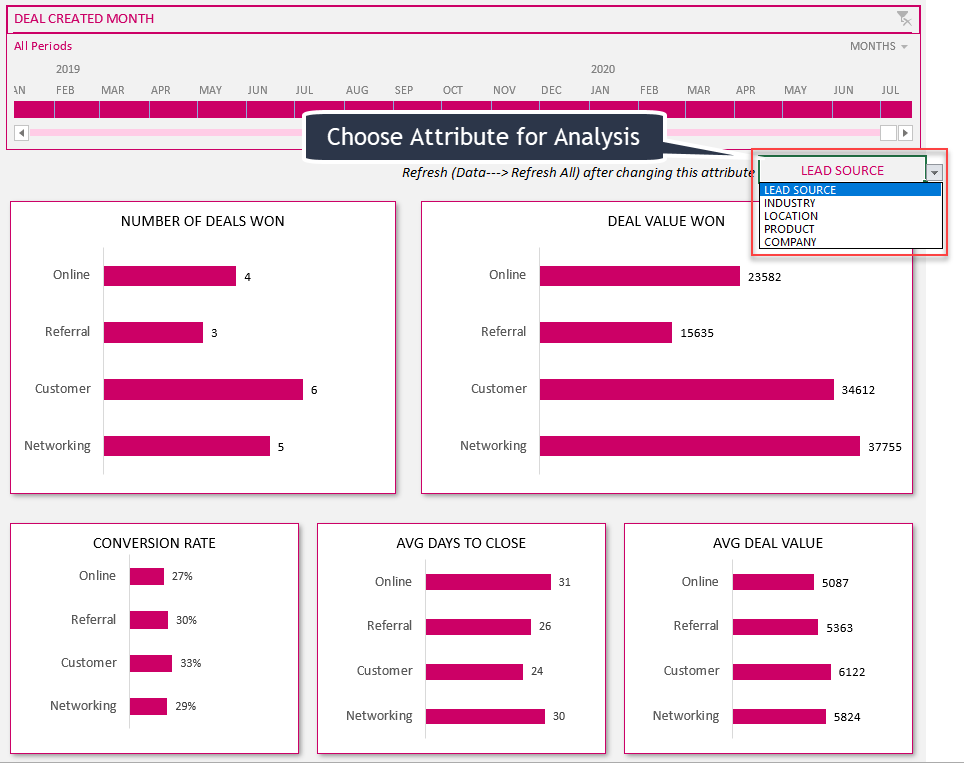
This allows you to see what type of deals are being successful and thus enable you to take decisions on future deals selection process.
These attributes can be cutomized by you as explained in the previous step.
Active Pipeline
Use the Active Deals sheet to view information on active (or open) deals.
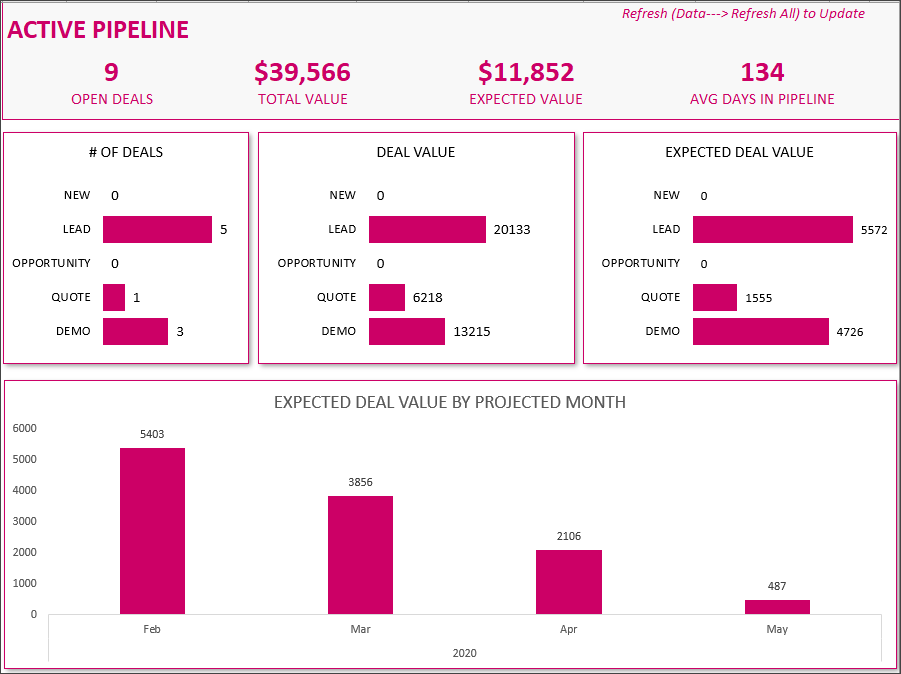
Open Deals: This represents the number of deals that are not closed yet. Any deal whose status is empty (neither WON nor LOST) will be considered as an open deal. Once a status is entered, it becomes a Closed Deal.
Total Value: This is the total value of all open deals. The Deal Value we enter in the Deals table will be used as such. If we win all the open deals, this is the amount we will successfully sell.
Expected Value: The reality is that we will win some deals and lose some deals. So, it is better to be realistic about our estimated sales. Expected value is the weighted sum of deal value by Win %.
Avg Days in Pipeline: This represents the number of days from Deal creation Date to current day, that the deal is open for.
Step 6: Track Sales Activities
The template also has an optional sheet which you can use to track interactions/activities with clients.
- To add a new activity that you are planning in future, just add a new row to remind you of an activity that you need to perform for a specific deal. Leave the Notes field empty. This tells the template that the activity is not completed.
- When the activity date is passed and the notes field is empty, the template will count that as an activity past due date. The counter at the top PAST DUE will show the number of tasks past due date.
- When you actually perform an activity, enter the details in the Notes field. This tells the template that the activity has been completed. The PAST DUE counter will not count the activity as Past Due anymore.
How you can use this on daily basis.
The DUE TODAY counter counts the activities with Activity Date = Today.
You can filter the table on ACTIVITY DATE to today’s date to only see activities that are due today or any specific date.
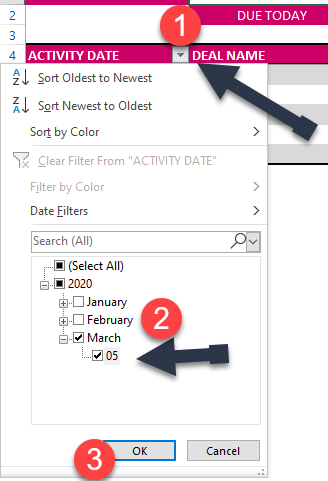
When you perform one of those activities, enter in NOTES field.
FAQ
1. How to filter deals?
Since we are using an Excel table, we have the default features such as filtering and sorting.
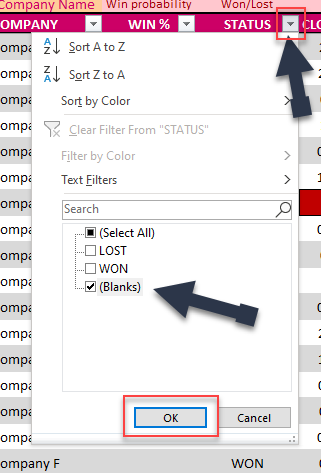
Filter Deals table by Status – Select Open Deals
In the image above, I have selected (blank) for Status. This will now filter the table to show only deals that are open.
Filtering Deals based on deal values: For example, if we want to filter only deals of values > $5000.
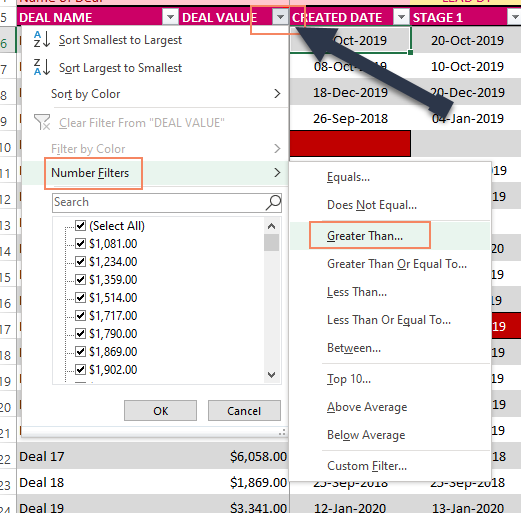
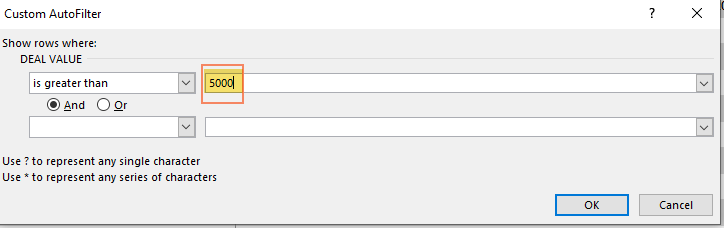
The above (Greater Than) is just an example. You can use all other types of filtering available in Excel tables. You can use the filters in any of the fields (example: Company).
2. How to sort deals?
You can also sort deals.
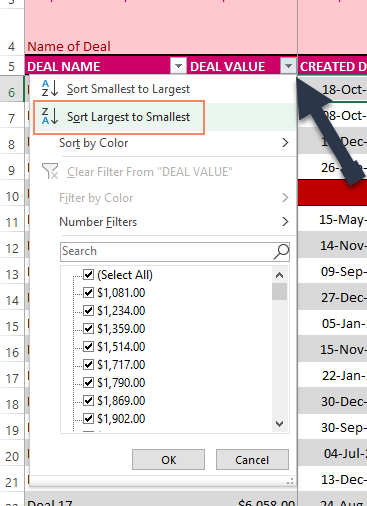
The above shows sorting by Deal value. You can also sort by other columns such as Win % to see the highest win % deals.
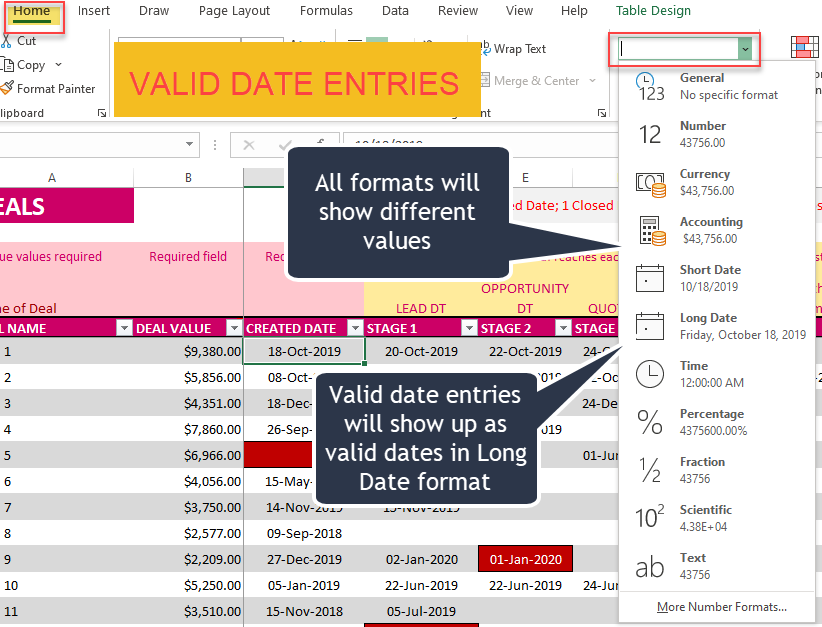
3. How to check date is entered correctly?
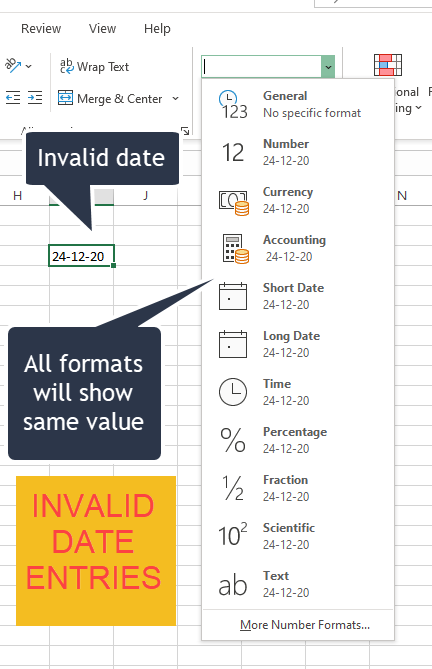
When entering date in Stage Dates, it is extremely important that Excel accepts them as valid date format. Excel has sometimes different formatting based on language/region/country of installation. When entering dates, please check if the date entered is accepted as date by Excel.
An example of a valid date entry and how to find if it is valid.
An example of an invalid date entry. This is how to spot such entries.
4. How to use slicers in dashboard?
To select multiple values in one slicer, press ctrl key while selecting values in a slicer.
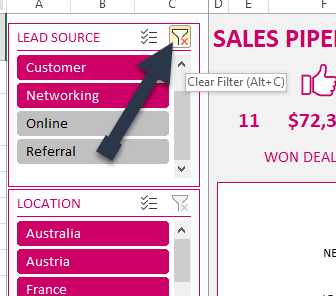
To clear all selections press the ‘Clear Filter’ button at top right of the slicer.
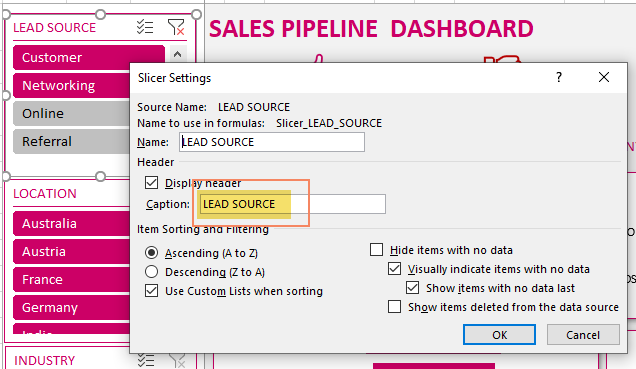
To change the name of a slicer, please right click on Slicer name and choose Slicer Settings. Then, change the Caption to update the name.
5. How to modify Currency?
The template by default uses US$ as currency. To change, just select the cells where you want to change the currency. Then, press Ctrl+1.
Then, change the currency symbol in the dialog box as shown above.
6. How to add extra column in DEALS sheet?
You can create a column easily by typing the new column name in cell AA5.
After that, if you need another one, enter a column name in cell AB5.
7. What if a deal skips a stage?
If a deal skips a stage, please leave it empty. The template has calculations in place to handle this. It will assign 0 days as time taken for that stage automatically.
8. Is the file password protected?
Yes, password protected to prevent unintentional editing. Please use indzara as password to unprotect.
9. How to change the bar chart colors ?
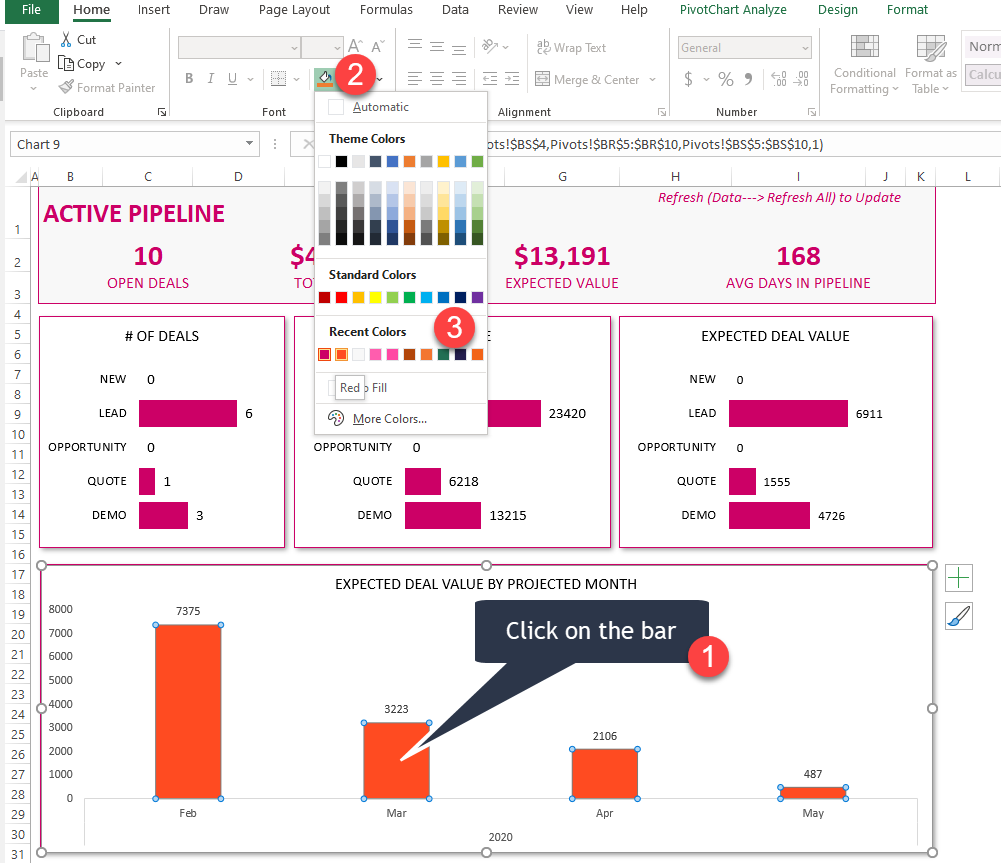
In case the chart’s bar colors change to Excel’s default blue and you need to change it, or you just want to change the color to something you prefer, please follow the following steps.
Click on the chart’s bar. This should select all the bars.
Then, in the format menu, choose your preferred color as shown below.
Leave a Reply