2016 Olympics Dashboard – Explore Rio Olympics data in Excel
The purpose of this 2016 Olympics Dashboard is to create an interactive tool to access and explore results of the recently concluded Rio Olympics (link to Wikipedia). This was the first Olympics that I watched with my son and so it’s very special to me. 🙂
Another important objective is to openly share the data on the results with the users in a consumable format so that others can use the data for various analyses. I will share more about my challenges in data collection later in this post.
Viewpoint
As with any such dataset which spans a variety of data elements, the possibilities are endless. (My attempt to capture Cricket World Cup 2015 in Excel Dashboard) I decided to approach the Olympics data set in the following dimensions.
- Olympic View
- Which countries won the most medals overall in 2016 Olympics?
- Who are the top athletes and how many medals did they win?
- Which sports contributed to most medals?
- Country View
- In which sports did a country win the most medals?
- Who are the top athletes in a country and how many medals did they win?
- Which sports were dominated by the country?
- Sports View
- Which countries won the most medals in a Sport?
- Who are the top athletes in a Sport and how many medals did they win?
- Which countries are most dependent on the Sport for their medals?
- Event Results
- Who won the medals in a specific event in Rio Olympics?
Having access to such rich data, while still keeping the tool simple and compact was a challenge. I ended up with a one-page compact dashboard which allows the user to switch between 3 views (Olympic View, Country View and Sports View).
Key Features of 2016 Olympics Dashboard
- Dynamic One-Page dashboard that adapts to user selections
- All the medal counts are calculated with formulas based on raw data
- Flags of countries and logos of Sports
- Scroll bars to let user see more data
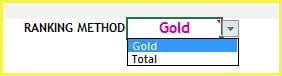
- Ranking Method Choice: Choose whether Total medal count or Gold medal count should be considered for ranking the countries.
- Apparently, the Olympics Committee does not provide any official ranking and countries can decide which method to use.
- Calculations on Sports Domination and Sports Dependence of countries.
- Accounts for the unusual scenario such as 2 Gold medals, 3 Silver Medals & 2 Bronze medals
- Raw Data can be viewed and used to create analyses and dashboards
FREE DOWNLOAD
Now, let’s see how the dashboard works. If you prefer the video, please watch this video demo. If you prefer text and screenshots, please continue reading.
VIDEO DEMO
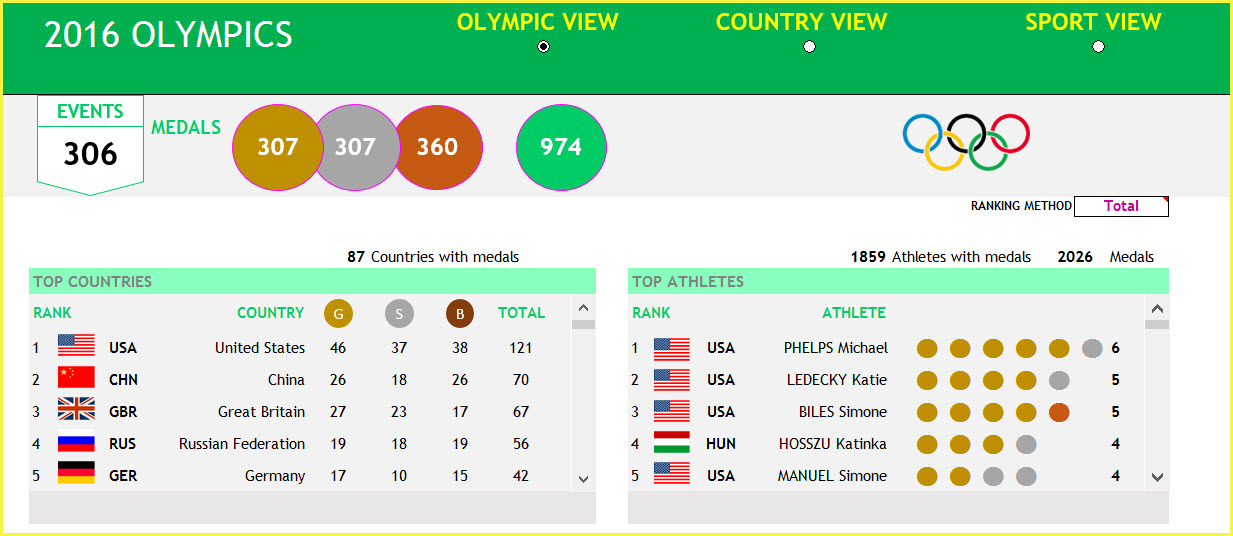
At the top of the Dashboard, we choose one of the three views. Let’s start with Olympic View.
Olympic View
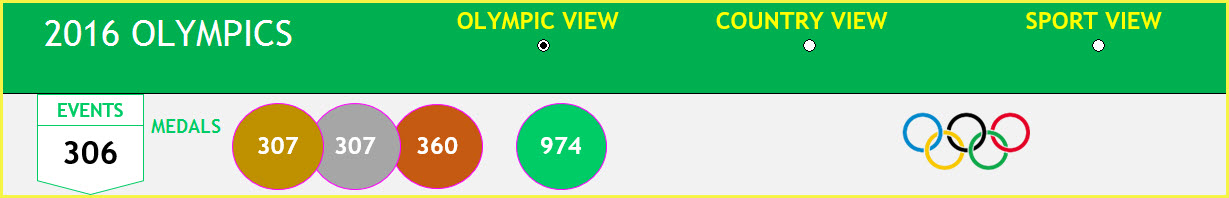
There were 306 events that awarded 307 Gold, 307 Silver and 360 Bronze medals – totaling to 974 medals.
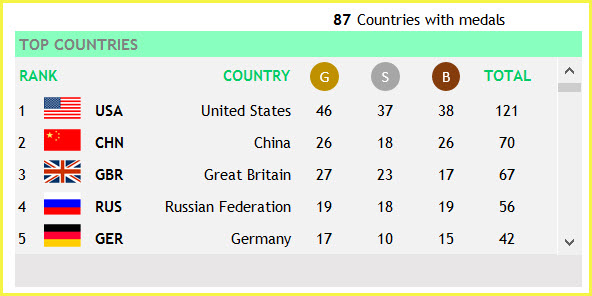
In total, 87 countries won at least one medal and the top countries are displayed along with their rank, flag, number of Gold, Silver and Bronze medals. You can scroll using the scroll bar to see the next set of countries. The Ranking method used is Total, where Total medal count is given the most importance. So, China is ranked #2 based on its higher medal count of 70 compare to 67 from Great Britain. (Reference: 2016 Olympics Medal Tally in Wikipedia)
We have an option to choose the Ranking Method of Gold to rank countries based on Gold-Silver-Bronze medal count and ignoring Total medal count.

Now, China moves to 3rd, as it has only 26 Gold medals compared to Great Britain’s 27.
Let’s get back to the Total ranking method and view the next table.
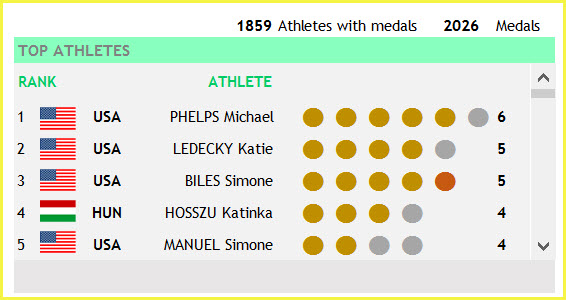
When we look from the athletes’ perspective, there were 1859 athletes who received at least one medal and totally 2026 medals were given to all athletes. You can use the scroll bar to view more athletes. (Reference: Medal Count by Athletes)
We have to remember here that this athlete level medal count will not match the country level medal count. For example, a Swimming 4 X 100 Relay team that won the Gold medal will count as 1 medal for its Country, but each of the 4 swimmers of that team will individually receive a Gold Medal – counting as 4 medals in total.
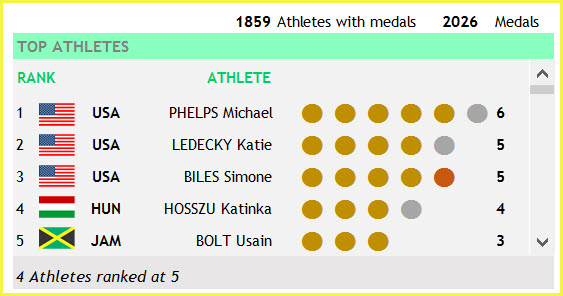
Usain Bolt doesn’t appear in the top 5 athletes based on the total medal count. If we switch the ranking method to Gold, then, he comes at #5 as he has 3 Gold medals. (4 athletes including Usain) have 3 Gold medals.
The chart below shows which sports contribute to most medals.
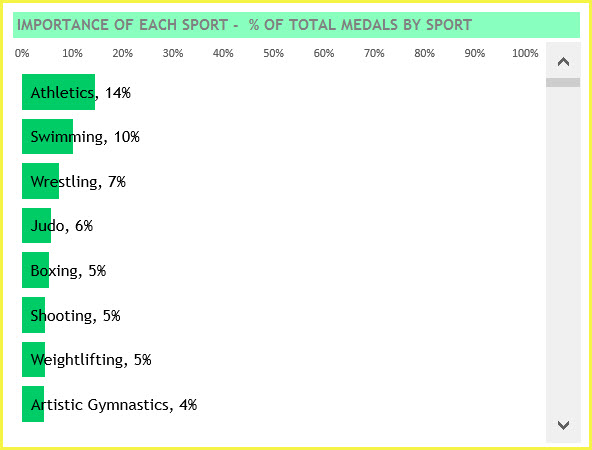
Athletics and Swimming add up to about quarter of all medals.
Country View
Let’s switch to Country View.
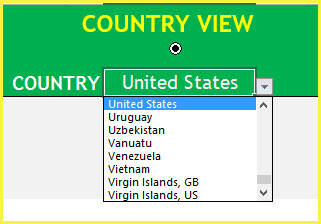
I have chosen United States, as the country with most medals.
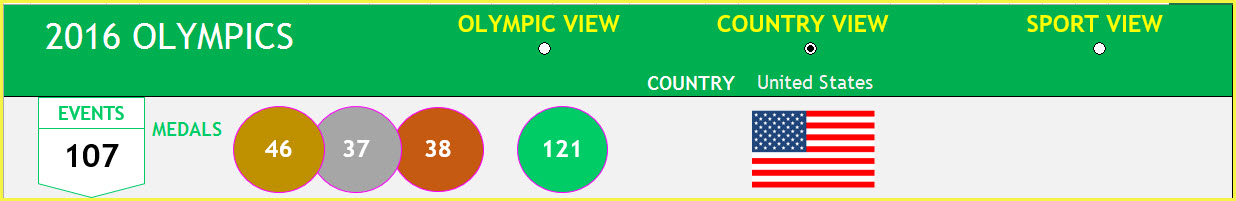
The top section updates to show the number of events where United States has won at least one medal, along with Gold, Silver, Bronze and Total medal counts. Flag appears as well.
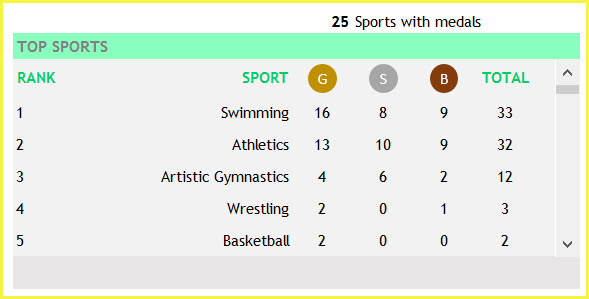
This table above helps us understand which Sports United States got its medals from.
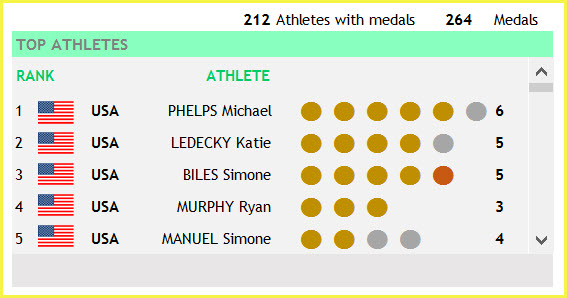
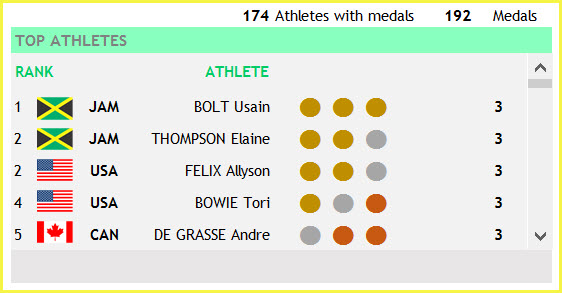
212 Athletes received at least one medal and we can see the top 5 medal winners including Michael Phelps. The medals won by the athlete are shown using the circles of corresponding color (Gold/Silver/Bronze).
The next chart is very interesting to me. I was curious to know which sports were dominated by a country.
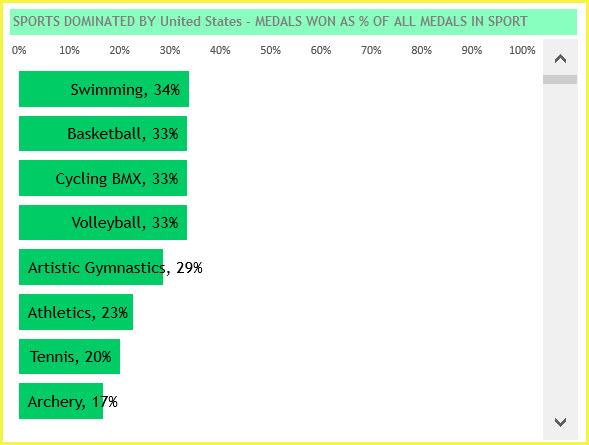
We see that of all medals in Swimming, 34% is won by United States. 23% of Athletics medals is won by United States.
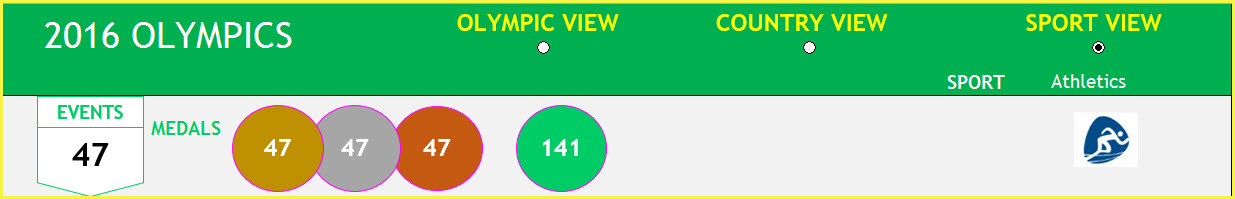
Sport View
We can switch to Sport View and then choose a Sport from the drop down list.
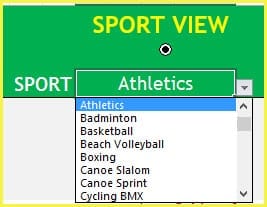
I have chosen Athletics here.
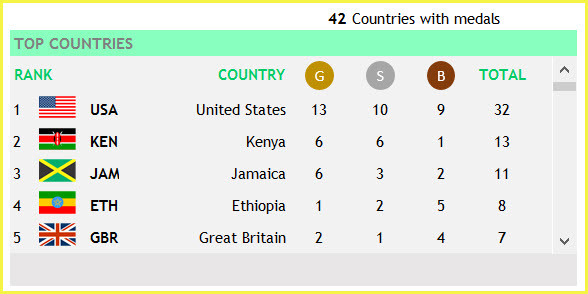
Another angle in which we can view is the dependency of a country on a specific Sport.
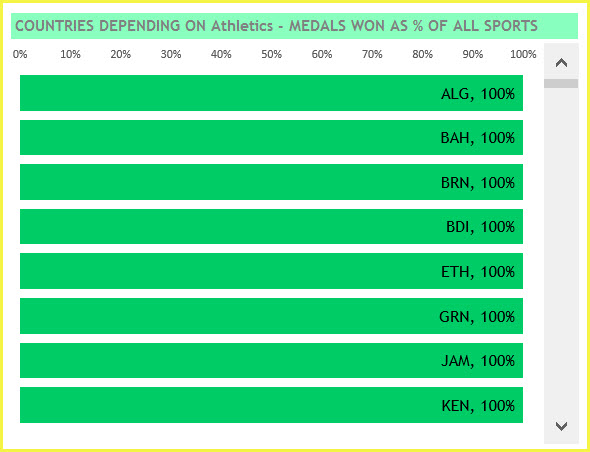
For Athletics, we see a lot of countries receiving all their medals (granted, there could be just one medal and 1 out of 1 is 100%) from Athletics alone. Let’s take Swimming as an example.
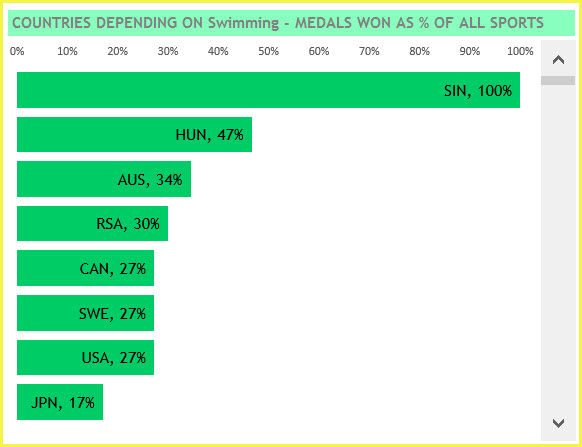
Singapore received 100% of its medals from Swimming (Singapore’s Gold medal), while USA received 27% of its medals from Swimming.
Event Results
In the bottom right of the Dashboard, we can view any event’s results. The drop down list is dependent on which Sport you have selected at the top of the dashboard. In this example below, we have selected Badminton as Sport.
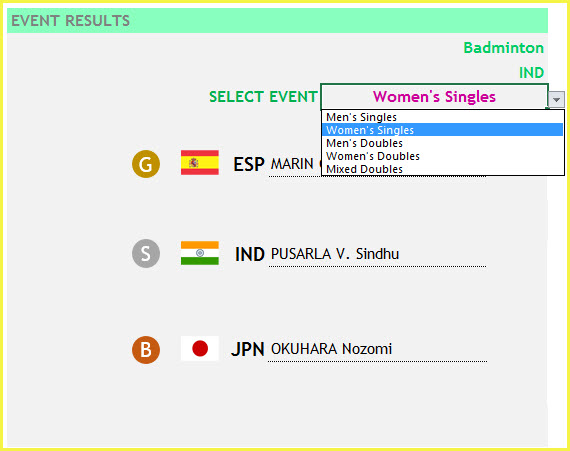
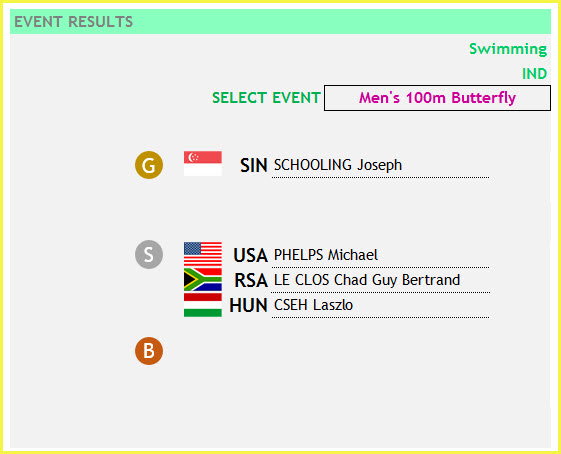
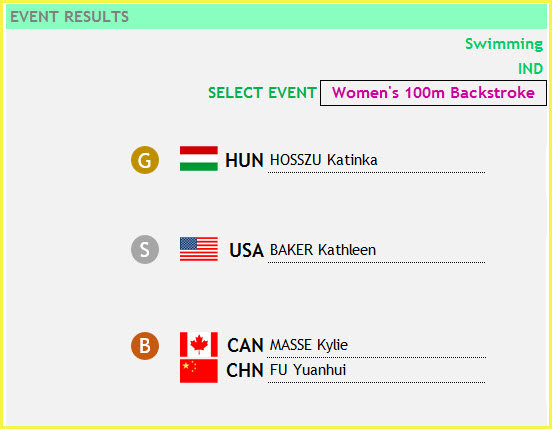
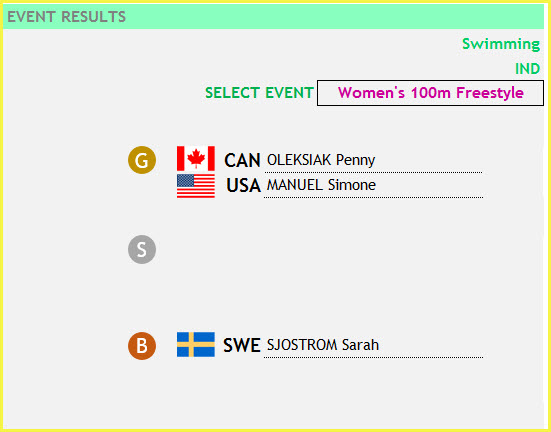
We can view the Gold, Silver and Bronze winners – Flag, Country and Athlete name. The above results are in the usually expected format. Sometimes we see ties and here are some examples.
3 Silver medal winners and no Bronze winners in Men’s 100m Butterfly Swimming
2 Bronze winners in Women’s 100 m Backstroke in Swimming
2 Gold medal winners and no Silver medal in Women’s 100 m Freestyle in Swimming
Data Collection
The collection of data for this Dashboard was a huge challenge. When I started looking at 2016 Olympics’ results, I found cleaner data on events’ results in the official Rio Olympics site. There are some minor issues with events where there are 2 Bronze winners (Example: Judo, Taekwondo), but that was manageable.
After compiling the event results, I needed the data on Athlete medals. For example, a Swimming 4 X 100 Relay event will list United States as the Gold medal winner, instead of the swimmers’ names. But I need each of the swimmers’ names so that I can count their individual Gold Medals. This count is important as Michael Phelps needs to be assigned that medal. Otherwise, his medal count will be incorrect.
Unfortunately, the official Rio Olympics site does not have this data in an easily exportable format. I went back to Wikipedia (for 2016 Olympics) to see if they have better data structure. They did, but I couldn’t use it. It wouldn’t be so much fun if everything was so easy. 🙂
Wikipedia lists Athlete names differently (First name first) compared to Olympics’ site (Last name first). Without going further in detail on my challenges with data collection, it should be obvious already that the data collection was very painful. I had to finally collect the data by few different ways (copy/paste from web page, PDF, etc.) – 99% from the Rio site and rest from Wikipedia.
I want to make this data easily accessible for anyone looking to use it. You can unhide the hidden sheets 1) 2016_Events_Results – which has the results of 306 events (one row for each event) and 2) 2016_Athletes_Medals – all the 2026 medals received by athletes.
Please share
I would like to place 2 requests to you.
- I have spent a lot of time to ensure that the data is accurate. However, if you notice any bugs, please post in the comments and I will fix it as soon as I can.
- Please share the link to this post with your friends. If you know of any places to post such data so that anyone who is interested in using this data can download, please let me know.
12 Comments
This is a great dashboard! I would love to learn how you built parts of the actual dashboard.. any tutorials on that?
Thank you for showing interest in our template.
Currently, we do not have a Tutorial on developing this template. We will update you when we create a tutorial for creating this template.
Best wishes.
Hi,
I already download inventory and sales manager template,my question is that template is up to 2000 products only,
1.how can i increase the said numbers up to 10,000?
2. how can use this template for a multiple stores/branches?
3.where do i put our weekly sales vs inventory stocks?
Many thanks
Archie
Thanks for your interest.
I don’t have a template that can handle multiple stores and 10,000 products. I am sorry.
Best wishes.
Nice dashboard and visualization Indzara, But have you considered using Tableau. You can easily create dashboards and Visualizations in real quick time . Or may be you are still using it… 🙂
Thank you for the feedback. I used Tableau for 2 years in my last job. I really liked it. However, I use Excel now to create my applications as more people have Excel installed in their computers. Thanks & Best wishes.
Fantastic work Dinesh! A lot of layers to the dashboard for exploring.
Best,
Ben
Thank you, Ben. Thanks for taking the time to provide feedback. Best wishes.
Amazing dashboard Dinesh! Thank you!
Cheers,
Kevin Lehrbass
Thanks, Kevin. I had fun building it. Thanks for sharing the link. Best wishes.
A wonderful creation. Congratulations.
Thank you very much. Best wishes.